
SpecialAgentK
@t_SpecialAgentK

تریدر چه نمادی را توصیه به خرید کرده؟
سابقه خرید
تخمین بازدهی ماه به ماه تریدر
پیام های تریدر
فیلتر
نوع پیام
SpecialAgentK
RBN/USD Long

RBN/USD طولانی با تجزیه و تحلیل بازه زمانی چهار روزه، آشکار است که قیمت توکن ریبون فاینانس کاهش قابل توجهی داشته است. با وجود این، به نظر می رسد پروتکل دارای پتانسیل امیدوارکننده ای است، که منجر به امکان موقعیت خرید مطلوب می شود در حالی که سرمایه گذاری های DeFi در حال حاضر مورد علاقه سرمایه گذاران نیست. با این حال، توجه به این نکته ضروری است که در کوتاه مدت موانعی وجود دارد که باید بر آنها غلبه کرد، به ویژه سفارش فروش بلاک و یک بلوک سفارش نزولی، که باید قبل از اینکه قیمت رمز به کوتاه مدت خود برسد، از آن فراتر رفت. href='https://sahmeto.com/coins/PEAK' target='_blank'> اوج با سهولت بیشتر. در حالی که روند فعلی برای قیمت رمز Ribbon Finance نامطلوب بوده است، مزایای بالقوه پروتکل اساسی و سیگنالهای فعلی در بازار Cypher B یک فرصت احتمالی برای تغییر روند را نشان می دهد.
SpecialAgentK
BTC Short

BTC کوتاه زمانی که قیمت بیت کوین به سطح 24,842 دلار رسید که به نظر من یک سطح است، به دنبال ورود به یک معامله طولانی مدت هستید. مقاومت قوی. قیمتی که من انتظار دارم پس از رسیدن به این سطح، حتی پایینتر از آن را فشار دهد، تا زمانی که با مقاومت بیشتری در مشخصات محدوده حجم مواجه شود. علاوه بر این، نشانگر ترتیبی Tom DeMark همچنین نشان دهنده مقاومت در این ناحیه است، که بیشتر از ایده پشتیبانی می کند. زمان نشان خواهد داد که ما به سمت پایین شبکه می شویم.
SpecialAgentK
ETH Long

به دنبال این هستیم که ببینیم آیا قبل از از سرگیری روند صعودی، افت می کنیم یا خیر.
SpecialAgentK
APE Long
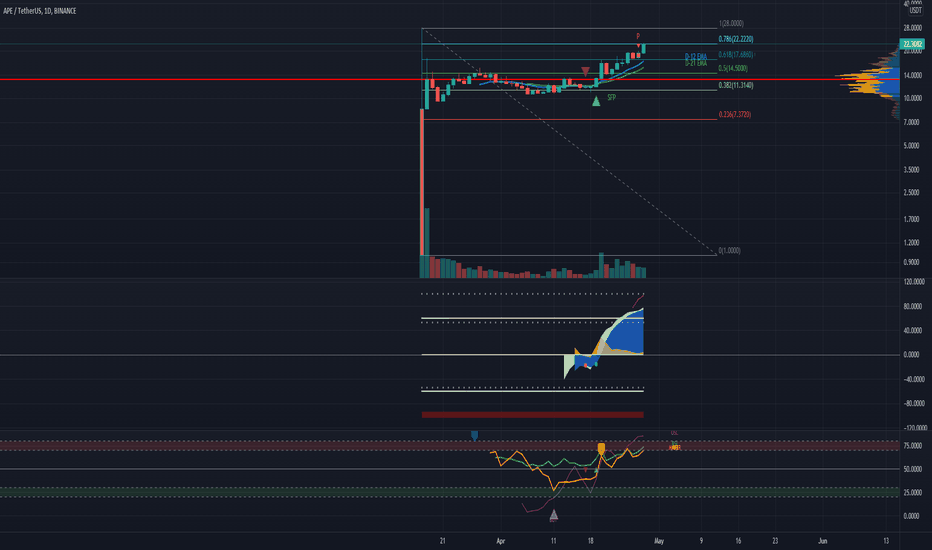
دیدگاه دیگری که ممکن است از فشار به بالاترین سطح تاریخ پشتیبانی کند.
SpecialAgentK
APE Long

احتمالاً به 24.4 دلار رسید، شاید به بالاترین سطح تاریخ دست پیدا کنیم؟ بیایید ببینیم این به کجا می رود.
SpecialAgentK
BTC Short

هنوز منتظریم تا همه نزولی ها ظاهر شوند. در اینجا چند هدف برای تماشا وجود دارد.
SpecialAgentK
BTC Short

من به تصویر بزرگتر نگاه میکنم تا ببینم آیا میتوانم برخی پایینترین قیمتهای بیت کوین را پیدا کنم. امیدواریم که ما تقریباً به پایین ترین سطح نزدیک شده ایم، اما اگر خط روند نتواند حفظ شود، ایده های دیگری نیز ارائه می کنم.
سلب مسئولیت
هر محتوا و مطالب مندرج در سایت و کانالهای رسمی ارتباطی سهمتو، جمعبندی نظرات و تحلیلهای شخصی و غیر تعهد آور بوده و هیچگونه توصیهای مبنی بر خرید، فروش، ورود و یا خروج از بازارهای مالی نمی باشد. همچنین کلیه اخبار و تحلیلهای مندرج در سایت و کانالها، صرفا بازنشر اطلاعات از منابع رسمی و غیر رسمی داخلی و خارجی است و بدیهی است استفاده کنندگان محتوای مذکور، مسئول پیگیری و حصول اطمینان از اصالت و درستی مطالب هستند. از این رو ضمن سلب مسئولیت اعلام میدارد مسئولیت هرنوع تصمیم گیری و اقدام و سود و زیان احتمالی در بازار سرمایه و ارز دیجیتال، با شخص معامله گر است.