
SmartMoneyDayTrading
@t_SmartMoneyDayTrading

تریدر چه نمادی را توصیه به خرید کرده؟
سابقه خرید
تخمین بازدهی ماه به ماه تریدر
پیام های تریدر
فیلتر
نوع سیگنال
SmartMoneyDayTrading
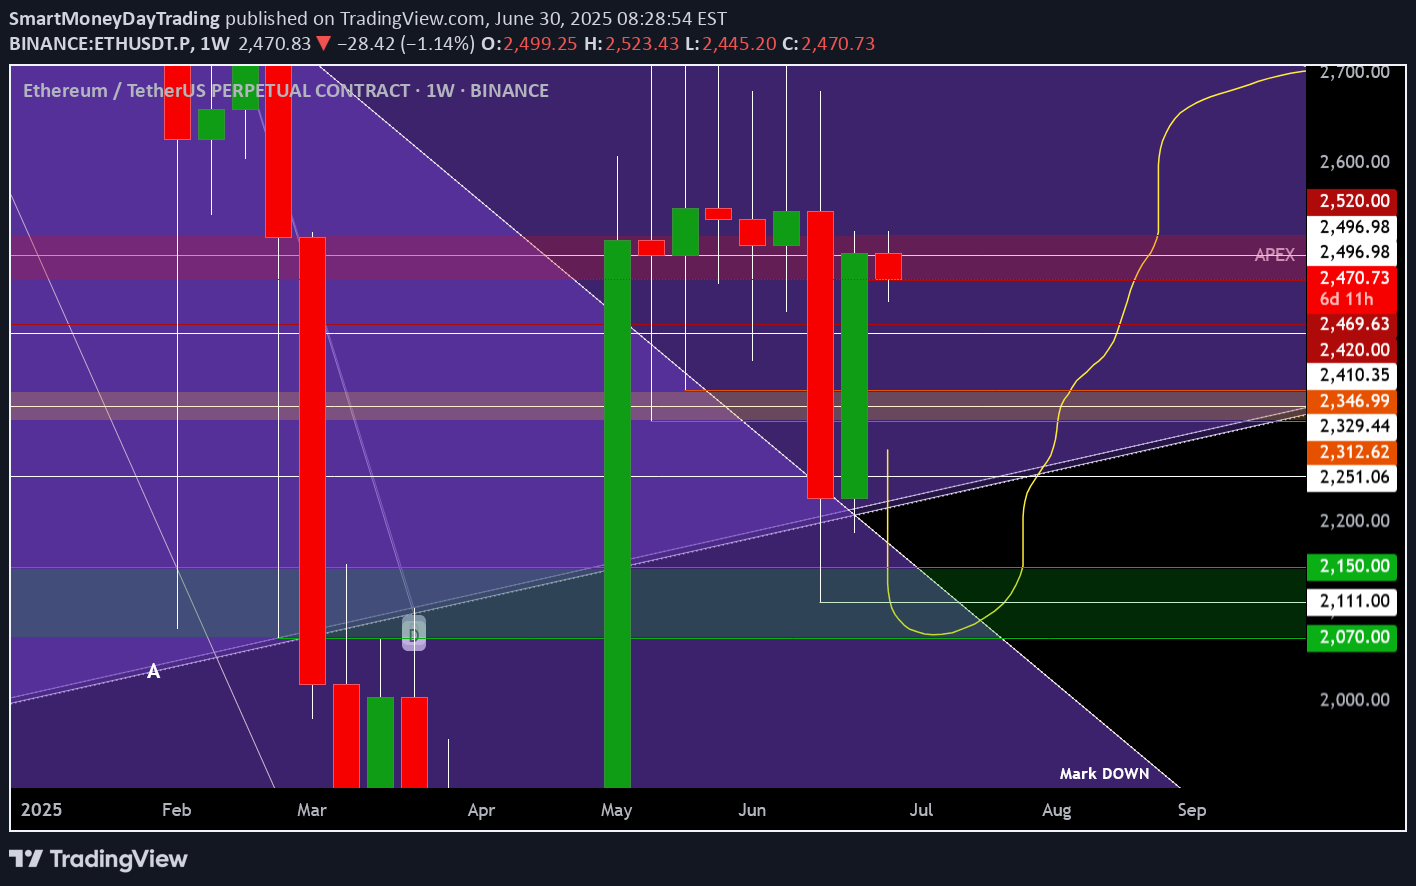
هنگامی که محکومیت شکست خورد: رد apex ، توزیع مجدد پنهان و توهم تقاضا صبح بخیر ، عصر بخیر ، عصر بخیر ، هر کجا که از آن ضربه می زنید. اکنون ، مثل همیشه ، من اینجا نیستم که وقت شما را با وافل غیر ضروری هدر دهم. بیایید مستقیم به آن بپردازیم و این آشفتگی گام به گام را باز کنیم. رد apex | بیش از فقط یک فتیله بنابراین با انتخاب از به روزرسانی هفته گذشته ، خودمان را در چهارراه می بینیم ، و نه نوع عاشقانه. آنچه که ما در حال حاضر به آن نگاه می کنیم ، یک رد قطعی تمیز و در عین حال 100 ٪ از اوج یک ساختار کلان کلیدی است. این فقط هیچ سطحی نیست. این تقاطع حرکت عمودی و حافظه افقی ، اوج یک مثلث است که ماه ها در حال شکل گیری است. این جایی است که قرار بود قصد صعودی داشته باشد ، قرار بود تسلط خود را ادعا کند ، اما در عوض ، ما چه چیزی را بدست آوردیم؟ فشار شدید به مقاومت ، عدم رفع بالای آن ، و به دنبال آن فرسودگی و علائم تخلیه نهادی. حال ، به چشم آموزش نیافته ، این ممکن است مانند یک عقب نشینی یا حتی یک اصلاح سالم به نظر برسد. اما ما اینجا نیستیم که نمودارهای خود را با عینک خرده فروشی بررسی کنیم. ما در اینجا هستیم تا هدف واقعی عملکرد قیمت را ردیابی کنیم ، و اگر نقشه های خود را می شناسید ، این توزیع مجدد است. و نه فقط هرگونه توزیع مجدد ، نوعی که درست قبل از تغییر بازار شخصیت خود اتفاق می افتد. ما کجا در شماتیک هستیم؟ اگر منطق Wyckoff را در بالای این ساختار پوشش دهیم ، بسیار واضح است: ما PSY (پشتیبانی اولیه) خود را داشته ایم. به دنبال آن یک بهار ، لرزش و تظاهرات جعلی. اکنون ما در حال رقصیدن در مورد آنچه به نظر می رسد UTAD (بالادست بعد از توزیع) است - اما ضعیف تر است. این توزیع کلاسیک نیست ، توزیع مجدد در سردرگمی کلان است. این چیز است این محدوده فقط ادغام قیمت نیست ، بلکه شرط رفتاری است. این جنبش طولانی و تند و تیز به گونه ای طراحی شده است که هر دو گاو و خرس را از بین ببرد ، و باعث می شود آنها تعصب خود را زیر سوال ببرند ، خطر خود را سوء استفاده کنند و یا خیلی زود از آن خارج شوند یا از آن خارج شوند. بازار روشمند است ، نه تصادفی. این شمع ها تصادف نیستند ، آنها ردپای تنظیم تله الگوریتمی هستند و در حال حاضر ، به نظر می رسد که شبکه در حال بسته شدن است. جلد حقیقت را می گوید فراموش نکنیم حجم. از طریق این فشار اخیر به حجم هفتگی نگاه کنید: کاهش حجم در تظاهرات ، حجم بالاتر در red بسته می شود ، و چندین سنبله که نتوانستند قیمت مقاومت گذشته را تحمل کنند. این هدیه مرده شماست. لازم نیست جادوگر باشید ، فقط سرنخ ها را دنبال کنید. قیمت تحت فشار قرار می گیرد ، برداشته نمی شود. تقاضا قدم نمی گذارد ، نقدینگی حذف می شود. این تجمع پول هوشمند نیست ، اگر در پایان این هفته تأیید شود ، این آخرین حرکت به سمت بالا در انجام بارگیری پول هوشمند ، بی سر و صدا و کارآمد انجام می شود. نشانه گذاری مقدماتی است بیایید اکنون به فیل موجود در اتاق ، دامنه کم و نقطه C مثلث در 4 ساعت بپردازیم. حرف کلاه جایی که نقدینگی نشسته است. این جایی است که هدف بعدی بازار نهفته است. ما اکنون نتوانسته ایم اوج را پس بگیریم ، فتیله به پایین سیلی زده شد ، و مگر اینکه چیزی قابل توجه تغییر کند ، حرکت منطقی بعدی این است که آن نقطه C را جابجا کنید ، پشتیبانی عاطفی را بیرون بیاورید ، و یا: به تقاضای واقعی (در صورت وجود) ضربه بزنید ، یا آبشار را به سمت مناطق نهایی تقاضای سبز بین 2،150-2،070 شروع کنید ، که هفته ها پیش آن را مشخص کردیم. و فراموش نکنید ، این رفت و برگشت ممکن است تمیز نباشد. ما می توانیم یک گزاف گویی جعلی را در میان برد-به اندازه کافی برای طعمه های بیشتر ، فقط دوباره بچرخیم. لایه روانی آنچه در اینجا اتفاق می افتد فقط فنی نیست ، بلکه جنگ عاطفی است. این محدوده کل یک چراغ گاز طولانی برای یک معامله گر متوسط بوده است. بین شکست های شکست خورده ، شکست های شکست خورده و رفتار داخل دهانی هرج و مرج ، خرده فروشی به نقدینگی تبدیل شده است. و اگر هنوز سعی می کنید در بالای این کورکورانه در بالای این کار باشید ، به امید 3K ETH بدون ساختار تأیید شده ، امیدوار باشید ، پس با احترام ، شما در حال حاضر محصول هستید. در قسمت بعدی 2: یک شکست کامل از مجموعه ماکرو 4H تجزیه و تحلیل مکانیک محدوده داخلی مناطق فیبر محاسبه شده جیب نقدینگی که در آن قرار دارند چه محتمل ترین مسیر کوتاه ، متوسط و بلند مدت است با ما همراه باشید - من flow منسجم ، ساختار یافته و پرخاشگر را حفظ کرد. بدون کرک بدون هاپیم فقط ساختار ، روانشناسی و اجرای.
SmartMoneyDayTrading
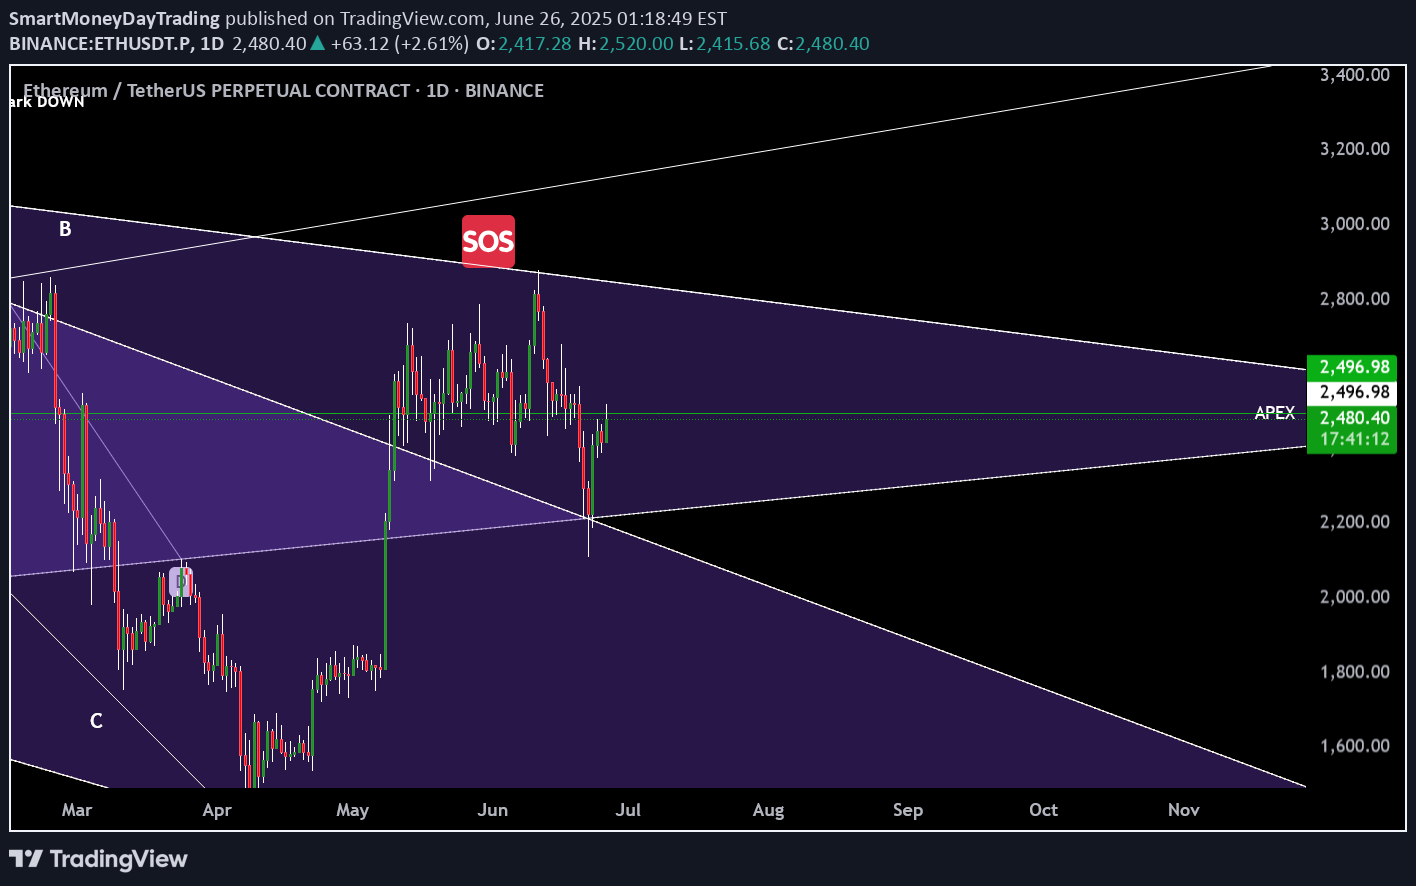
In just four days, ETH has impressively climbed 19.37%, achieving a substantial trading volume of 34.9 million, indicative of both renewed interest and heightened speculative activity. This sharp move follows two intensely impulsive trading days that thrust price upwards aggressively, followed immediately by two days of intermittent volatility and macro consolidation—perfectly manifesting the anticipated Bart Simpson pattern previously identified and traded with clinical precision. Our initial boundary of the macro distribution zone at 2470 marked a critical juncture. ETH faced vehement rejection here, forming a violent wick as price sharply retraced, providing us with the ideal entry for our hedge short. This level—keenly highlighted in prior analyses—initiated a cascade of rapid selling pressure, driving price down with impressive velocity and ferocity directly into the pre-established supply zone. This pullback validated our short, subsequently propelling price downward into demand territory at approximately 2380, where immediate liquidity absorption occurred, confirming demand strength. Notably, ETH’s rapid recovery during the early Asian session surged back towards the optimal trade entry (OTE) region of the redistribution zone, affirming both market efficiency and the dynamic liquidity interplay present. This cyclical behavior reinforces the significance of clearly defined supply and demand zones, which have acted as robust reference points throughout this trading period. At this juncture, ETH finds itself at a critical crossroad—a profound decision point characterized by considerable uncertainty. Three distinct scenarios now dominate trader psychology and technical rationale: Liquidity Hunt Scenario: ETH could swiftly retrace to retest the mean, specifically targeting liquidity pools located near the spring wick from the latest impulse. Such a move would serve to shake out weak longs and solidify the market structure before another upward thrust. Continuation Scenario: A bullish advance could propel ETH towards testing the upper boundary of the overarching macro symmetrical triangle, aligning with continued momentum and suggesting further bullish intent supported by current oscillatory readings. Worst-Case Scenario (LL Scenario): The alternative, more extreme scenario involves ETH breaching structural integrity, aggressively flushing out late entrants with a sharp lower low (LL). While perceived as unlikely given recent volume and market resilience, this outcome cannot be discounted—particularly given global macroeconomic uncertainty and geopolitical tensions. Several exogenous factors compound this uncertainty, most notably ongoing international conflicts and recent market sensitivities tied to off-the-cuff comments from influential figures such as former President Donald Trump. These events amplify volatility potential, exerting tangible influence upon investor sentiment and market positioning. Analyzing the market structurally, ETH price action is now interacting directly at the apex of the current triangle structure, precisely aligning with the 50% Fibonacci retracement of the recent range—a pivotal area frequently respected by both algorithmic and discretionary traders. Complementing this technical view, oscillators such as the Relative Strength Index (RSI) currently hold a neutral stance at exactly 50%, highlighting equilibrium in buying and selling pressure and reinforcing the indecisive nature of the current market environment. However, adding weight to bullish sentiment in the near term, the Commodity Channel Index (CCI) presently indicates upward momentum, suggesting possible further upside if sustained during today's London and subsequent New York sessions. Consequently, immediate trading decisions should remain sensitive to intraday price behavior around these critical junctures. If you've closely tracked my analyses—especially the detailed insights shared in the recent macro Bart Simpson formation update—you'll likely have secured the short precisely at the 2503 rejection point, efficiently hedging against any potential drawdown from open long positions established lower down. This strategy exemplifies disciplined trading, strategically balancing risk and reward, capitalizing on clearly defined market structures and critical levels. Summarizing the current state of play with utmost clarity, ETH stands delicately poised between bullish confirmation and bearish capitulation. Intraday sessions in the coming hours, notably London open and subsequently New York open, are expected to provide the decisive directional impulse. Traders should actively monitor price response at these critical levels, maintaining protective hedges where necessary while remaining flexible and adaptive to emerging market dynamics. In conclusion, ETH’s immediate trajectory hinges upon nuanced market reactions at this strategically significant confluence point. Stay vigilant, as ETH approaches a potentially transformative decision—one offering both substantial opportunity and considerable risk, contingent upon disciplined execution and strategic clarity in your trading approach.
SmartMoneyDayTrading
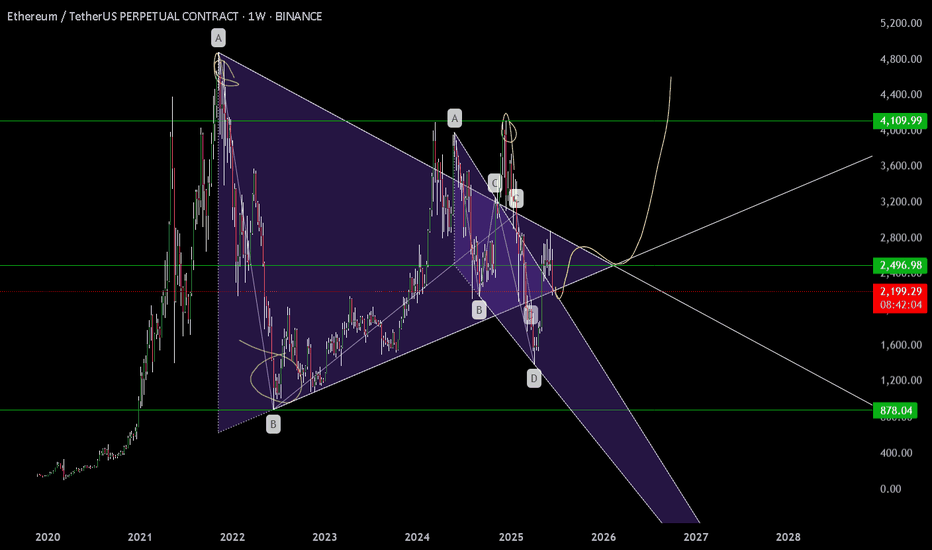
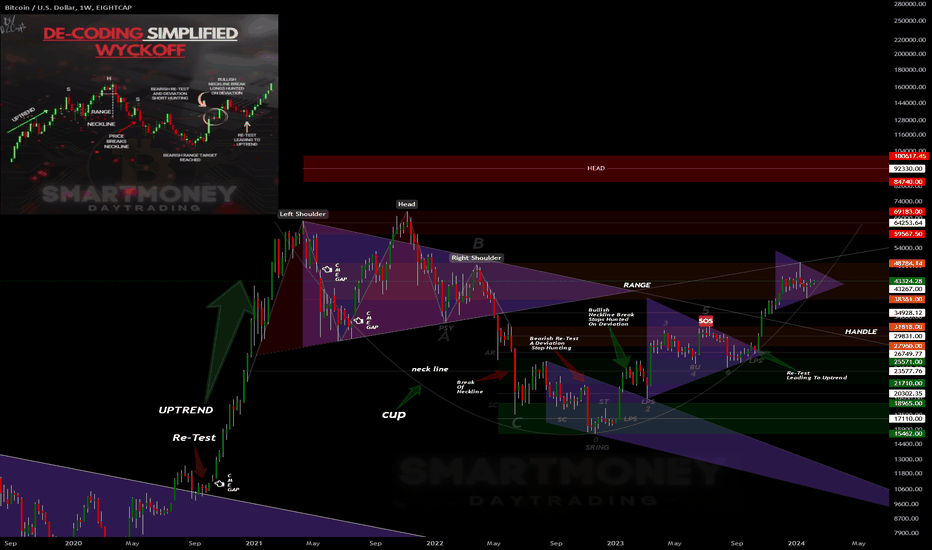
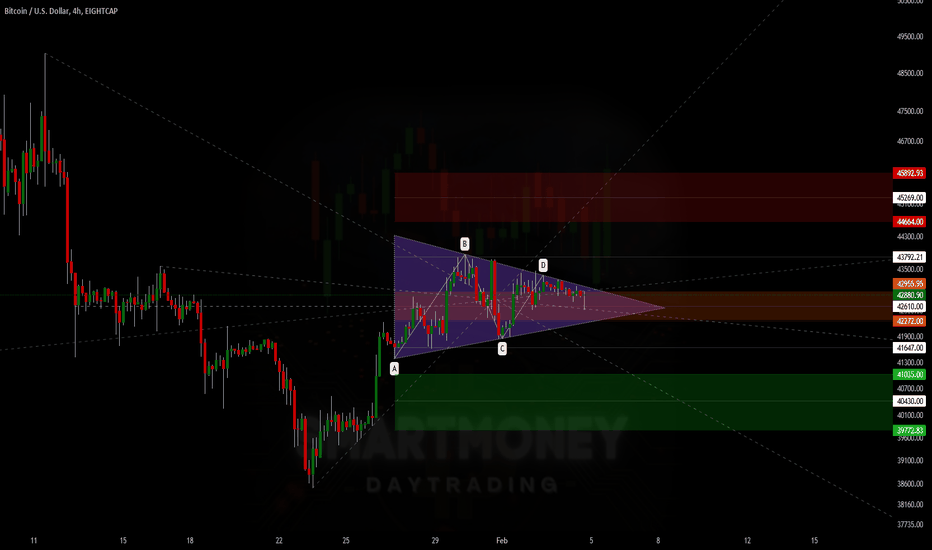
This is my full Ethereum weekly chart analysis — not just what I think might happen, but a walk-through of everything I’ve mapped and labelled, based on how price has behaved since the 2021 top. Every structure you see here is there for a reason — from the symmetrical triangle and wedge, to the Wyckoff schematics, Elliott wave flow, Spring, and more. What we’re seeing now, in my opinion, is the end of a three-year macro compression. The move that follows could define the rest of this cycle. Let me take you through it. After the all-time high in late 2021, Ethereum entered a structured, controlled decline. Not a crash — but a step-by-step transition through market phases. Price dropped and bottomed into a clear accumulation phase — that’s the first box on this chart, labelled as “Accumulation (cause)”. This is where smart money started taking positions, confirmed by the Spring down to 0 and the base of the move at point 2. From there, price consolidated, gained strength, and then jumped the creek — a clear breakout above the accumulation range, which gave us the confirmation for markup. The markup phase took us from that Spring up into a five-wave impulsive move, peaking around the distribution zone. You can see it clearly — labelled Distribution, and boxed off between points A, B, C and the final wave 5. This rally failed to make new all-time highs, stalled, and was rejected cleanly. From there, we rolled over and started losing structure — and this is where it gets important. Right after distribution, we got a breakdown I’ve labelled “Break The Ice”. This wasn’t just another dip. It was the moment we lost all structure from the markup — the line that had held the previous lows snapped, and volume stepped in. This is often the first real signal that we’ve entered the markdown phase. From a Wyckoff perspective, this breakdown is what separates Phase D from the start of a new accumulation cycle. It’s aggressive, deliberate, and clears out late longs — and that’s exactly what it did here. Following that breakdown, we formed a new falling wedge — drawn from the top of the markdown all the way to the most recent lows. Price was making lower highs and lower lows, but with less aggression and momentum weakening. This wedge sits inside the larger symmetrical triangle, which has been developing ever since the 2021 top. The apex of this triangle, marked around $2,496, is where I believe everything will come to a head. Break that with conviction — and we could start a whole new macro leg. But before we get there, something happened worth pointing out. That final breakdown inside the wedge? The one that dipped below and quickly reclaimed? That, for me, was the Spring. It’s labelled in yellow as “Spring” under point D. And it matches the Wyckoff schematic almost perfectly. Volume dried up on the move down. RSI and CCI both showed divergence. Then price bounced hard, reclaimed structure, and we’ve held ever since. This doesn’t look like continuation — it looks like a trap. If that Spring holds, then we’re now in the Sign of Strength (SOS) phase. This is the moment where price reclaims its mid-structure levels, consolidates, and prepares for the breakout. We haven’t broken out yet — but the groundwork is in place. My Elliott count also lines up. We had a 5-wave impulse from the Spring to the failed rally, followed by an ABC correction. What we may now be seeing is the completion of another Wave 2, setting up for a possible Wave 3 — the strongest wave of the cycle, if confirmed. Now let’s talk entries. I’ve got my eye on the $2,130–$2,030 region. That’s where I’m placing my DCA bids. It’s the area just above the Spring reclaim zone, where price should react again if we retest. If we lose $1,690, I consider the Spring invalidated and will reassess. That’s my clean risk level. Break and hold above $2,496, and the breakout is confirmed. That level is not just the wedge and triangle resistance — it’s also the psychological midpoint of this whole macro structure. Everything’s mapped. Structure is clean. Volume is drying up. Momentum is shifting. And price is compressing right into the apex. This isn’t a moment to chase. It’s a moment to plan. If we break out, I’m ready to scale in. If we reject, I’ll be watching the DCA zone and the Spring level closely. Either way, I know what I’m looking for — and I know what invalidates the setup. Let’s see what price does next.Following directly on from my previous macro analysis, let's zoom into what's currently happening on the lower timeframe (30-min chart) and see how Ethereum is behaving in real-time, exactly as we anticipated. Previously, I highlighted the critical breakdown below the macro apex around 2,496—what I labelled our "Break the Ice" moment. As expected, price steadily drifted downward into my pre-defined DCA range between 2,130 and 2,100, aligning perfectly with the lower diagonal support of our larger wedge formation. That move formed a textbook Wyckoff Spring: price gently tapped the lows with diminishing volume, while both RSI and CCI clearly displayed bullish divergence—confirming that selling pressure had effectively dried up, and smart money was quietly accumulating positions. Now, let's closely examine the current 30-minute structure shown clearly in today's updated chart: Since confirming our spring at the wedge’s lower boundary, Ethereum swiftly reversed upward and is now in the process of establishing a shorter-term ascending channel—precisely as we would expect following a successful spring event. Notice how price action has developed a clean harmonic structure within this ascending channel. Initially, we saw a smaller bearish wedge formation appear, labelled on the chart as "Failed bear wedge + Bart formation." Importantly, this bearish pattern failed and resolved upwards, indicating short-term bear exhaustion and providing additional confirmation for our bullish perspective. At this moment, Ethereum is consolidating tightly between well-defined supply and demand zones, currently capped just beneath resistance around the 2,430–2,448 area (labelled clearly as "Supply"). Just above this supply zone, we encounter a critical distribution zone extending from approximately 2,471 up to 2,534, which represents our next major challenge. For bullish momentum to persist, ETH needs to firmly hold above the immediate demand zone between roughly 2,349 and 2,374. From there, we want to see Ethereum decisively reclaim and hold above the immediate supply resistance at 2,448. Successfully reclaiming this key area with conviction and increasing volume would negate the bearish "Bart Simpson" consolidation scenario currently forming. Speaking of which—it's important to note that the current consolidation has started shaping into what traders often describe as a "Bart Simpson" pattern: a quick and impulsive upward move, followed by a flat-top consolidation, which sometimes results in an equally rapid reversal downward. This is definitely something we must watch closely. Therefore, for bullish confirmation, ETH must first defend and hold above the immediate demand zone (2,349–2,374), then convincingly break above supply at 2,448. Clearing that resistance would invalidate the potential Bart pattern, instead paving the way towards our distribution area near 2,534. Securing this higher level with robust volume would align beautifully with our broader macro roadmap, opening up a path for Ethereum to revisit and retest the critical apex level at 2,496. On the flip side, should Ethereum fail to hold this consolidation and break downward, validating the bearish Bart Simpson scenario, we might see price retesting lower demand levels—initially around 2,312–2,269. Should price pressure intensify further, a deeper retest towards our previous spring support at 2,226–2,187 could follow. In any case, the original DCA zone (2,130–2,100) remains my primary area of interest, with the macro invalidation clearly defined at the critical support around 1,690. For now, remain closely focused on these immediate short-term levels—particularly the supply resistance at 2,448 and the crucial distribution zone near 2,534—as Ethereum navigates this pivotal range. Despite the current consolidation and Bart formation, the larger picture remains fully intact, and our broader roadmap continues to unfold as expected. Stay patient, remain prepared, and as always, stay tuned.15min ChartWyckoff Logic: Low Volume / Failed Rally Zooming into the lower timeframe, ETH price action now displays the hallmark characteristics of a Low Volume Rally or Failed Rally within the distribution phase. After reaching up into the critical "Distribution" resistance area (around 2,471–2,534), Ethereum began consolidating sideways within a narrow trading range. This tight, flat consolidation mirrors what traders often recognize as a "Bart Simpson" pattern—characterized by rapid upward movement, low-volume sideways action, and potentially quick downward reversals. In simple terms, what we're seeing here is indecision and exhaustion—bullish strength is waning precisely where sellers historically step back in. Short-term Elliott Wave Structure Looking even closer (on the15-minute chart), price structure clearly outlines an ongoing Elliott corrective sequence. After the sharp impulsive drop from recent highs (Wave 1), ETH retraced upwards (Wave 2), rejected sharply, and has now likely completed or is completing Wave 4—right around the crucial Fibonacci resistance zone between 2,446–2,455. This current wave formation further strengthens the bearish bias, suggesting a final Wave 5 downwards to potentially test lower supports near 2,415–2,400. However, caution is needed: if ETH can reclaim and hold above Wave 2's high (approximately 2,458), this would invalidate the bearish Elliott scenario, suggesting bulls are reclaiming short-term control and targeting a push towards 2,496 once more. Key Levels to Watch Bullish scenario (Distribution invalidated): Break and sustain above immediate supply (2,448), and then distribution zone (2,471–2,534) with clear volume. Bearish scenario (Distribution confirmed): A decisive breakdown below immediate demand (2,412–2,374), followed by lower demand support around 2,312–2,269. Confirmation of Wave 5 downwards towards 2,400–2,415 support. Technical Indicators & Momentum RSI and CCI: Initially displayed bullish divergences during the spring, but short-term RSI is now flattening near neutral levels (~60), indicating weakening bullish momentum. Volume: Currently low—typical of consolidation phases—suggesting a lack of conviction from buyers at current prices. These indicators collectively reinforce our scenario of potential distribution and subsequent markdown unless significant bullish strength returns soon. Market Psychology & Logic Psychologically speaking, the current scenario is classic Wyckoff: the market has attracted late bulls who entered near the recent highs. Now price stalls, causing hesitation, doubt, and potential capitulation if selling picks up. This psychological dynamic could soon create a domino effect—accelerating price downward if support levels fail. Trading Strategy & Risk Management My plan remains disciplined: Bullish Invalidation: A clean reclaim above 2,458 would pause bearish setups temporarily, targeting upside resistance at 2,496. Bearish Confirmation: Look for clear rejections at current levels (2,446–2,455), targeting immediate lower support around 2,400–2,415, and deeper targets at 2,312–2,269 if bearish momentum accelerates. Keep stops tight above recent highs to manage risk effectively, ensuring that any invalidation of our bearish thesis results in minimal loss and quick reassessment. ................................................................................................................. Final Thoughts & Next Steps Ethereum stands right at a pivotal juncture: distribution or reaccumulation. The market structure we've carefully mapped out gives us clear boundaries and actionable levels. Now we let price action speak, confirm our bias, and react calmly and professionally. Stay vigilant, patient, and proactive. Updates will follow as we see decisive moves. Stay safe, and trade wisely.
SmartMoneyDayTrading
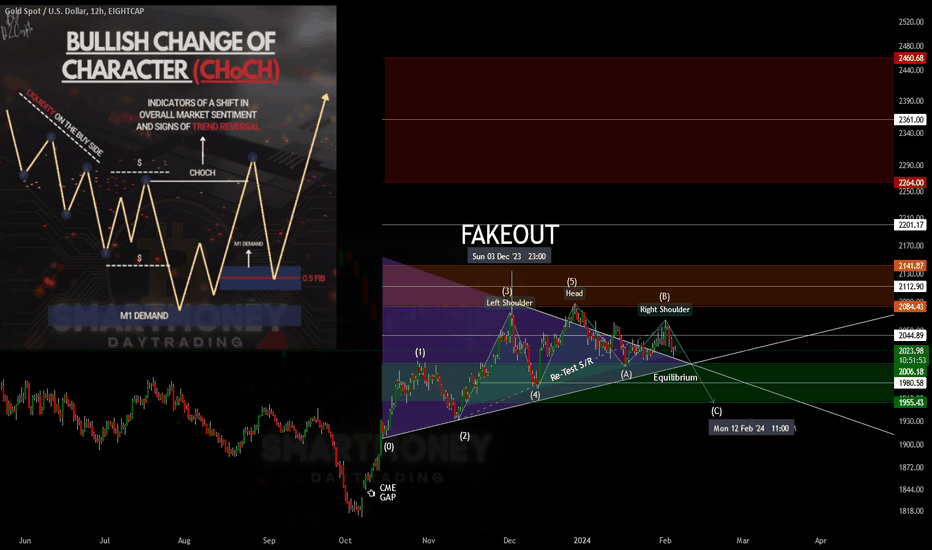
رمزگشایی احساسات بازار از طریق فنی در رقص پیچیده نیروهای بازار ، براق درخشان گلد غالباً بیانگر ظرافت های احساسات اقتصادی و رفتار سرمایه گذار است. الگوهای اخیر مشاهده شده در بازارهای طلا ، که از طریق یک لنز فنی مورد تجزیه و تحلیل قرار گرفته است ، حاکی از تغییر صعودی شخصیت (CHOCH) است که نشانگر تغییر قابل توجه در احساسات و وارونگی بالقوه روند غالب است. نمودار همراه ، یک الگوی زنده زیگزاگ را نشان می دهد ، یک اکو بصری از نقدینگی در سمت خرید ، و به سمت تجمع علاقه به طلا اشاره می کند. این الگوی توسط منطقه تقاضای M1 لنگر زده شده است ، جایی که خریداران از لحاظ تاریخی علاقه شدید نشان داده اند و نشان می دهد سطح بنیادی برای پشتیبانی صعودی است. با این حال ، ما به عنوان معامله گران ، ما باید با مزاحمت بازار برای Feints و شروع کاذب مقابله کنیم. مفهوم "جعلی" گواهی بر این است ، همانطور که در عکس فوری به سمت راست مشاهده می شود. این جعلی خاص روایتی از احتیاط را ارائه می دهد ، یادآوری می کند که حتی در حالی که شاخص ها به شمال اشاره می کنند ، ممکن است مسیر مملو از وقفه های فریبنده باشد که در حفظ آن ناکام هستند. حافظه بازار طلا ، در این زمینه ، ملیله ای است که از اقدامات و واکنش های قیمت گذشته بافته شده است. جنبش صعودی اخیر ، با مخالفت با انتظار یک شکست تأیید شده یا یک جعلی برجسته ، با قدرت و تمایل اساسی بازار برای تقلید از مقاومت تاریخی صحبت می کند. در این مثال ، علیرغم عدم وجود سیگنال قطعی ، قیمت طلا به سمت بالا افزایش یافته است ، همانطور که توسط متخصصان بازار فصلی پیش بینی شده است. در سایه "شکاف CME" ، ما یک خلاء قیمت را مشاهده می کنیم که می تواند به عنوان یک کاتالیزور بالقوه برای حرکات قیمت آینده باشد. این شکاف منطقه ای از عملکرد قیمت پر نشده را نشان می دهد ، که اغلب منجر به یک اثر مغناطیسی می شود که قیمت ها را برای پر کردن خلاء به عقب می کشد. این پدیده ، همراه با آزمون مجدد تعادل که به عنوان نقطه (الف) در نمودار مشخص شده است ، نشان می دهد که بازار در قسمت تعادل قرار دارد و به دنبال وضوح است. این رفتار بازار انفرادی نیست اما بخشی از روایت گسترده تر است که در آن می توان مداحان اصول روش Wyckoff را شنید. مراحل تجمع و توزیع ، تجزیه و تحلیل انتقادی عرضه و تقاضا و چرخه حرکات بازار به همان اندازه که به هر دارایی مالی مربوط می شود ، مربوط به بازار طلا است. همانطور که ما به توپ کریستالی نمودار نگاه می کنیم ، به نظر می رسد که بازار طلا در حال نوشتن داستان خود در مورد بازیابی و صعود است. مسیر صعودی اخیر ، که توسط برکنار سنتی تأیید نشده است ، نشانگر بازاری است که مسیر خود را از طریق ضخامت متراکم از تأثیرات اقتصادی و ژئوپلیتیکی حکاکی می کند. برای حرکت در این سفر طلایی ، معامله گران باید خود را با هوشیاری و درک عمیق از روانشناسی بازار مسلح کنند. حافظه تاریخی طلا به عنوان یک راهنما ، قطب نما انواع و اقسام ، سرمایه گذار حیرت انگیز را از طریق هزارتوی حرکات بازار به سمت سودآوری بالقوه هدایت می کند. روایت طلا به دور از خطی است. این یک saga است که توسط پیچ و تاب ها و چرخش ها ، جعلی ها و تنظیم مجدد ها سوراخ شده است. همانطور که ما در آخرین فصل آن شاهد هستیم ، زمزمه های بازار را نشان می دهد
SmartMoneyDayTrading
The Wyckoff Method, developed in the early 20th century by Richard Demille Wyckoff (1873–1934), a pioneering figure in technical analysis, which is still widely used and resonates within markets today. This comprehensive approach to trading is based on the relationship between supply and demand. Wyckoff's interest in the stock market materialized at the age of only 15 when he became a stock runner, thriving in the fast-paced, exuberant environment of the trading floor he came to love. Over the years, Wyckoff had the opportunity to observe the market and strategically study the strategies of the most successful traders of his time, notably Jesse Livermore and James R. Keene. With the finest attention to detail, these methodical extensive observations led Wyckoff to conclude that markets, no matter how old or liquid, are primarily governed by the laws of supply and demand. It was, in fact, large institutions and the monetary systems that underscored them that often influenced the markets. Believing that retail traders could identify the direction of market trends also, Wyckoff then set out on his next quest of understanding the market operations of these 'Composite Operators', a term he forged to describe the big players. Wyckoff believed that market behaviour could be predicted with a reasonable degree of accuracy by recognizing regular patterns. His method focuses on identifying the intentions of large institutional players, or "SmartMoney," and traded in harmony with them rather than the varied and numerous market participants. In 1907, Wyckoff founded "The Magazine of Wall Street," which gave him access to insights from many of the greatest traders of his day and further enriched his understanding of market dynamics. He also established a brokerage firm and later an educational institution, the Stock Market Institute, to teach his methods. There are 5 Stages or Steps that complete the Wyckoff Method: The Three Fundamental Laws. Market Cycles. Identification of Phases. Wykoff's Price Volume Analysis. Trading Ranges. 1. The Three Fundamental Laws: A) The Law of Supply and Demand governs price direction: Excess demand over supply propels prices upwards, whereas excess supply over demand drives prices downwards. B) The Law of Cause and Effect: Central to forecasting the potential range of price movements, the 'cause' is quantified by the horizontal point count within a trading range. The 'effect' is the extent of the price movement aligned with the period of either accumulation or distribution. C) The Law of Effort vs Result: A comparative analysis between the volume (effort) and the resulting price movement (result). This law declares that volume should confirm the price trend. Discrepancies between effort and result often signify a forthcoming shift in trend. 2. Market Cycles: The Wyckoff Method encapsulates the market's rhythm in a cyclical model. The model consists of four sequential stages: Accumulation, Markup, Distribution, and Markdown. A)- Accumulation: This stage is characterized by significant buying from large operators, who absorb available supply in anticipation of an upcoming bull market. B)- Markup: Post-accumulation, the ensuing demand drives the price upward. C)- Distribution: Following a sustained markup, the market witnesses distribution as large operators offload their coins (crypto) to the public, tipping the scales towards an excess supply. D)- Markdown: In this phase, prices weaken as the previously dominant demand is now overwhelmed by supply. 3. Identification of Phases: Wyckoff's method outlines distinct phases within the accumulation and distribution cycles to assist traders in determining the coin's (crypto) accumulation or distribution periods. Accumulation Phases: - PS (Preliminary Support): this is the phase where the selling pressure diminishes. - SC (Selling Climax): this phase is characterized by peak levels of panic selling. ST (Secondary Test): this phase Tests the newfound level of demand. SOS (Sign of Strength): Indicates a potent upward movement, suggesting the potential for higher prices. Distribution Phases: PL (Preliminary Supply): this phase is Where the initial signs of declining buying pressure emerge. BC (Buying Climax): this phase Represents the pinnacle of buying enthusiasm. AR (Automatic Reaction): this phase Represents The ensuing price decline post-buying exhaustion. ST (Secondary Test): this phase Assesses the established supply level. UT (Upthrust): This phase Characterizes a sign of market weakness, a potentially telltale sign of a forthcoming decrease in pricing. 4. Wyckoff's Price Volume Analysis: An essential tool in the Wyckoff Method is price and volume analysis. Wyckoff analysts look for price-volume convergence and divergence to understand the strength of a trend. They also look for specific patterns such as 'Springs' and 'Upthrusts', which are considered traps that go against the prevailing trend and indicate a potential reversal. 5. Trading Ranges: Wyckoff places considerable emphasis on trading ranges, perceiving them as critical phases of equilibrium where supply and demand find a balance. Breakouts from these ranges signal the onset of a new trend, whereas breakdowns typically indicate reversals. SmartMoneyDayTrading©️
SmartMoneyDayTrading
تجارت مثلث متقارن با سیستم چراغ راهنمایی: شناسایی ، تجارت جعلی و اطمینان از یک انتظار مثبت سودآور مثبت مثلث متقارن را شناسایی کنید: الگوی مثلث متقارن را روی نمودار قرار دهید ، که با همگرا خطوط با تقارن شکل می گیرد. اجرای TLS: چراغ سبز (عمل): ادغام در بالا یا پایین و خارج از مثلث را مشاهده کنید. چراغ عنبر (ادغام): از آنجا که قیمت به سطح کلیدی و اوج نزدیک می شود ، سیگنالینگ نوسانات بالقوه و مناطق آزمایش مجدد آینده است. Red نور (عمل): فراتر از مثلث های مرز/خطی فوقانی یا پایین ، برای حرکت قابل توجه قیمت در جهت دیگر یا ادامه قوی روند قبلی آماده شوید. شناسایی جعلی: به دنبال حرکات ناگهانی و تیز قیمت باشید که به نظر می رسد روند را می شکند اما از طریق افزایش حجم یا سیگنال های فنی قوی تأیید نمی کنند. تجارت جعلی: در مرحله نور کهربا محتاط باشید. اگر به یک جعل بالقوه مشکوک است ، تا زمانی که تأیید مشخص شود ، از ورود به معاملات خودداری کنید. ایجاد انتظار مثبت: از TLS برای فیلتر کردن سیگنال های کاذب و بهبود دقت تجارت استفاده کنید. روی تنظیمات با قابلیت بالا تمرکز کنید و از یک نسبت مطلوب ریسک-ریسک برای هر تجارت استفاده کنید. بهبودی از تله: اگر گرفتار جعلی هستید ، نظریه "آزمون و شکستن" را پیاده سازی کنید. منتظر یک آزمایش مجدد از نقطه اصلی شکست/شکست باشید. اگر قیمت نتوانسته است از این نقطه عبور کند ، آن را یک حرکت نادرست در نظر بگیرید و تجارت خود را بر این اساس تنظیم کنید. رویکرد بازیابی مثبت: به جای پذیرش ضرر ، استراتژی خود را بر اساس سیگنال های TLS و تئوری مجدد تطبیق دهید. از این به عنوان فرصتی برای یادگیری و اصلاح رویکرد خود برای معاملات آینده استفاده کنید. نظارت و تنظیم: به طور مداوم بر تجارت نظارت می کند ، سطح متوقف کردن و از دست دادن را بر اساس سیگنال های TLS و مشاهدات مجدد تنظیم می کند. این مدیریت فعال به به حداکثر رساندن سود و به حداقل رساندن ضررها کمک می کند. به یاد داشته باشید که قبل از تصمیم گیری در مورد تجارت ، استراتژی های مدیریت ریسک را اعمال کرده و تجزیه و تحلیل کامل انجام دهید. سازگار باشید و از TLS استفاده کنید تا قابلیت اطمینان استراتژی تجارت خود را افزایش دهید و مشکلات احتمالی را به فرصت های یادگیری تبدیل کنید. پیمایش برک آستانه و آزمایش مجدد: استراتژی هایی با سیستم چراغ راهنمایی (TLS) استراتژی های تجاری مؤثر را برای شکستن و آزمایش مجدد کشف کنید ، با وضوح سیستم چراغ راهنمایی (TLS) تقویت شده است. شکستگی و آزمایش مجدد: پویایی شکستن و آزمایشات بعدی را درک کنید ، برای به دست آوردن حرکت در بازار بسیار مهم است. TLS سیگنال روشنی را برای نقاط ورودی مطلوب فراهم می کند. شناسایی جعلی: با ارزیابی حجم ، احساسات بازار و شاخص های متعدد از طریق TLS ، مهارت های خود را در شناخت شکستن کاذب تیز کنید. استراتژی تجارت: منتظر برکهای تأیید شده باشید ، از آزمایش مجدد به عنوان نقاط ورود استفاده کنید و با اعتماد به نفس و مدیریت ریسک ، هدایت شده توسط سیگنال های TLS. TLS در عمل: TLS را در تجزیه و تحلیل خود ادغام کنید و دقت در تصمیم گیری را در هنگام استراحت و آزمایش مجدد افزایش دهید. تسلط بر بازپرداخت و تجارت مجدد شامل تجزیه و تحلیل فنی ، آگاهی از بازار و استفاده استراتژیک از TLS است که منجر به تصمیم گیری با اعتماد به نفس و دقیق می شود.
SmartMoneyDayTrading
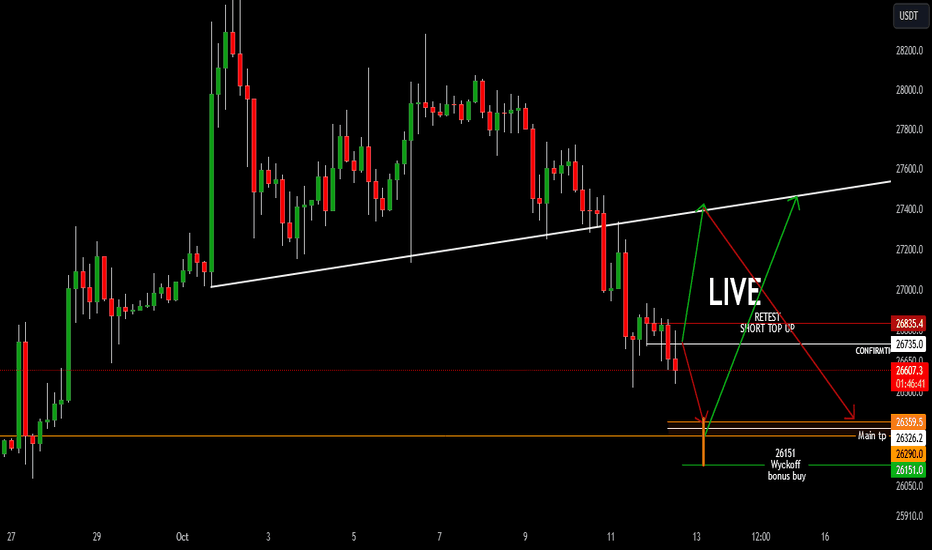
با عرض پوزش بسیار شلوغ ، امروز دست ها پر از .. اینجا تنظیمات من در HTF اکنون همه ما برای تله بعدی خود تنظیم شده ایم. اگر کسی دنبال کند ، TA آنهاست. اکنون فقط بعد از بسته شدن طولانی ، سفارشاتی که منتظر پر کردن طولانی هستند ... به زودی با بروزرسانی کامل بود
SmartMoneyDayTrading
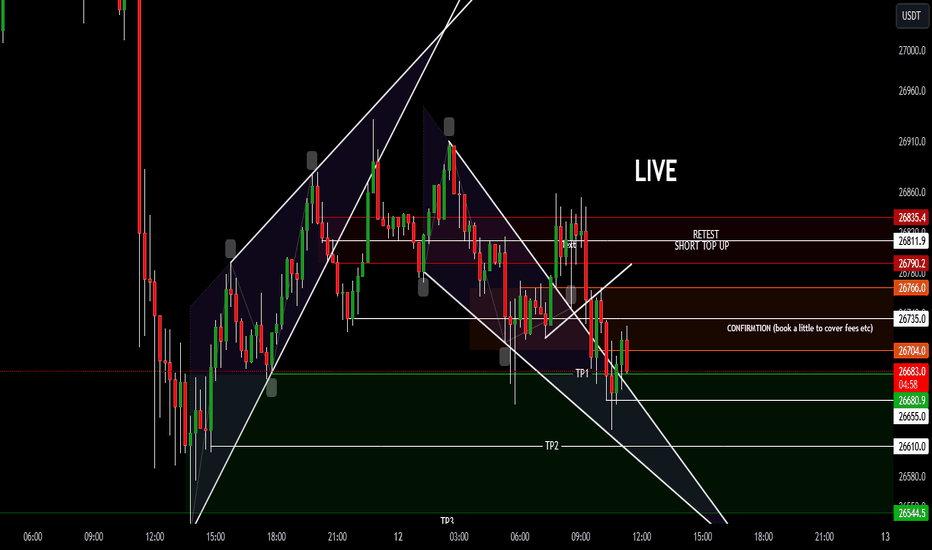
به زودی فقط یک ایده کوچک را برای امروز به روز می کند
سلب مسئولیت
هر محتوا و مطالب مندرج در سایت و کانالهای رسمی ارتباطی سهمتو، جمعبندی نظرات و تحلیلهای شخصی و غیر تعهد آور بوده و هیچگونه توصیهای مبنی بر خرید، فروش، ورود و یا خروج از بازار بورس و ارز دیجیتال نمی باشد. همچنین کلیه اخبار و تحلیلهای مندرج در سایت و کانالها، صرفا بازنشر اطلاعات از منابع رسمی و غیر رسمی داخلی و خارجی است و بدیهی است استفاده کنندگان محتوای مذکور، مسئول پیگیری و حصول اطمینان از اصالت و درستی مطالب هستند. از این رو ضمن سلب مسئولیت اعلام میدارد مسئولیت هرنوع تصمیم گیری و اقدام و سود و زیان احتمالی در بازار سرمایه و ارز دیجیتال، با شخص معامله گر است.