تحلیل تکنیکال SmartMoneyDayTrading درباره نماد ETH : توصیه به خرید (۱۴۰۴/۴/۱)

SmartMoneyDayTrading
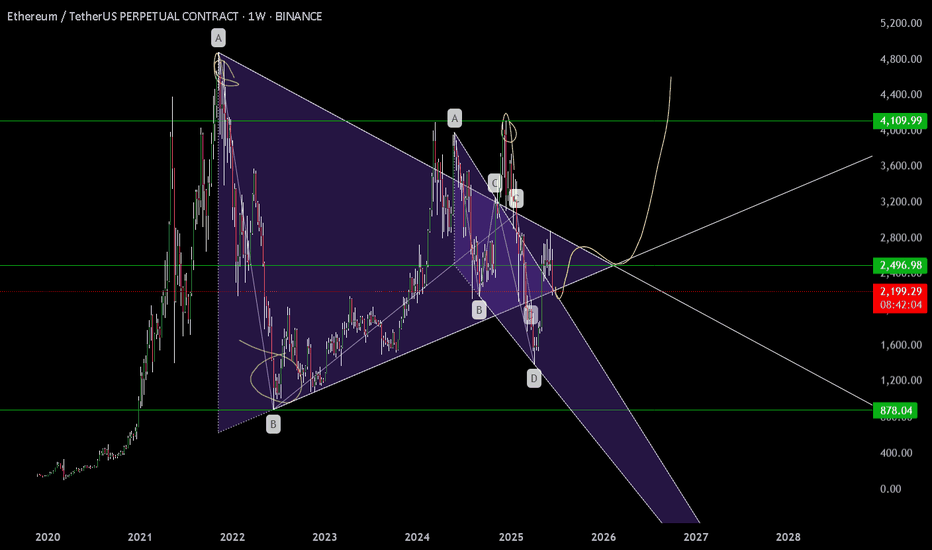
This is my full Ethereum weekly chart analysis — not just what I think might happen, but a walk-through of everything I’ve mapped and labelled, based on how price has behaved since the 2021 top. Every structure you see here is there for a reason — from the symmetrical triangle and wedge, to the Wyckoff schematics, Elliott wave flow, Spring, and more. What we’re seeing now, in my opinion, is the end of a three-year macro compression. The move that follows could define the rest of this cycle. Let me take you through it. After the all-time high in late 2021, Ethereum entered a structured, controlled decline. Not a crash — but a step-by-step transition through market phases. Price dropped and bottomed into a clear accumulation phase — that’s the first box on this chart, labelled as “Accumulation (cause)”. This is where smart money started taking positions, confirmed by the Spring down to 0 and the base of the move at point 2. From there, price consolidated, gained strength, and then jumped the creek — a clear breakout above the accumulation range, which gave us the confirmation for markup. The markup phase took us from that Spring up into a five-wave impulsive move, peaking around the distribution zone. You can see it clearly — labelled Distribution, and boxed off between points A, B, C and the final wave 5. This rally failed to make new all-time highs, stalled, and was rejected cleanly. From there, we rolled over and started losing structure — and this is where it gets important. Right after distribution, we got a breakdown I’ve labelled “Break The Ice”. This wasn’t just another dip. It was the moment we lost all structure from the markup — the line that had held the previous lows snapped, and volume stepped in. This is often the first real signal that we’ve entered the markdown phase. From a Wyckoff perspective, this breakdown is what separates Phase D from the start of a new accumulation cycle. It’s aggressive, deliberate, and clears out late longs — and that’s exactly what it did here. Following that breakdown, we formed a new falling wedge — drawn from the top of the markdown all the way to the most recent lows. Price was making lower highs and lower lows, but with less aggression and momentum weakening. This wedge sits inside the larger symmetrical triangle, which has been developing ever since the 2021 top. The apex of this triangle, marked around $2,496, is where I believe everything will come to a head. Break that with conviction — and we could start a whole new macro leg. But before we get there, something happened worth pointing out. That final breakdown inside the wedge? The one that dipped below and quickly reclaimed? That, for me, was the Spring. It’s labelled in yellow as “Spring” under point D. And it matches the Wyckoff schematic almost perfectly. Volume dried up on the move down. RSI and CCI both showed divergence. Then price bounced hard, reclaimed structure, and we’ve held ever since. This doesn’t look like continuation — it looks like a trap. If that Spring holds, then we’re now in the Sign of Strength (SOS) phase. This is the moment where price reclaims its mid-structure levels, consolidates, and prepares for the breakout. We haven’t broken out yet — but the groundwork is in place. My Elliott count also lines up. We had a 5-wave impulse from the Spring to the failed rally, followed by an ABC correction. What we may now be seeing is the completion of another Wave 2, setting up for a possible Wave 3 — the strongest wave of the cycle, if confirmed. Now let’s talk entries. I’ve got my eye on the $2,130–$2,030 region. That’s where I’m placing my DCA bids. It’s the area just above the Spring reclaim zone, where price should react again if we retest. If we lose $1,690, I consider the Spring invalidated and will reassess. That’s my clean risk level. Break and hold above $2,496, and the breakout is confirmed. That level is not just the wedge and triangle resistance — it’s also the psychological midpoint of this whole macro structure. Everything’s mapped. Structure is clean. Volume is drying up. Momentum is shifting. And price is compressing right into the apex. This isn’t a moment to chase. It’s a moment to plan. If we break out, I’m ready to scale in. If we reject, I’ll be watching the DCA zone and the Spring level closely. Either way, I know what I’m looking for — and I know what invalidates the setup. Let’s see what price does next.Following directly on from my previous macro analysis, let's zoom into what's currently happening on the lower timeframe (30-min chart) and see how Ethereum is behaving in real-time, exactly as we anticipated. Previously, I highlighted the critical breakdown below the macro apex around 2,496—what I labelled our "Break the Ice" moment. As expected, price steadily drifted downward into my pre-defined DCA range between 2,130 and 2,100, aligning perfectly with the lower diagonal support of our larger wedge formation. That move formed a textbook Wyckoff Spring: price gently tapped the lows with diminishing volume, while both RSI and CCI clearly displayed bullish divergence—confirming that selling pressure had effectively dried up, and smart money was quietly accumulating positions. Now, let's closely examine the current 30-minute structure shown clearly in today's updated chart: Since confirming our spring at the wedge’s lower boundary, Ethereum swiftly reversed upward and is now in the process of establishing a shorter-term ascending channel—precisely as we would expect following a successful spring event. Notice how price action has developed a clean harmonic structure within this ascending channel. Initially, we saw a smaller bearish wedge formation appear, labelled on the chart as "Failed bear wedge + Bart formation." Importantly, this bearish pattern failed and resolved upwards, indicating short-term bear exhaustion and providing additional confirmation for our bullish perspective. At this moment, Ethereum is consolidating tightly between well-defined supply and demand zones, currently capped just beneath resistance around the 2,430–2,448 area (labelled clearly as "Supply"). Just above this supply zone, we encounter a critical distribution zone extending from approximately 2,471 up to 2,534, which represents our next major challenge. For bullish momentum to persist, ETH needs to firmly hold above the immediate demand zone between roughly 2,349 and 2,374. From there, we want to see Ethereum decisively reclaim and hold above the immediate supply resistance at 2,448. Successfully reclaiming this key area with conviction and increasing volume would negate the bearish "Bart Simpson" consolidation scenario currently forming. Speaking of which—it's important to note that the current consolidation has started shaping into what traders often describe as a "Bart Simpson" pattern: a quick and impulsive upward move, followed by a flat-top consolidation, which sometimes results in an equally rapid reversal downward. This is definitely something we must watch closely. Therefore, for bullish confirmation, ETH must first defend and hold above the immediate demand zone (2,349–2,374), then convincingly break above supply at 2,448. Clearing that resistance would invalidate the potential Bart pattern, instead paving the way towards our distribution area near 2,534. Securing this higher level with robust volume would align beautifully with our broader macro roadmap, opening up a path for Ethereum to revisit and retest the critical apex level at 2,496. On the flip side, should Ethereum fail to hold this consolidation and break downward, validating the bearish Bart Simpson scenario, we might see price retesting lower demand levels—initially around 2,312–2,269. Should price pressure intensify further, a deeper retest towards our previous spring support at 2,226–2,187 could follow. In any case, the original DCA zone (2,130–2,100) remains my primary area of interest, with the macro invalidation clearly defined at the critical support around 1,690. For now, remain closely focused on these immediate short-term levels—particularly the supply resistance at 2,448 and the crucial distribution zone near 2,534—as Ethereum navigates this pivotal range. Despite the current consolidation and Bart formation, the larger picture remains fully intact, and our broader roadmap continues to unfold as expected. Stay patient, remain prepared, and as always, stay tuned.15min ChartWyckoff Logic: Low Volume / Failed Rally Zooming into the lower timeframe, ETH price action now displays the hallmark characteristics of a Low Volume Rally or Failed Rally within the distribution phase. After reaching up into the critical "Distribution" resistance area (around 2,471–2,534), Ethereum began consolidating sideways within a narrow trading range. This tight, flat consolidation mirrors what traders often recognize as a "Bart Simpson" pattern—characterized by rapid upward movement, low-volume sideways action, and potentially quick downward reversals. In simple terms, what we're seeing here is indecision and exhaustion—bullish strength is waning precisely where sellers historically step back in. Short-term Elliott Wave Structure Looking even closer (on the15-minute chart), price structure clearly outlines an ongoing Elliott corrective sequence. After the sharp impulsive drop from recent highs (Wave 1), ETH retraced upwards (Wave 2), rejected sharply, and has now likely completed or is completing Wave 4—right around the crucial Fibonacci resistance zone between 2,446–2,455. This current wave formation further strengthens the bearish bias, suggesting a final Wave 5 downwards to potentially test lower supports near 2,415–2,400. However, caution is needed: if ETH can reclaim and hold above Wave 2's high (approximately 2,458), this would invalidate the bearish Elliott scenario, suggesting bulls are reclaiming short-term control and targeting a push towards 2,496 once more. Key Levels to Watch Bullish scenario (Distribution invalidated): Break and sustain above immediate supply (2,448), and then distribution zone (2,471–2,534) with clear volume. Bearish scenario (Distribution confirmed): A decisive breakdown below immediate demand (2,412–2,374), followed by lower demand support around 2,312–2,269. Confirmation of Wave 5 downwards towards 2,400–2,415 support. Technical Indicators & Momentum RSI and CCI: Initially displayed bullish divergences during the spring, but short-term RSI is now flattening near neutral levels (~60), indicating weakening bullish momentum. Volume: Currently low—typical of consolidation phases—suggesting a lack of conviction from buyers at current prices. These indicators collectively reinforce our scenario of potential distribution and subsequent markdown unless significant bullish strength returns soon. Market Psychology & Logic Psychologically speaking, the current scenario is classic Wyckoff: the market has attracted late bulls who entered near the recent highs. Now price stalls, causing hesitation, doubt, and potential capitulation if selling picks up. This psychological dynamic could soon create a domino effect—accelerating price downward if support levels fail. Trading Strategy & Risk Management My plan remains disciplined: Bullish Invalidation: A clean reclaim above 2,458 would pause bearish setups temporarily, targeting upside resistance at 2,496. Bearish Confirmation: Look for clear rejections at current levels (2,446–2,455), targeting immediate lower support around 2,400–2,415, and deeper targets at 2,312–2,269 if bearish momentum accelerates. Keep stops tight above recent highs to manage risk effectively, ensuring that any invalidation of our bearish thesis results in minimal loss and quick reassessment. ................................................................................................................. Final Thoughts & Next Steps Ethereum stands right at a pivotal juncture: distribution or reaccumulation. The market structure we've carefully mapped out gives us clear boundaries and actionable levels. Now we let price action speak, confirm our bias, and react calmly and professionally. Stay vigilant, patient, and proactive. Updates will follow as we see decisive moves. Stay safe, and trade wisely.
