
SeoVereign
@t_SeoVereign
تریدر چه نمادی را توصیه به خرید کرده؟
سابقه خرید
تخمین بازدهی ماه به ماه تریدر
پیام های تریدر
فیلتر
نوع پیام
[SeoVereign] BITCOIN BULLISH Outlook – December 09, 2025
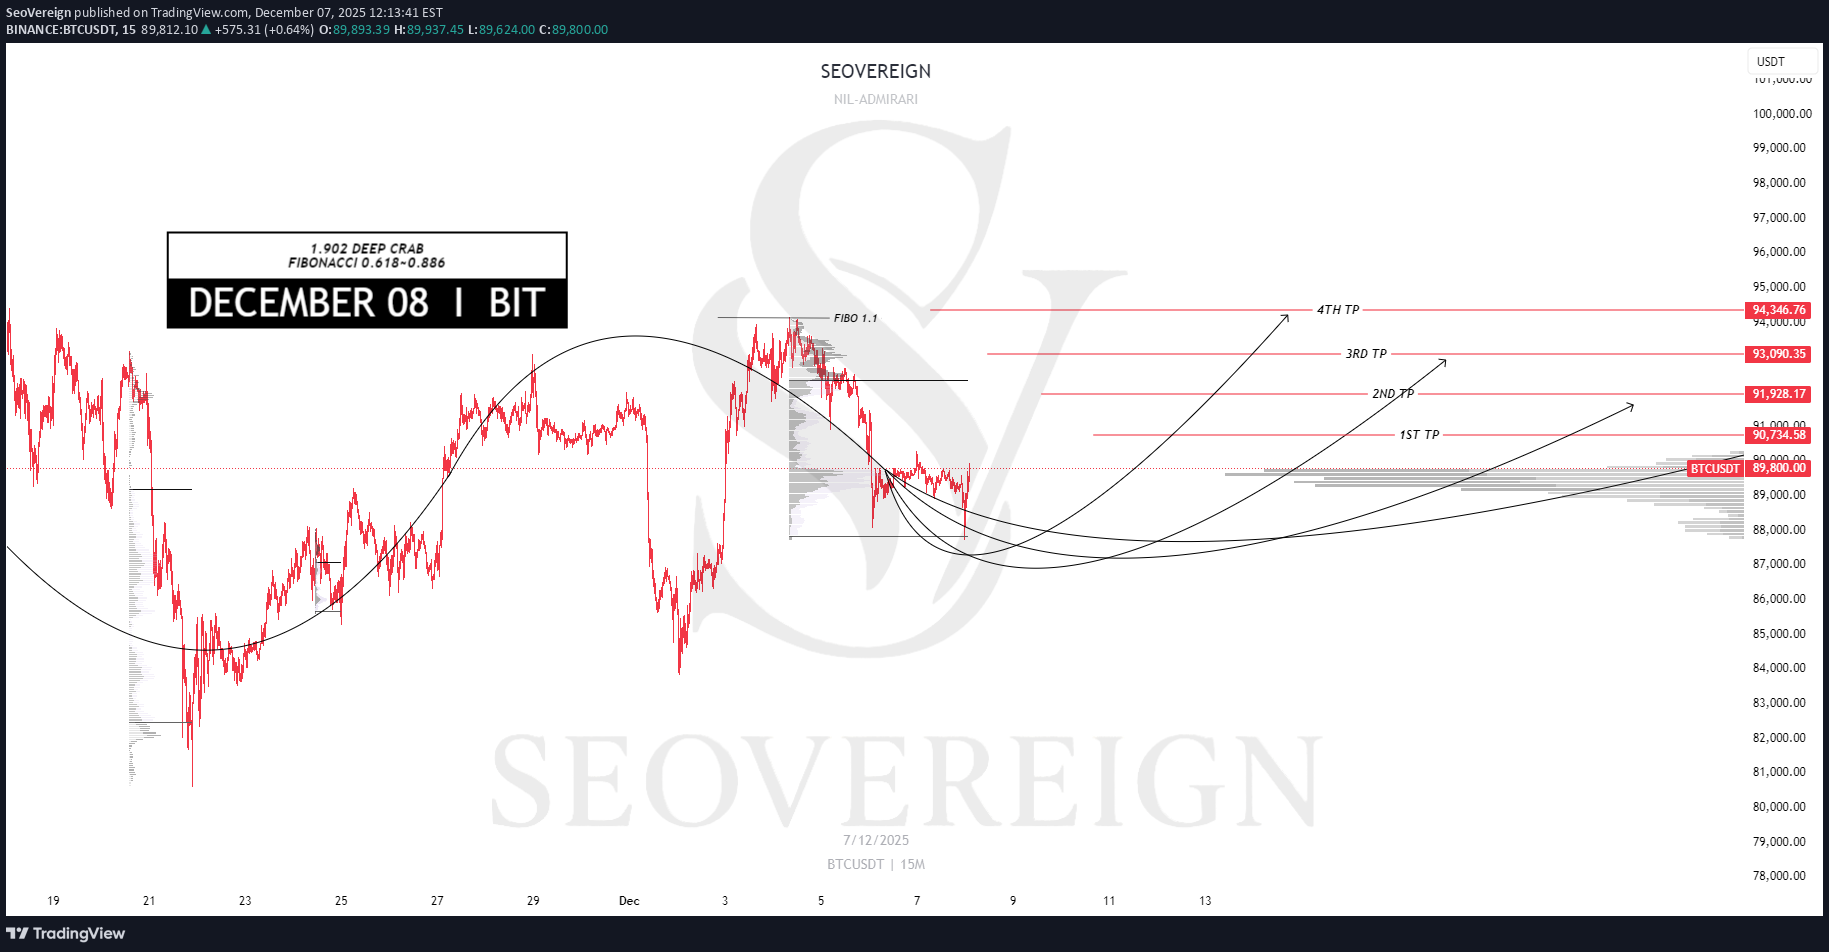
از 9 دسامبر، من می سناریوی صعودی بیت کوین را به اشتراک بگذارم. در زیر عوامل اصلی حمایت از بازگشت فعلی آورده شده است. - مبانی فنی دقیق 1) رسیدن به منطقه تکمیل الگوی CRAB 1.902 DEEP در الگوی خرچنگ Deep، سطوح 1.618 یا 1.902 مناطق معکوس در نظر گرفته می شوند. و هنگامی که پسوند BC و نسبت XA به طور همزمان همگرا شوند، یک ساختار اصلاحی قوی تشکیل می شود. این با شرایط الگوی معمولی که در آن بازار تلاش میکند تا بازگشت معنیداری داشته باشد، هماهنگ است. 2) همپوشانی مناطق اصلاحی کلید فیبوناچی 0.618 ~ 0.886 سطوح 0.618 ~ 0.886، که به عنوان مبنایی برای روند میان مدت عمل می کند، در حال حاضر نزدیک به قیمت همپوشانی دارند. تشکیل یک منطقه دفاعی قوی برای خرید. این ناحیه در گذشته چندین بار به عنوان محوری برای معکوسهای جهت عمل کرده است. و اکنون دارای زمینه احتمالی کافی برای تکرار واکنش مشابه است. 3) تشخیص سیگنال های اولیه تغییر ساختار بازار حتی با ادامه کاهش قیمت، حرکت نزولی در حال کاهش است. و یک الگوی جذب کلاسیک که در شرایط فروش بیش از حد دیده می شود در ساختار حجمی ظاهر می شود. این هنوز یک سیگنال معکوس تایید شده نیست، اما می تواند به عنوان آماده شدن اولیه movement برای یک بازگشت تفسیر شود. - استراتژی و هدف بر اساس این عوامل، من میانگین منطقه هدف برای این بازگشت را 92450 USDT تعیین کردهام. اگر movement رو به بالا آشکار شود، مجدداً ارزیابی میکنم که آیا به نگه داشتن در آن سطح ادامه دهم یا خیر. من قصد دارم به تدریج موقعیت های لانگ را بر اساس شرایط فنی که در بالا توضیح داده شد افزایش دهم. به روز رسانی های بیشتر برای مدیریت موقعیت بسته به بازار movement و تغییرات شاخص دنبال شد. ممنون که خواندید.
پیشبینی بیت کوین: چرا سقوط ادامه دارد؟ (تحلیل 27 نوامبر)
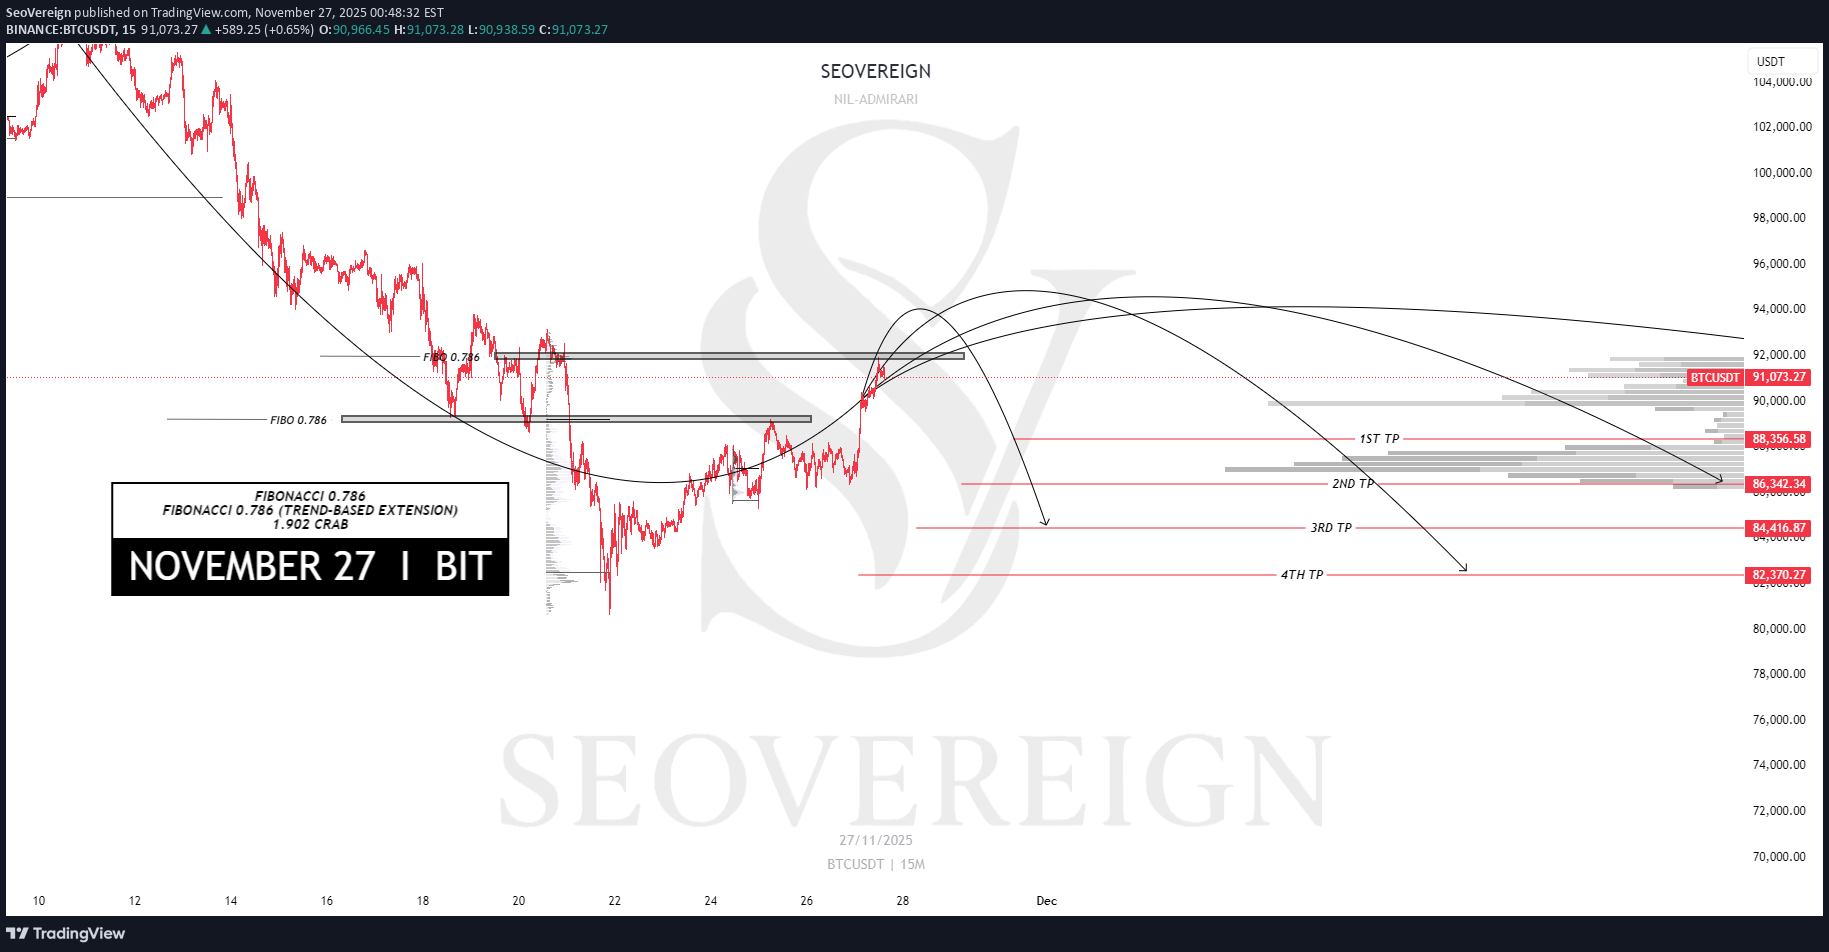
در حال به اشتراک گذاشتن یک دیدگاه نزولی برای Bitcoin تا تاریخ ۲۷ نوامبر هستم. Bitcoin اخیراً یک کاهش شدید را تجربه کرده است، و غیرقابل انکار است که این امر به تدریج احتمال بازگشت (صعود موقت) را افزایش داده است. با این حال، در بررسی دقیق ساختار نمودار کنونی، شرایط کلیدی که از نظر من تأییدکننده یک برگشت صعودی هستند، هنوز محقق نشدهاند. در حالی که انتظار دارم سیگنالهای برگشت soon ظاهر شوند و نمودار را از نزدیک زیر نظر داشتهام، متوجه شدهام که در ناحیه فعلی، فشار نزولی کوتاهمدت در واقع در حال برجستهتر شدن است. بنابراین، یک چشمانداز نزولی را به اشتراک میگذارم. مبنای این دیدگاه به شرح زیر است. اول، در ناحیه اصلاحی موج اخیر، سطح فیبوناچی ۰.۷۸۶ به عنوان یک مقاومت قوی عمل میکند. این نسبت معمولاً ناحیهای نزدیک به سقفهای محلی است که در آن فشار فروش دوباره تقویت میشود، و حتی اگر برگشتی رخ دهد، احتمالاً بیشتر یک اصلاح بود تا تغییر کامل روند. علاوه بر این، سطح ۰.۷۸۶ گسترش مبتنی بر روند (Trend-Based Extension)، که بر اساس جهت موج اندازهگیری شده، نیز در حال تشکیل مقاومت است. این نشان میدهد که صرفاً یک اصلاح ساده مطرح نیست، بلکه فشار فروش ساختاری در داخل گسترش موج در حال انباشت است. این امر نشان میدهد که قیمت کنونی همچنان در موقعیت ادامه یک موج نزولی قرار دارد. در نهایت، هنگام ترکیب نسبتهای کل موج، یک الگوی کرب (Crab pattern) که در ناحیه ۱.۹۰۲ تکمیل میشود، به طور معتبری در حال شکلگیری است. ناحیه ۱.۹۰۲ الگوی کرب به عنوان ناحیهای با احتمال بالای برگشت در سقف دستهبندی میشود، و زمانی که الگوها و نسبتهای متعدد در یک نقطه همگرا میشوند، اعتبار برگشت حتی بیشتر افزایش مییابد. با توجه به اینکه این عوامل به طور همزمان در حال عمل هستند، ناحیه فعلی را ناحیهای ارزیابی میکنم که در آن نزول کوتاهمدت محتملتر از یک برگشت صعودی فوری است. بر این اساس، من میانگین هدف را روی ۸۵,۴۰۰ تتر (USDT) تعیین کردهام، و انتظار دارم پس از شکلگیری move، در مورد نگهداری یا عدم نگهداری در آن سطح تصمیمگیری کنم.
پیشبینی سقوط بیت کوین: تحلیل تکنیکال 3 نوامبر و هدف 100,600 تتر!
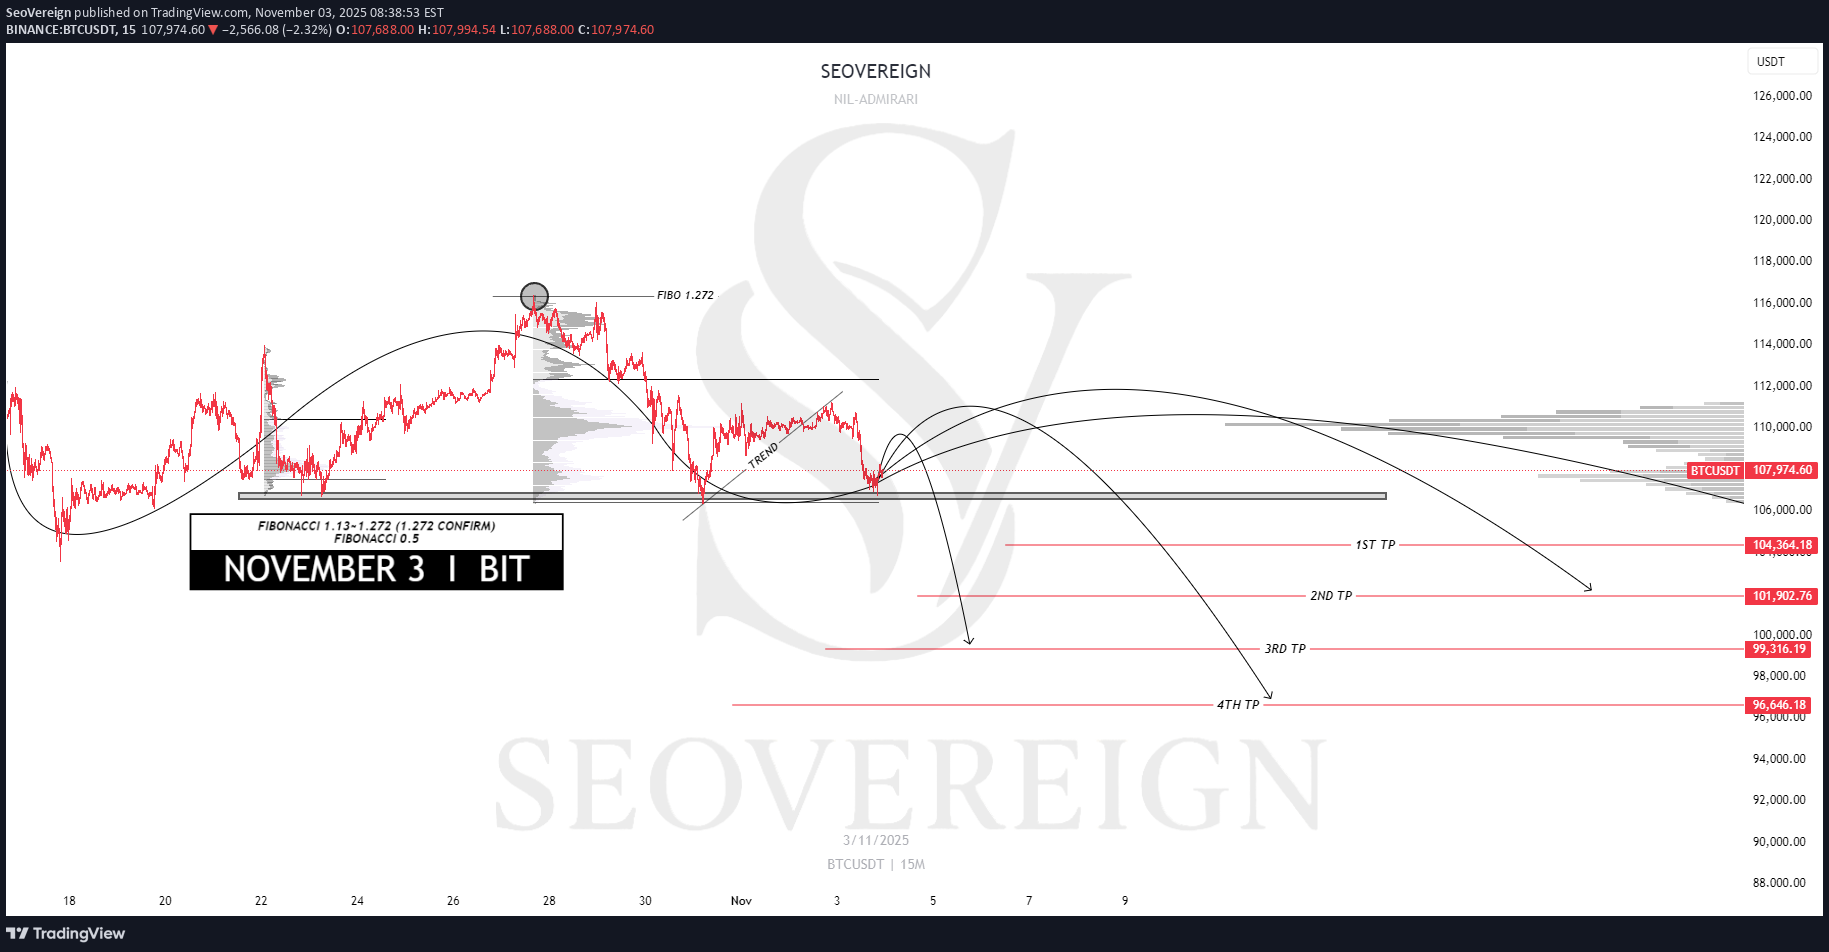
مایلم ایده [0] خود را در تاریخ ۳ نوامبر به اشتراک بگذارم. این ایده، ادامه ایده ۲۷ اکتبر است. موقعیتهای شورت (فروش) که در تاریخ ۲۷م باز شدند، در ارتباط با این ایده با سود بسته شد و همزمان قصد دارم موقعیتهای جدیدی نیز اضافه کنم. این ایده بر اساس دیدگاه نزولی (شورت) بنا شده است و من بر مبنای تحلیل فنی (تکنیکال)، احتمال بالایی برای یک اصلاح نزولی میبینم. **مبنای اول — سطح اصلاحی ۱.۲۷۲ فیبوناچی (FIBONACCI 1.272 Retracement)** در حال حاضر، [1] نسبت به حرکت نزولی [2] قبلی، در ناحیه ریتریسمنت ۱.۲۷۲ قرار گرفته است. این ناحیه عموماً به عنوان منطقه تکمیل جهش (Rebound) شناخته میشود؛ جایی که فشار خرید رو به ضعف میرود و فشار فروش شروع به نمایان شدن میکند. **مبنای دوم — شکست خط روند (Trendline Breakdown)** [3] به وضوح زیر خط روند صعودی کوتاهمدت شکسته شده است. این نشاندهنده پایان حرکت صعودی [4] کوتاهمدت بوده و پتانسیل معکوس شدن روند به سمت نزول را پیشنهاد میکند. بر این اساس، میانگین قیمت هدف را حدود ۱۰۰,۶۰۰ تتر (USDT) تعیین میکنم. مدیریت موقعیتهای آتی و بهروزرسانیها بسته به تحولات بازار ارائه شد. ممنون از مطالعه شما.
پیشبینی سقوط اتریوم تا ۳۴۰۰ دلار: پایان خوش برای خرسها در نوامبر ۲۰۲۵!
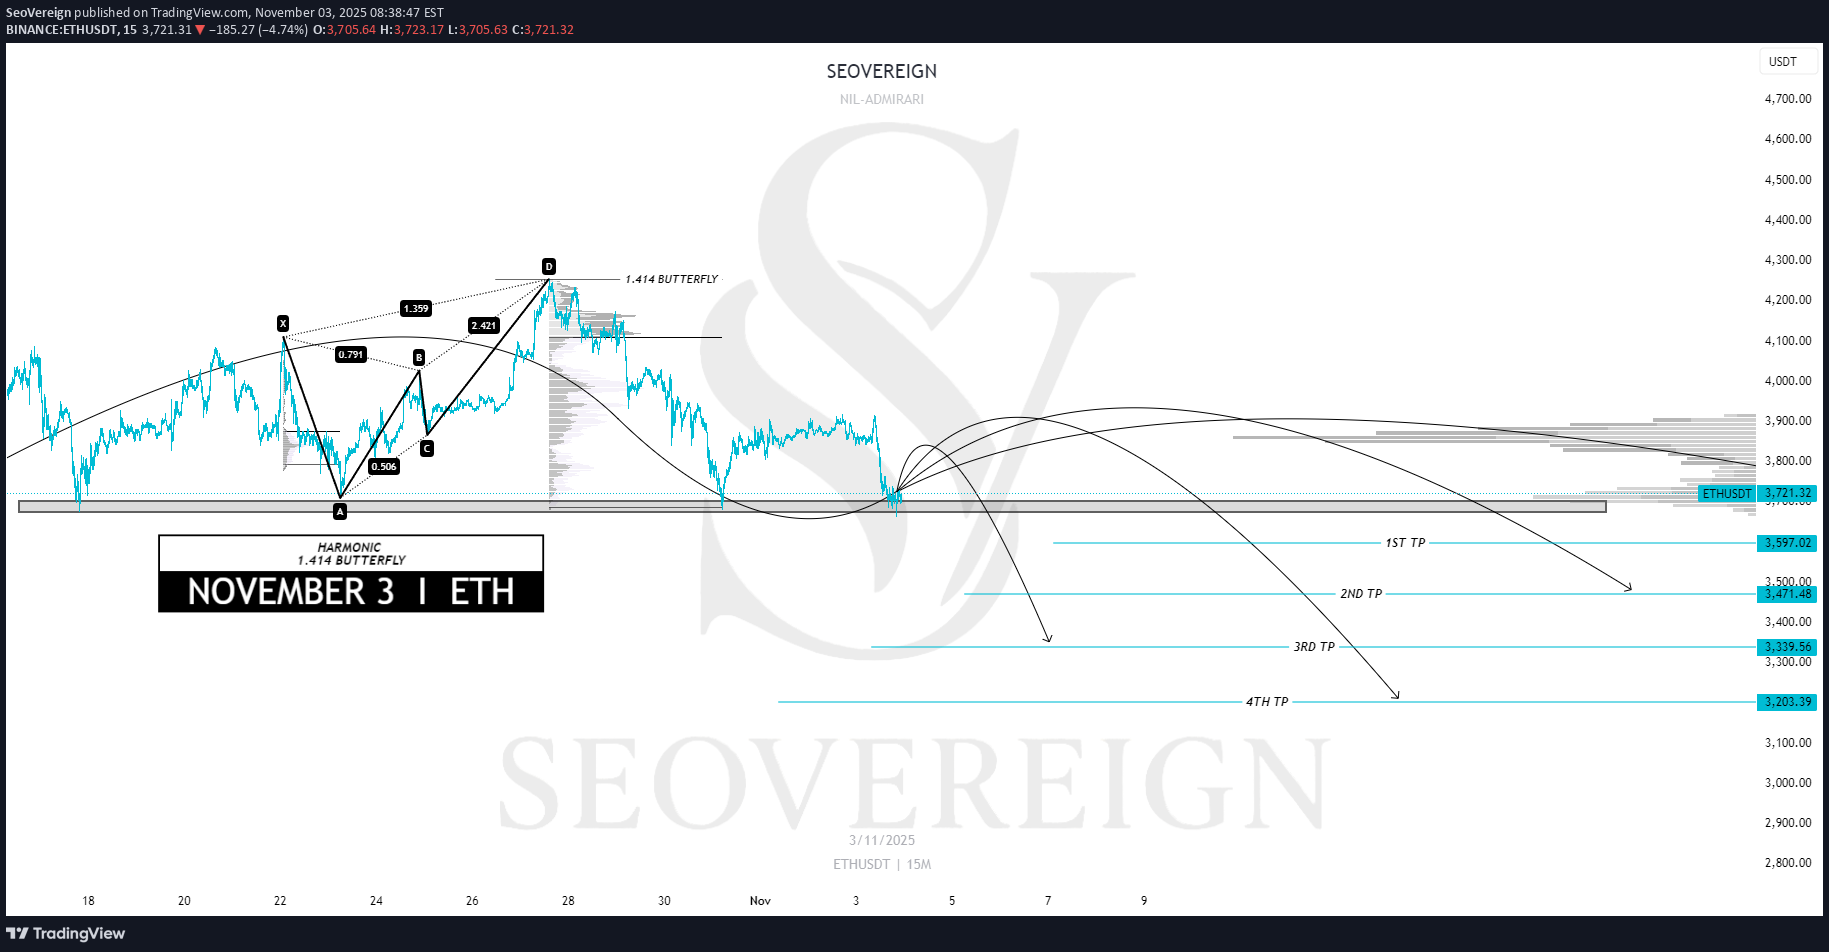
مایلم ایده <۰> خود در تاریخ ۳ نوامبر را به اشتراک بگذارم. این ایده در واقع بسط و ادامه ایده ۲۷ اکتبر است. پوزیشنهای شورت (فروش) که در تاریخ ۲۷ام باز شدند، در ارتباط با این ایده با سود بسته شد، و همزمان قصد دارم پوزیشنهای اضافی دیگری نیز باز کنم. مبنا/اساس — الگوی پروانه هارمونیک ۱.۴۱۴ در حال حاضر، <۱> در حال نزدیک شدن به منطقه تکمیل الگوی پروانه هارمونیک ۱.۴۱۴ است که شخصاً آن را طراحی کردهام. این منطقه از لحاظ ساختاری، یک ناحیه کشش بیش از حد (Overextension) محسوب میشود، که در آن امکان قوی برای بازگشت فنی (Technical Reversal) وجود دارد. بر این اساس، قیمت هدف متوسط را حدود ۳۴۰۰ تتر (USDT) تعیین کردهام. مدیریت بیشتر پوزیشن و بهروزرسانیها بسته به شرایط بازار ارائه شد. از توجه شما سپاسگزارم.
پیشبینی سقوط سولانا (SOL): تحلیل تکنیکال و هدف ۱۷۶ دلاری در نوامبر ۲۰۲۵
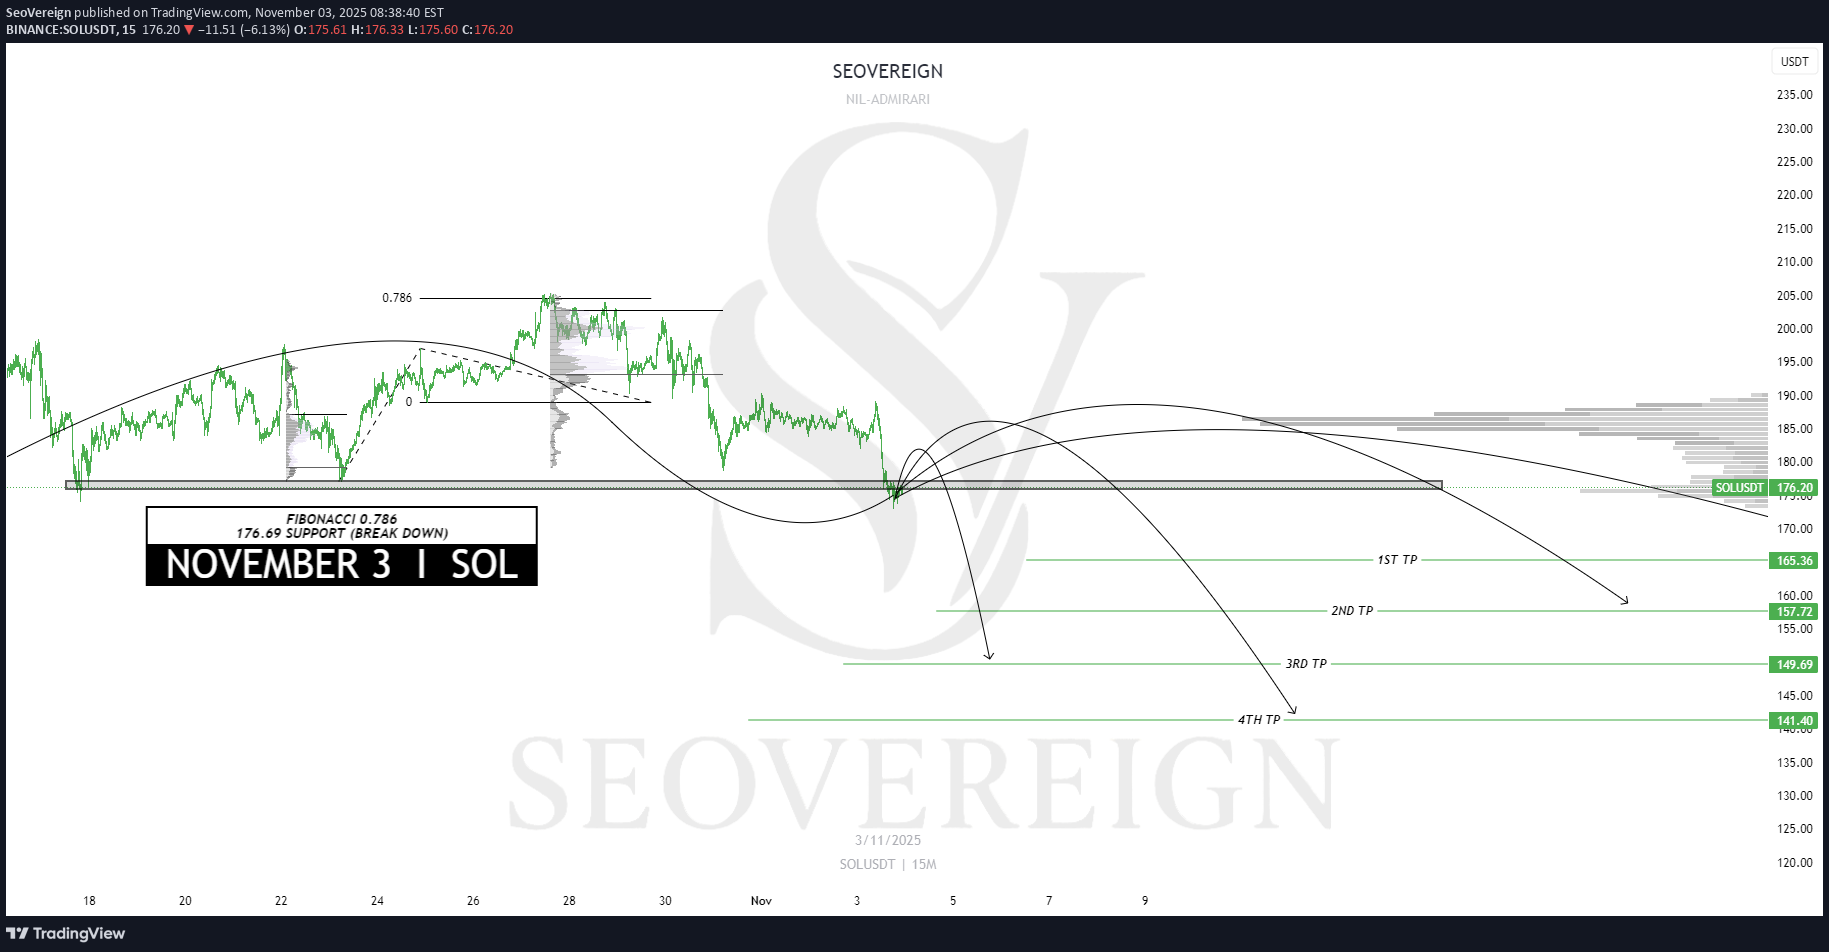
مایلم ایده خود را برای تاریخ ۳ نوامبر به اشتراک بگذارم. این ایده بسط و ادامه ایده ۲۷ اکتبر است. پوزیشنهای شورت (فروش) که در تاریخ ۲۷ اکتبر وارد شده بودند، در ارتباط با این ایده با سود بسته شد و من قصد دارم همزمان پوزیشنهای اضافی جدیدی را نیز اضافه کنم. **مبنای تحلیل:** اصلاح فیبوناچی (FIBONACCI Retracement) در سطح ۰.۷۸۶ و شکست قیمت (Breakdown) در محدوده ۱۷۶ تتر (USDT). در حال حاضر، [دارایی مورد نظر] پس از رسیدن به سطح اصلاحی ۰.۷۸۶ نسبت به موج صعودی قبلی (در حدود ۱۷۶ تتر)، سیگنال شکست واضحی را نشان میدهد. این ناحیه نشاندهنده یک منطقه انتقال رایج است که در آن، مومنتوم صعودی (شتاب حرکت رو به بالا) به پایان میرسد و پتانسیل برای تغییر روند (Trend Reversal) وجود دارد. بر این اساس، من میانگین قیمت هدف را در حدود ۱۵۴ تتر تعیین کردهام. مدیریت بیشتر پوزیشنها و بهروزرسانیهای بعدی بسته به تحولات بازار ارائه شد. با تشکر از مطالعه شما.
پیشبینی سقوط ریپل (XRP): هدف جدید ۱.۲ دلار با تکیه بر تحلیل فیبوناچی
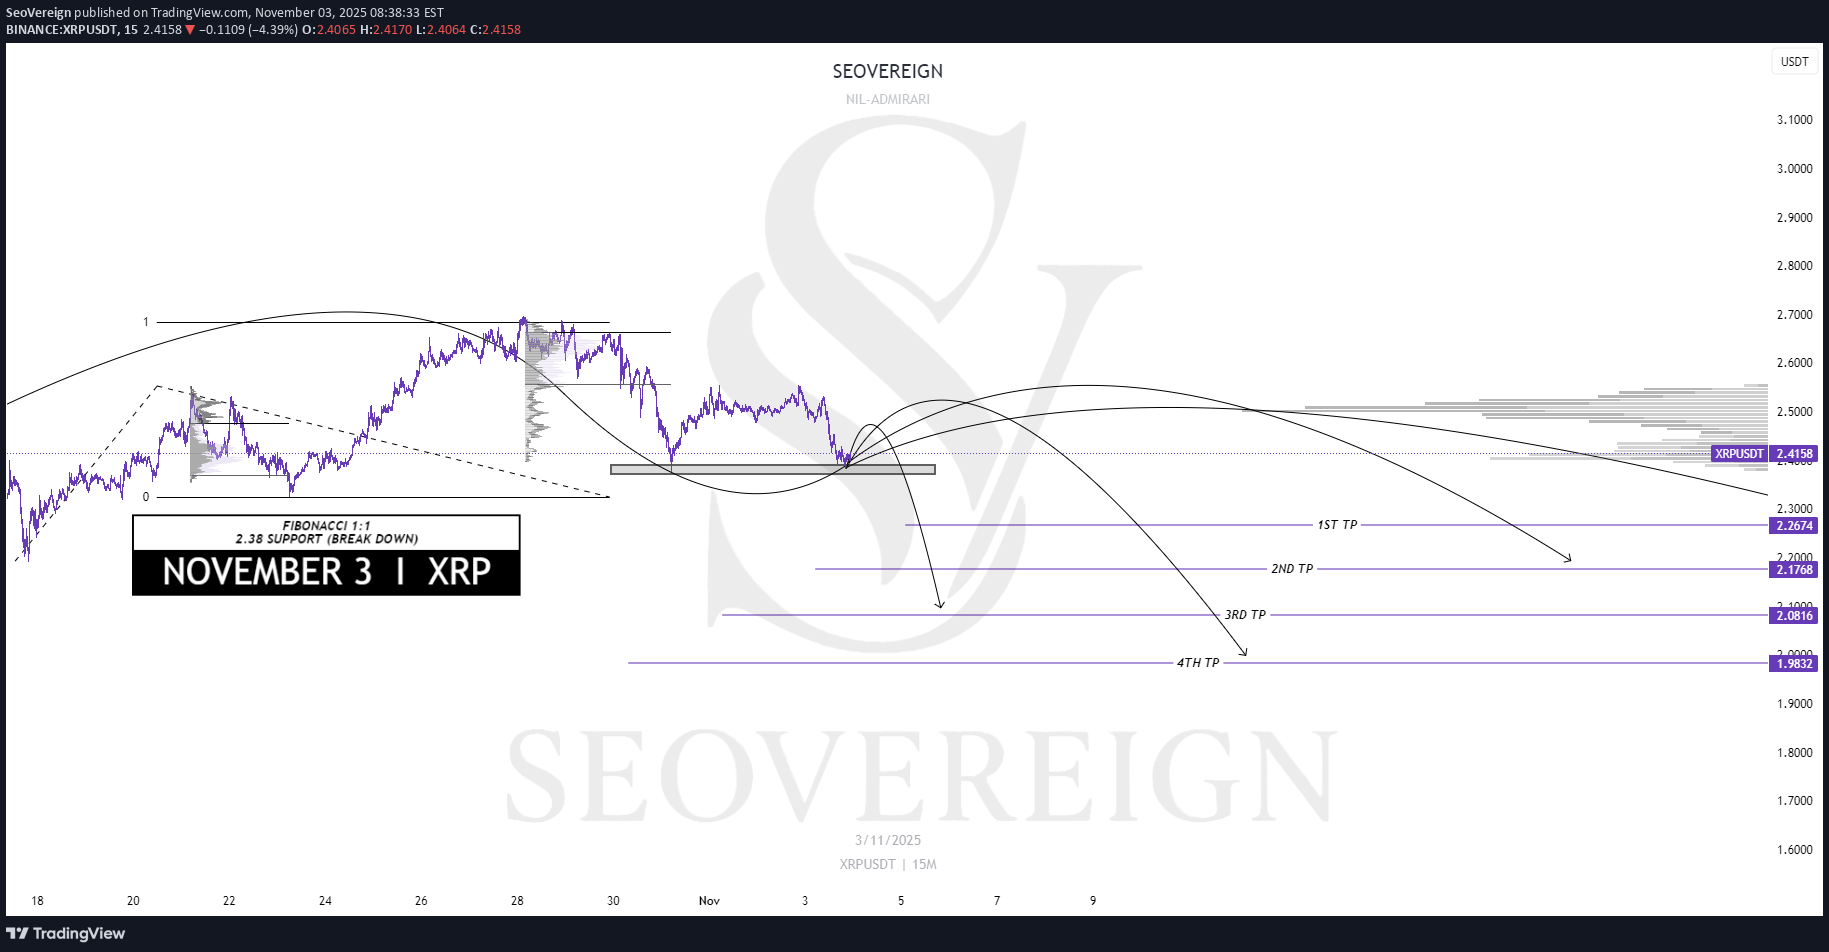
مایل هستم ایده معاملاتی خود را برای ریپل، مربوط به تاریخ ۳ نوامبر، با شما در میان بگذارم. این ایده در واقع بسط و ادامه ایده ۲۷ اکتبر است. پوزیشنهای فروش که در تاریخ ۲۷م باز شده بودند، در ارتباط با این ایده جدید، با سود بسته شد و من قصد دارم همزمان موقعیتهای (پوزیشنهای) اضافی جدیدی نیز اضافه کنم. مبنای کار — نسبت فیبوناچی ۱:۱ و شکست در سطح ۲.۳۸ تتر (USDT). در حال حاضر، ریپل نسبت فیبوناچی ۱:۱ را نسبت به موج صعودی قبلی تکمیل کرده است و در حال تلاش برای شکستن سطح حمایت ۲.۳۸ تتر (USDT) است. بنابراین، این منطقه احتمال بالایی برای گذار به یک روند نزولی جدید را نشان میدهد. من میانگین قیمت هدف را حدود ۱.۲ تتر (USDT) تعیین میکنم. مدیریت بیشتر پوزیشن و هرگونه بهروزرسانی بعدی، بسته به تحولات بازار ارائه شد. از اینکه مطالعه کردید، سپاسگزارم.
هشدار فوری اتریوم: آیا ریزش در راه است؟ تحلیل تکنیکال امروز (۲۷ اکتبر ۲۰۲۵)
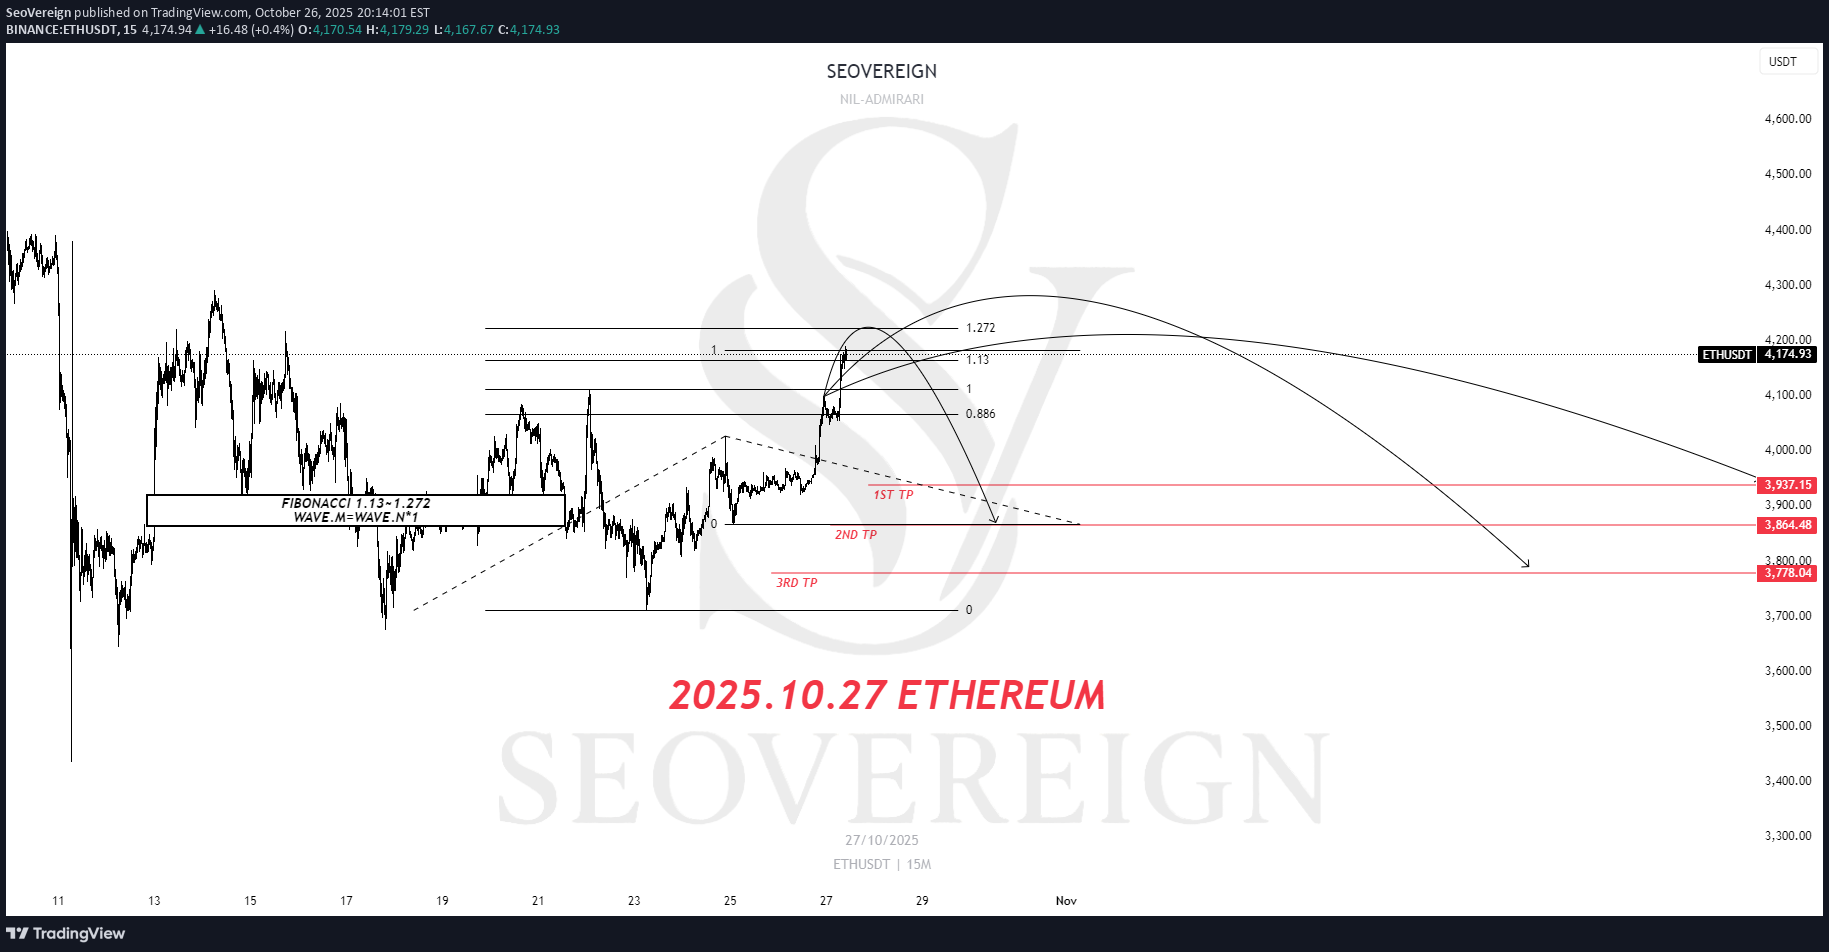
سلام به همه، در حال حاضر، Ethereum دوباره وارد یک منطقه مقاومت major شده است و احتمال بالایی برای شکلگیری یک movement اصلاحی کوتاهمدت وجود دارد. مبنای اول — فیبوناچی ۱.۱۳ تا ۱.۲۷۲ Ethereum نسبت به ساختار بالایی، در محدوده ۱.۱۳ الی ۱.۲۷۲ قرار گرفته است. این ناحیه به طور کلی به عنوان منطقه اشباع شده (یا بیش از حد داغ) یک موج صعودی شناخته میشود، جایی که پس از تشکیل یک سقف کوتاهمدت، فشار فروش معمولاً پدیدار میشود. مبنای دوم — موج M = موج N ضربدر ۱.۶۱۸ موج M در جریان، نسبت امتداد (بسط) تقریباً ۱.۶۱۸ را نسبت به موج N قبلی نشان میدهد. این موضوع نشاندهنده یک ساختار بیش از حد بسط یافته در نظریه موج است که به طور معمول به عنوان نشانهای از فرسودگی روند و برگشت احتمالی تعبیر میشود. بر این اساس، قیمت هدف میانگین حدود ۳,۸۶۴ تتر (USDT) تعیین شده است. این دیدگاه بر اساس data در تاریخ ۲۶ اکتبر است و بهروزرسانیهای بیشتری برای اصلاح این چشمانداز با پیشرفت بازار ارائه شد. از اینکه مطالعه کردید سپاسگزاریم.
پیشبینی سقوط سولانا: آیا زمان فروش فرارسیده است؟ (تحلیل 27 اکتبر)
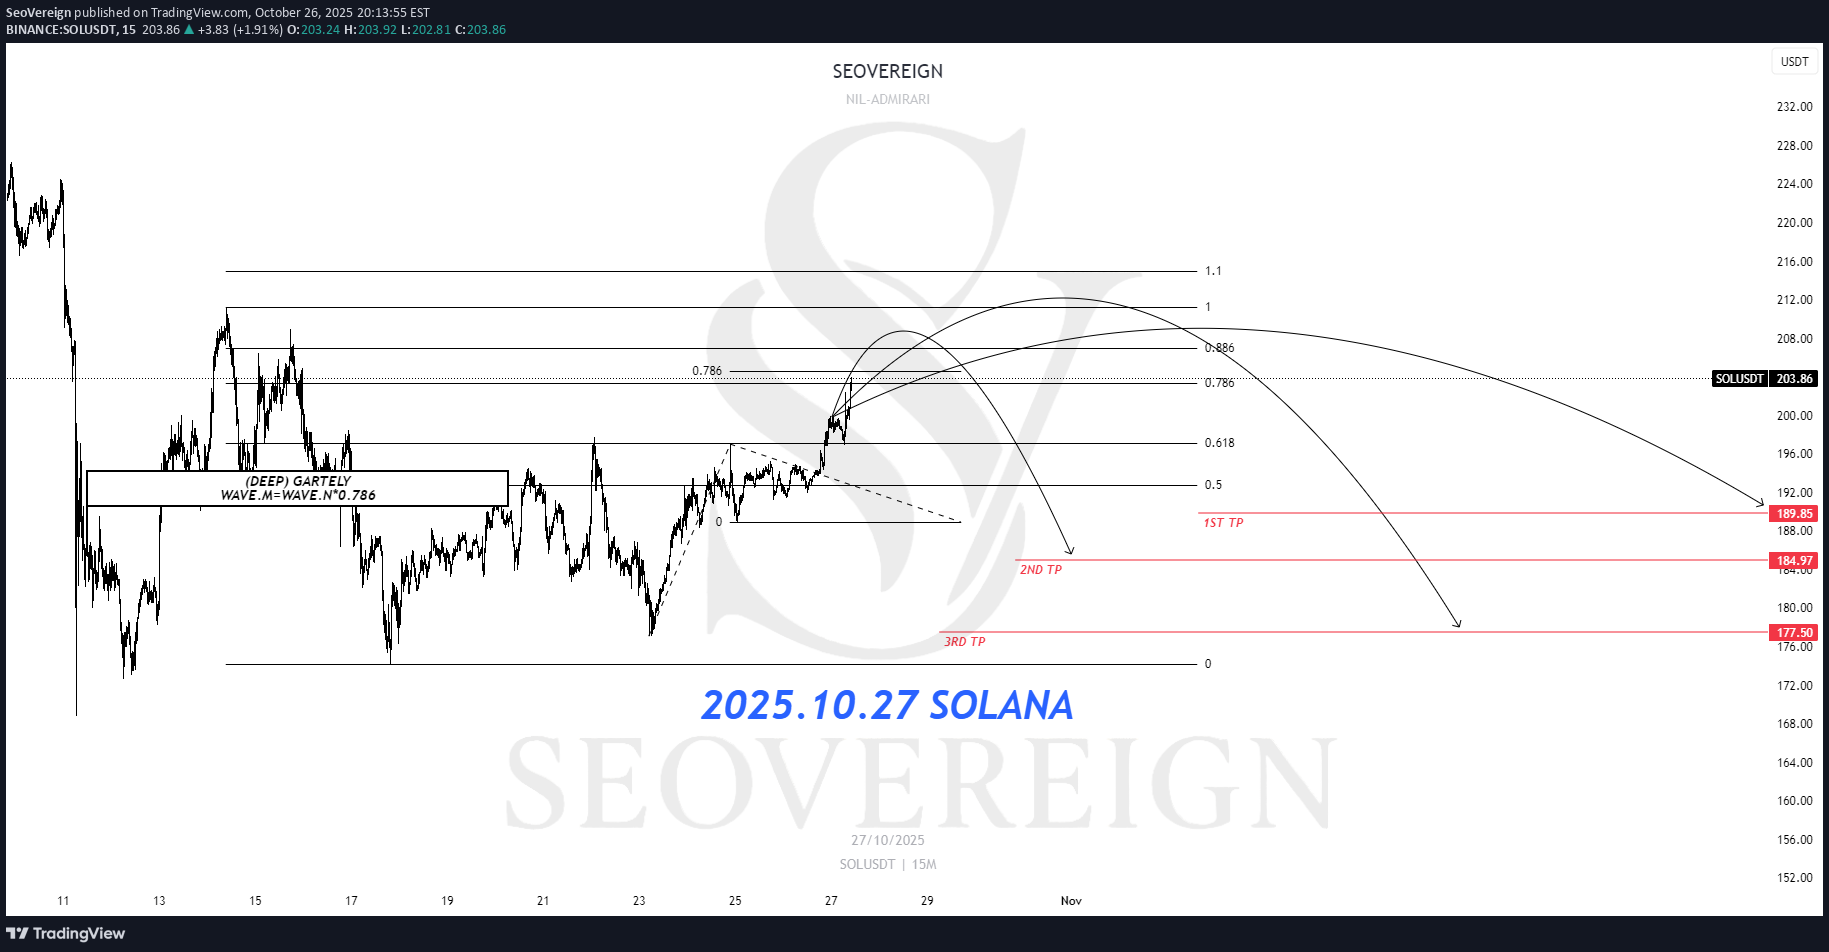
سلام به همگی، این ایده، تا تاریخ ۲۷ اکتبر، یک دیدگاه نزولی (شورت) را برای Solana ارائه میکند. در حال حاضر، Solana وارد محدوده اشباع خرید کوتاهمدت شده است، و ما شروع به مشاهده جریان تدریجی فشار فروش کردهایم. مبنای اول — الگوی گارتلی (DEEP) Solana در حال حاضر در ناحیه PRZ (ناحیه بازگشت بالقوه) الگوی گارتلی (DEEP) قرار گرفته است. این ناحیه معمولاً به عنوان فاز پایانی یک موج صعودی کوتاهمدت شناخته میشود، که در آن بازگشت روند به سمت نزول اغلب به دلیل شرایط اشباع خرید رخ میدهد. مبنای دوم — موج ۵. = موج N. ضربدر ۰.۷۸۶ موج M در حال جریان، تقریباً ۷۸.۶ درصد از طول موج N قبلی را تشکیل داده است، که نشاندهنده یک ساختار بازگشتی کلاسیک است که معمولاً در الگوی گارتلی مشاهده میشود. بنابراین، ورود به یک موقعیت شورت (فروش) در این محدوده، از نظر تکنیکالی معتبر تلقی میگردد. بر این اساس، میانگین قیمت هدف در حدود ۱۸۴.۹۷ تتر (USDT) تعیین شده است. بسته به تحولات آتی قیمت، بهروزرسانیهای بیشتری در مورد تکمیل این ایده و استراتژیهای مدیریت موقعیت ارائه کرد. ممنون از مطالعه شما.
پیشبینی سقوط ریپل (XRP): آیا زمان فروش در این سطح فرا رسیده است؟
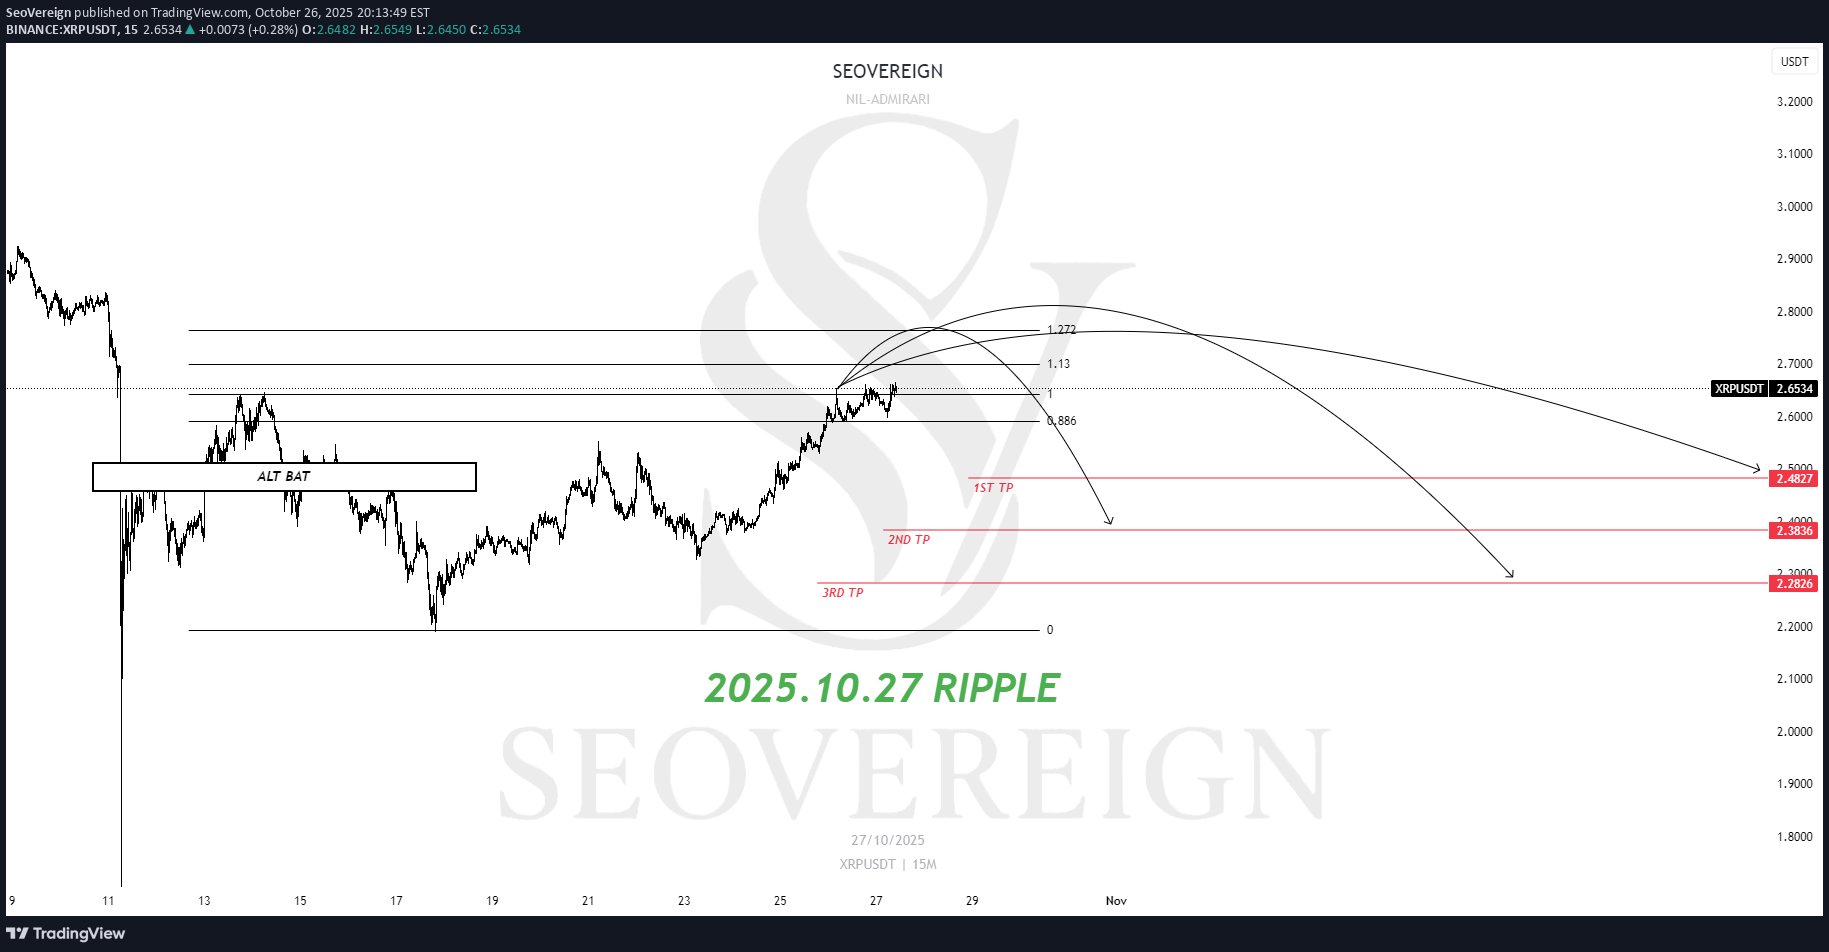
سلام به همه، این تحلیل دیدگاه نزولی (شورت) بر روی ریپل (XRP) ارائه میدهد. در حال حاضر، ریپل پس از یک حرکت صعودی کوتاهمدت، به محدوده مقاومت major رسیده است، و از منظر تکنیکال، احتمال وقوع یک فاز اصلاحی وجود دارد. مبنا — الگوی نزولی BAT (الگوی جایگزین Bat) از لحاظ ساختاری، ریپل وارد ناحیه برگشت احتمالی (PRZ) الگوی نزولی BAT شده است. این ناحیه مصادف است با محدودهای از قیمت که از لحاظ تاریخی فشار فروش قوی نشان داده است، و معمولاً پس از تکمیل الگو، یک بازگشت نزولی رخ میدهد. بر این اساس، قیمت هدف میانگین در حدود ۲.۳ تتر (USDT) تعیین شده است. این دیدگاه بر اساس data تا تاریخ ۲۷ اکتبر میباشد، و جزئیات بیشتر بسته به تحولات آتی قیمت ارائه شد. از اینکه این مطلب را مطالعه نمودید، سپاسگزاریم.
پیشبینی نزولی بیت کوین: ورود مجدد به بازار شورت با تحلیل فیبوناچی و ساختار موج!
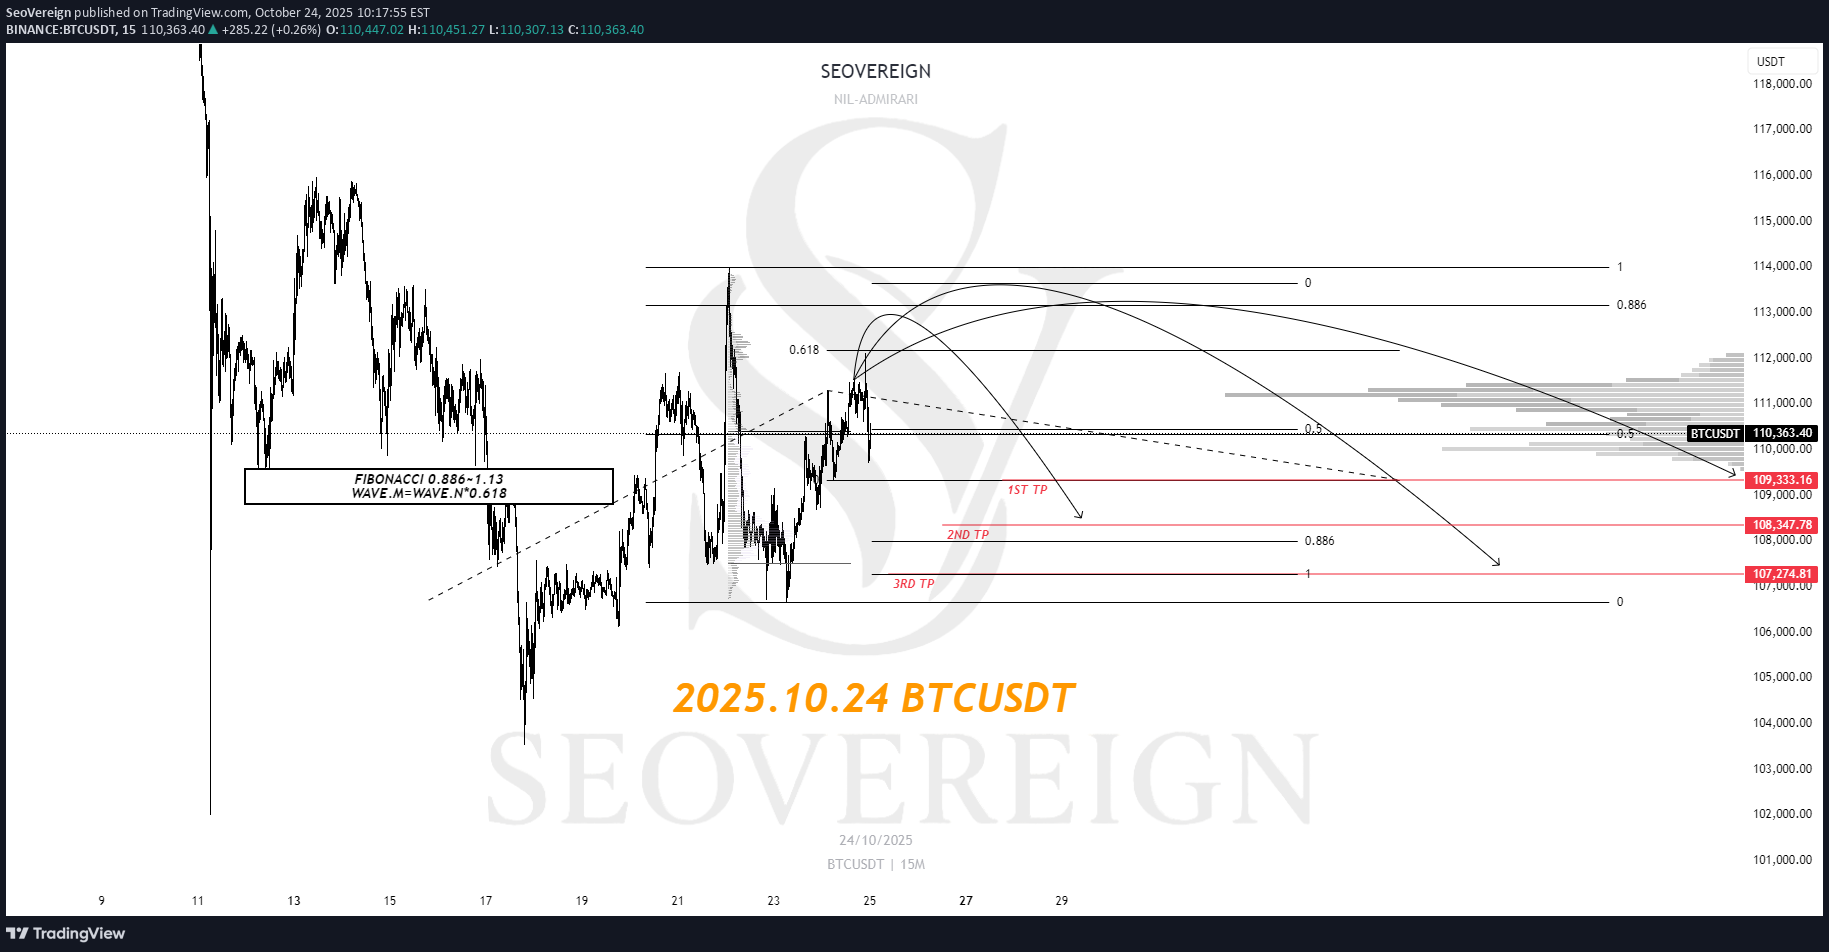
امروز، مورخ ۲۴ اکتبر، مایلم دیدگاه نزولی (فروش) خود را در خصوص Bitcoin به اشتراک بگذارم. در حال حاضر، پس از برداشت سود جزئی از موقعیت فروش (شورت) که در ۲۱ اکتبر باز شد، همچنان باقیمانده آن را حفظ کردهام. امروز، یک محدوده ورود معنیدار برای موقعیت فروش در نمودار شناسایی شده است و من در حال بررسی یک ورود (پوزیشن) اضافی هستم. اگر یک move نزولی رخ دهد، قصد دارم بر اساس این ایده، حجم موقعیت (پوزیشن) را بهتدریج افزایش دهم. با این حال، از آنجایی که بخشی از پوزیشن قبلاً تثبیت شده است و محدوده ورود جدید با محدوده قبلی همپوشانی دارد، با احتیاط عمل کرد و بهجای ورود تهاجمی، بهتدریج به پوزیشن اضافه نمود. دلایل در نظر گرفتن یک ورود فروش (شورت) اضافی به شرح زیر است: مبنای اول — فیبوناچی ۰.۸۸۶ تا ۱.۱۳ در حال حاضر، Bitcoin در محدوده ۰.۸۸۶ تا ۱.۱۳ نسبت به ساختار بالایی قرار گرفته است. این محدوده عموماً بهعنوان یک منطقه اشباع خرید (Overbought) تفسیر میشود و اغلب نشاندهنده آخرین امتداد یک موج صعودی قبلی است. بنابراین، هنگامی که قیمت وارد این محدوده میشود، فشار فروش تمایل به افزایش دارد، که میتواند سیگنالی برای یک اصلاح کوتاهمدت یا یک برگشت روند احتمالی باشد. مبنای دوم — موج M = موج N × ۰.۷۸۶ از نظر ساختار موجی، موج M دلخواه در حال اجرا، نسبت تقریبی ۰.۷۸۶ را نسبت به یک موج N دلخواه قبلی نشان میدهد. این نسبت اغلب در نزدیکی نقاط عطف ظاهر میشود و نشان میدهد که مومنتوم (شتاب) موج صعودی بهتدریج در حال تضعیف است. بر این اساس، قیمت هدف میانگین حدود ۱۰۸,۳۴۷ تتر (USDT) تعیین شده است. بسته به تحولات آتی قیمت، در خصوص هرگونه تغییر در این ایده و استراتژی مدیریت موقعیت (پوزیشن) خود، بهروزرسانیهای بیشتری ارائه داد. سپاس از مطالعه شما.
سلب مسئولیت
هر محتوا و مطالب مندرج در سایت و کانالهای رسمی ارتباطی سهمتو، جمعبندی نظرات و تحلیلهای شخصی و غیر تعهد آور بوده و هیچگونه توصیهای مبنی بر خرید، فروش، ورود و یا خروج از بازارهای مالی نمی باشد. همچنین کلیه اخبار و تحلیلهای مندرج در سایت و کانالها، صرفا بازنشر اطلاعات از منابع رسمی و غیر رسمی داخلی و خارجی است و بدیهی است استفاده کنندگان محتوای مذکور، مسئول پیگیری و حصول اطمینان از اصالت و درستی مطالب هستند. از این رو ضمن سلب مسئولیت اعلام میدارد مسئولیت هرنوع تصمیم گیری و اقدام و سود و زیان احتمالی در بازار سرمایه و ارز دیجیتال، با شخص معامله گر است.