
ProfessorXtrader
@t_ProfessorXtrader

تریدر چه نمادی را توصیه به خرید کرده؟
سابقه خرید
تخمین بازدهی ماه به ماه تریدر
پیام های تریدر
فیلتر
نوع پیام
ProfessorXtrader
پیشبینی شوکهکننده بیت کوین: آیا BTC به 143,000 دلار میرسد یا سقوط آزاد به زیر 90 هزار؟
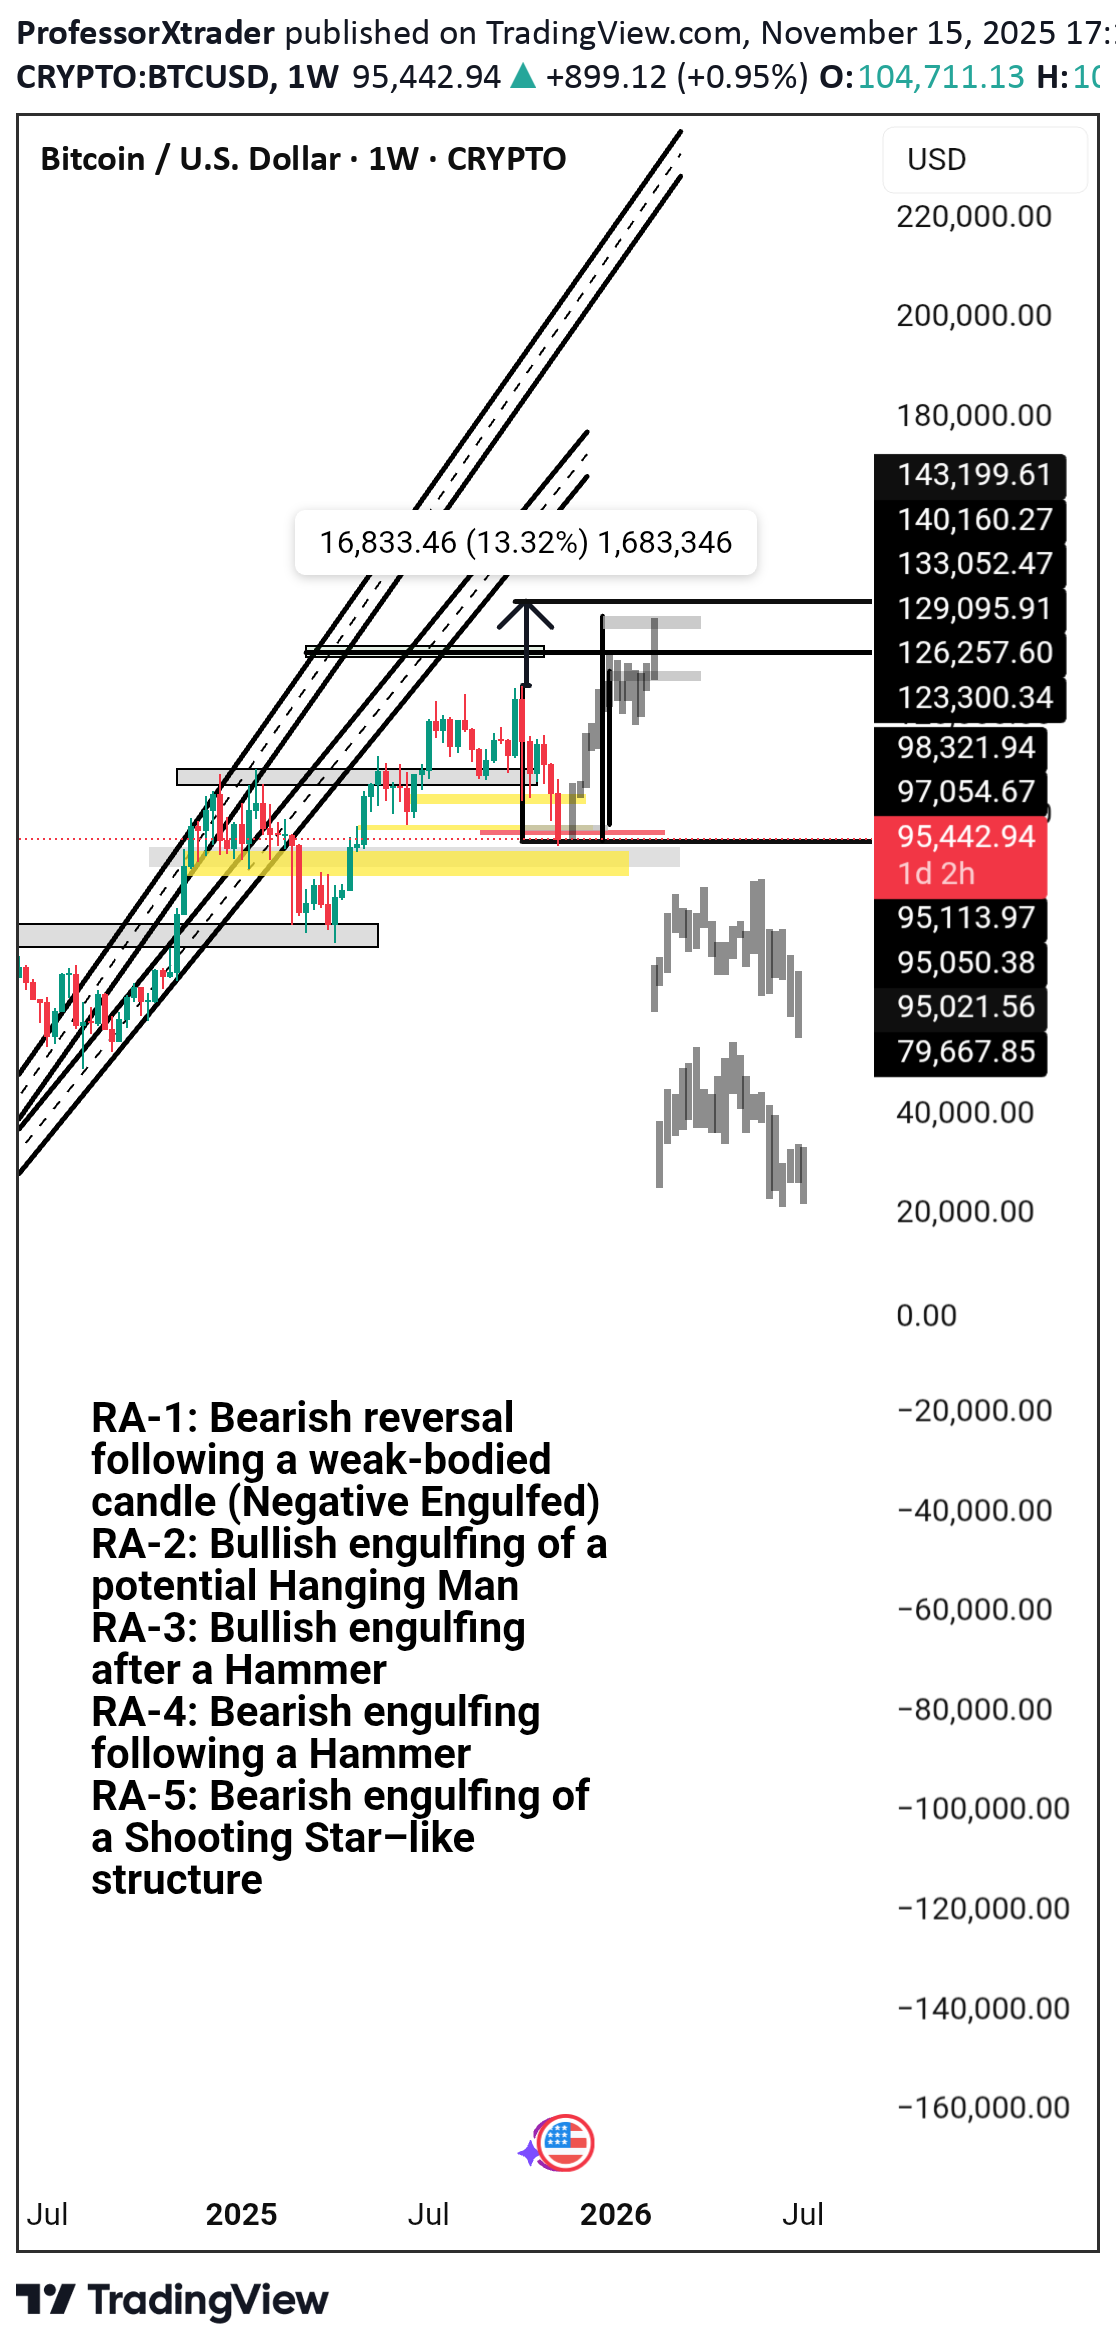
مرحله صعودی بعدی تا نزدیکی ۱۴۳,۰۰۰ بود. اگر قیمت این هفته زیر ۹۴,۵۰۰ بسته شود، میتوانیم شاهد کاهش تا زیر ۹۰ هزار و حرکت به سمت ۸۷ هزار باشیم.
ProfessorXtrader
تحلیل تکنیکال هفتگی بیت کوین: آیا حمایت مهم میشکند؟ ($BTC)
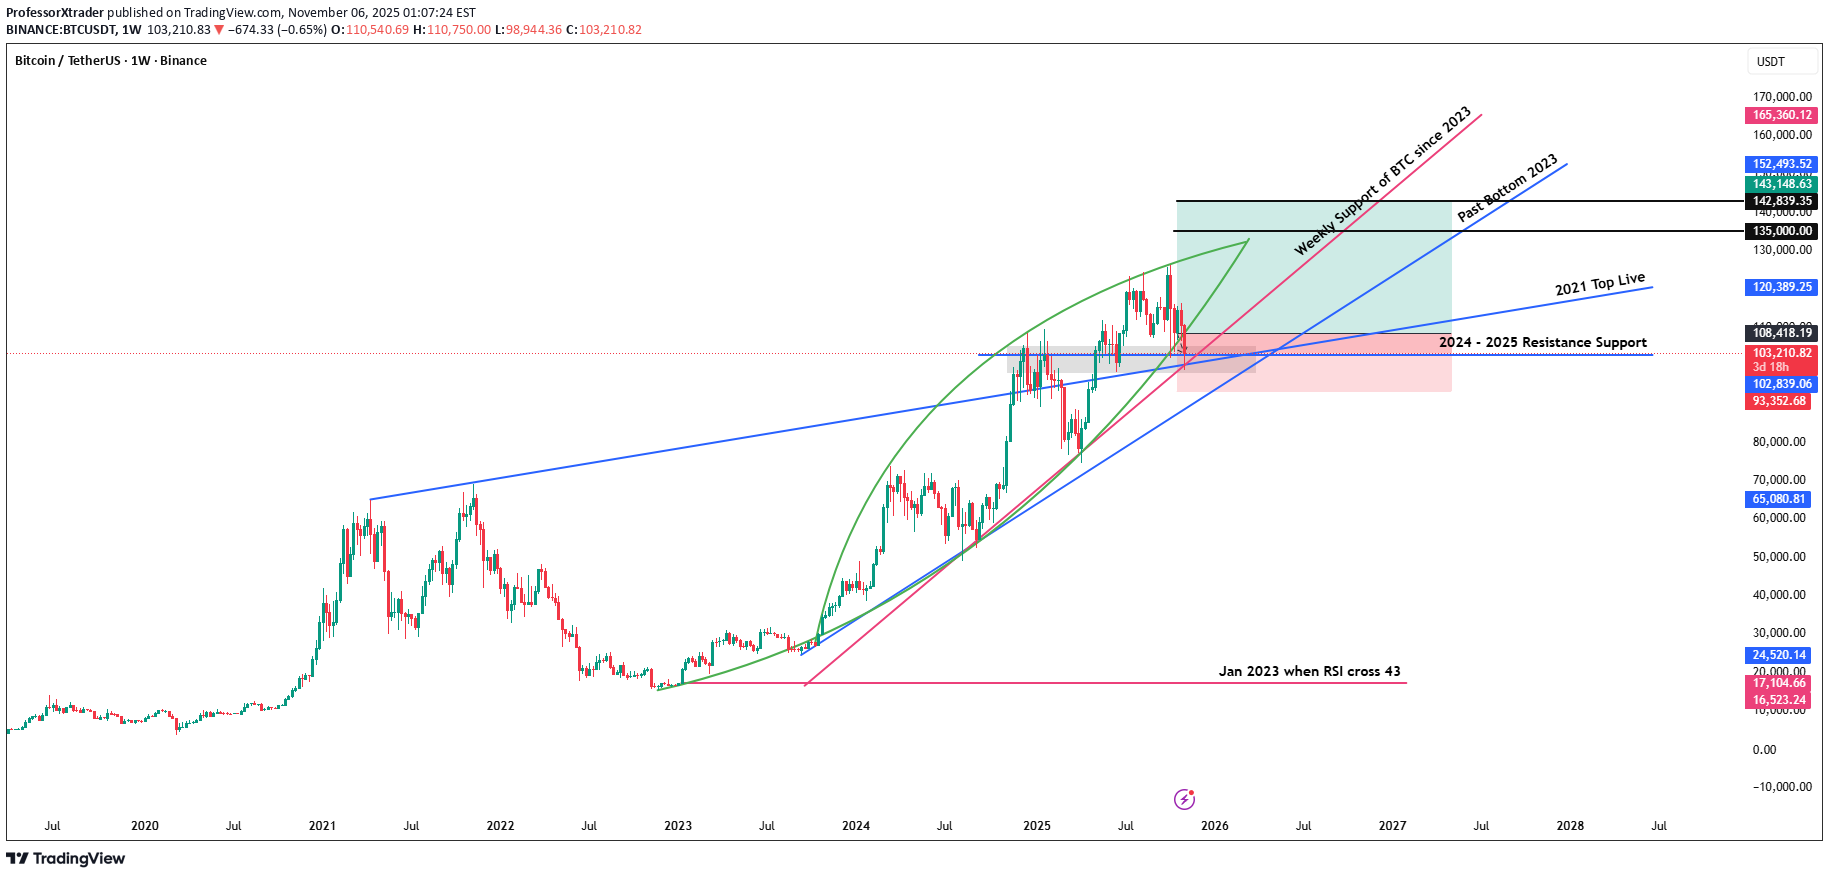
Bitcoin Weekly Technical Analysis Report BTCUSDT Background Overview Bitcoin (BTC) has become the most influential digital asset globally due to its decentralization, fixed supply, and transparent transactions. At the intersection of traditional finance and the crypto market, Technical Analysis (TA) is a crucial tool for investors to assess price trends and develop trading strategies. Based on the three key assumptions—“history repeats itself,” “price moves in trends,” and “market action discounts all information”—technical analysis uses chart patterns, trend lines, support and resistance levels, volume, and various indicators to make probabilistic forecasts about future price movements. The weekly chart, as a core time frame for medium- to long-term trend analysis, filters out noise from daily and lower time frames, providing a clearer view of the main trend direction, key turning points, and the balance between bulls and bears. The BTC/USDT weekly chart analyzed here (from TradingView) covers price movements from 2023 to the present. It includes annotations such as “Weekly Support of BTC since 2023,” “Past Bottom 2023,” and “2024–2025 Resistance Support,” along with green and pink shaded areas that visually represent different stages of market psychological levels. Currently, Bitcoin is priced at 103,384.25 USDT, with a weekly decline of -6.47% and a weekly volume of 118,000 USDT. From the chart structure, the price is near the 2024–2025 resistance-turned-support zone while being supported by the ascending trend line that has formed since 2023. The battle between bulls and bears is intense in this range, and price movements over the coming weeks will have a decisive impact on the medium- to long-term trend. This report will combine key support and resistance levels, trend lines, volume, and technical indicators from the chart, compare historical patterns with the current market environment, conduct an in-depth analysis from multiple perspectives, and propose corresponding strategic recommendations and risk warnings. Research Support and Evidence Analysis This analysis is strictly based on the technical elements and relevant market data presented in the chart, with the following key supporting points: • Current price and change: 103,384.25 USDT, weekly decline of -6.47%, indicating short-term bearish dominance, but the price has not yet broken key support. • Weekly volume: 118,000 USDT, which has expanded compared to the recent average, suggesting increased market participation and greater divergence between bulls and bears. • Key support levels: – “Weekly Support of BTC since 2023” trend line: An ascending trend line connecting the weekly lows since 2023, currently around 100,000 USDT, providing important support. – “Past Bottom 2023” zone: The 2023 Bitcoin low accumulation area, around 95,000–98,000 USDT, serving as the last line of defense for bulls. • Key resistance levels: – “2024–2025 Resistance Support” level: Previous high points where price repeatedly failed to break through, around 110,000–115,000 USDT, now acting as resistance. – Pink resistance zone: Corresponds to historical accumulation areas and Fibonacci extension levels, around 118,000–122,000 USDT, serving as both a target for bulls and a point for bears to counterattack. • Trend line analysis: – Main ascending trend line: Extending upward from the 2023 low with a moderate slope, reflecting the medium- to long-term bullish trend. – Secondary descending trend line: Connecting the late 2024 and early 2025 highs, forming a short-term descending channel; the price is currently approaching the upper boundary of this channel. • Volume confirmation: – When the 2023 support zone formed, volume gradually decreased, indicating easing selling pressure. – When breaking through resistance in 2024, volume expanded significantly, confirming the validity of the breakout. – During the current pullback, volume has expanded again, requiring vigilance against panic selling. Data Comparison and Detailed Summary To more intuitively present the relationship between key price levels and historical movements, the main support and resistance levels, trend lines, and volume characteristics are summarized as follows: https://drive.google.com/file/d/1OfXzBkFOYlxAPQrEFXRLbt1GCAD37Avk/view?usp=sharing From the table, it is clear that the support system formed in 2023 remains effective, while the resistance zone from late 2024 to early 2025 is pressuring the current price. Volume shows distinct patterns at different stages: decreasing at support zones, expanding on breakouts, and expanding again during pullbacks, reflecting cyclical changes in market sentiment. Source Origin and Citation Interpretation • Data authority: TradingView integrates real-time quotes from major global exchanges, ensuring the accuracy of price and volume data. • Annotation professionalism: The trend lines, support and resistance zones on the chart are drawn by experienced analysts based on classic technical analysis methods such as historical highs and lows, accumulation areas, and Fibonacci retracements. • Time frame representativeness: The weekly chart filters short-term fluctuations and is more suitable for medium- to long-term trend analysis, matching the decision cycles of institutional investors and long-term holders. For labels such as “Weekly Support of BTC since 2023,” “Past Bottom 2023,” and “2024–2025 Resistance Support,” their origin is the chart drawer’s summary of historical key price levels. Although somewhat subjective, they align with the general definitions in technical analysis for “significant highs and lows” and “accumulation areas.” Therefore, interpretation should combine multiple verifications (such as volume and indicator confirmation) to reduce the risk of bias from single labels. In-depth Insights and Independent Thinking Combining the above data and chart features, deeper market insights can be gained from the following perspectives: The medium- to long-term trend remains healthy – The main ascending trend line has been extending upward from the 2023 low, and each pullback has not broken below it, indicating that the bullish structure is intact. – The current price is approaching this trend line. If it can stabilize and rebound here, it will validate the effectiveness of the trend support and lay the foundation for the next upward wave. The importance of the resistance-turned-support zone – The 110,000–115,000 USDT zone repeatedly acted as resistance from late 2024 to early 2025. After being recently broken, it has turned into support. – If the price can stabilize above this zone, it will further consolidate the bulls’ advantage and challenge the pink resistance zone (118,000–122,000 USDT). Volume signals reveal market sentiment – Volume decreased at the 2023 bottom, indicating exhausted selling pressure and paving the way for the subsequent rebound. – Volume expanded during the resistance breakout, confirming increased market participation, while the current pullback’s expanded volume requires vigilance against panic selling. – Future signs of stabilization with decreasing volume will present a better opportunity for bulls to enter. Risks and opportunities coexist – Short-term bears dominate, and the price is approaching the main ascending trend line. A breakdown below could trigger larger-scale stop-losses, targeting the 95,000–98,000 USDT zone. – If the trend line support holds, combined with oversold signals from technical indicators, a wave of buying opportunities will emerge, with an initial target of 110,000–115,000 USDT. Macro environment and market structure – Global liquidity, regulatory policies, and institutional capital flows are exogenous variables affecting Bitcoin’s medium- to long-term trends. – Although technical analysis can provide probabilistic judgments on price paths, it still needs to be combined with fundamental analysis and market sentiment to improve decision-making success rates. Extended Discussion / Related Topics In the current technical context, the following topics can be further explored: • Multi-dimensional verification of technical indicators – Relative Strength Index (RSI): Whether the weekly RSI is in overbought or oversold territory, and any divergence with price. – Moving Averages (MA): The arrangement and divergence of the 50-week, 100-week, and 200-week MAs, and their confirmation of trend direction. – MACD histogram and signal line: Weekly golden crosses and death crosses, as well as momentum changes in the histogram, indicating trend continuation or reversal. • Fibonacci retracement and extension – The role of Fibonacci retracement levels (38.2%, 50%, 61.8%) from the 2023–2024 main upward wave in the current pullback. – If the price breaks above the pink resistance zone, the next targets can be referenced by Fibonacci extension levels (161.8%, 261.8%). • Market sentiment and capital flows – Can data such as futures open interest, funding rates, and exchange net inflows/outflows resonate with chart patterns? – The impact of continuous buying by institutions like Grayscale and MicroStrategy, compared with the long-short ratio of retail leveraged funds, on medium- to long-term support and resistance. • Risk management strategies – Near key support and resistance levels, how to set stop-loss and take-profit to optimize risk-reward ratios. – When volatility surges, should position size be adjusted, or derivatives like options be used for hedging? • Future trend outlook – If the price stabilizes above 110,000–115,000 USDT, the bullish target could extend to 130,000–150,000 USDT. – If it breaks below the main ascending trend line and loses the 95,000 USDT support, a larger-scale correction may begin, with a downside target around 80,000 USDT. Through in-depth exploration of the above topics, a more comprehensive investment decision framework can be constructed. On the basis of technical analysis, combining market structure and macro factors will improve the ability to predict price movements.
ProfessorXtrader
سهم SEI آماده پرواز؛ اهداف صعودی هیجانانگیز تا ۲.۵ دلار!

این موقعیت آماده اوجگیری است. هدف من برای آن بالای ۱ دلار تعیین شده است. ۵۰٪ (پنجاه درصد) از این دارایی را در سطح ۱ دلار فروخت. اهداف بعدی ۱.۸۵ تا ۲.۵ دلار هستند.
ProfessorXtrader
$ETH Ethereum Market Outlook – July 2025
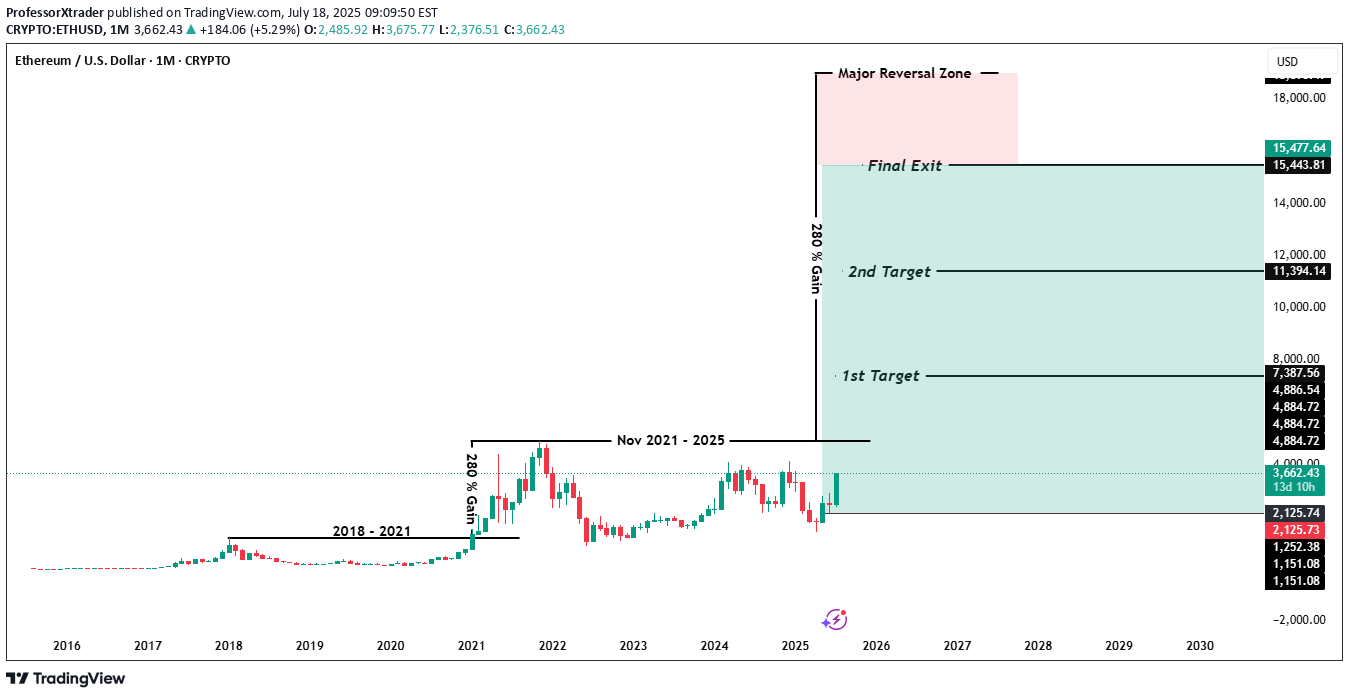
Ethereum چشم انداز بازار - ژوئیه 2025 توسط fatherorxtrader برای شما آورده شده است 🚀 Ethereum Breakout تنظیم صعودی چند ساله را تأیید می کند Ethereum ( ETH ) به طور رسمی از یک محدوده ادغام چند ساله جدا شده و یک چرخه صعودی قوی را در پیش می گیرد. با قیمت فعلی با قیمت 3،645.50 دلار ، ETH از 18 ژوئیه 2025 46.65 ٪ قابل توجه ماهانه را به خود اختصاص داده است. این حرکت صحنه را برای پتانسیل صعودی چند لایه تنظیم می کند-در اینجا نمودار به ما می گوید. uvels سطح و اهداف کلیدی 🔸 محدوده ادغام قبلی (2018-2021) ETH بیش از سه سال در سطح 4،884 پوند تحت پوشش قرار گرفت و یک پایه تجمع جامد را تشکیل داد. zone منطقه برک آوت پشتیبانی: 1،150 دلار - 1،250 دلار تأیید تغییر چرخه: قیمت اکنون بسیار بالاتر از منطقه Breakout است. 🎯 اهداف صعودی (Ethereum) هدف اول: 📍 قیمت: 7،387.56 دلار 📈 افزایش بالقوه: 100 ٪ ~ از منطقه برک آوت هدف دوم: 📍 قیمت: 11،394.14 دلار 📈 سود بالقوه: 180 ~ خروج نهایی (Major منطقه وارونگی): 📍 دامنه قیمت: 15،443.81 دلار - 15،477.64 دلار 🚨 پتانسیل افزایش کل: 280 ~ از شکست 📌 منطقه بین 15.4K تا 18 کیلو دلار به عنوان منطقه واژگونی Major مشخص شده است ، منطقه ای که سودآوری و فرسودگی روند بسیار محتمل است. 📈 تفسیر بازار BULLISH BREAKOUT: مقاومت طولانی مدت اکنون پشتیبانی می شود. حجم و حرکت: شمع ماهانه قوی با گسترش نوسانات ، محکومیت را تأیید می کند. ساختار: اهداف مبتنی بر پیش بینی های فنی تمیز ، گسترش فیبوناچی و روانشناسی بازار است. 🔔 چه چیزی را تماشا کنیم 📅 نزدیک ماهانه بالاتر از سطح فعلی ، شکست را تأیید می کند. 🔍 مانیتور سیگنال های رد در نزدیکی هدف اول. با نزدیک شدن به منطقه واژگونی major ، توقف های دنباله دار را قرار دهید. 💡 نوک طرفدار از ProfessorxTrader "بیشترین سود در رمزنگاری در هنگام شکستن تمیز از محدوده چند ساله حاصل می شود. ETH اکنون وارد آن مرحله می شود-اهداف خود را برنامه ریزی کنید و از زمان صعود از سرمایه خود محافظت کنید."
ProfessorXtrader
ONDO
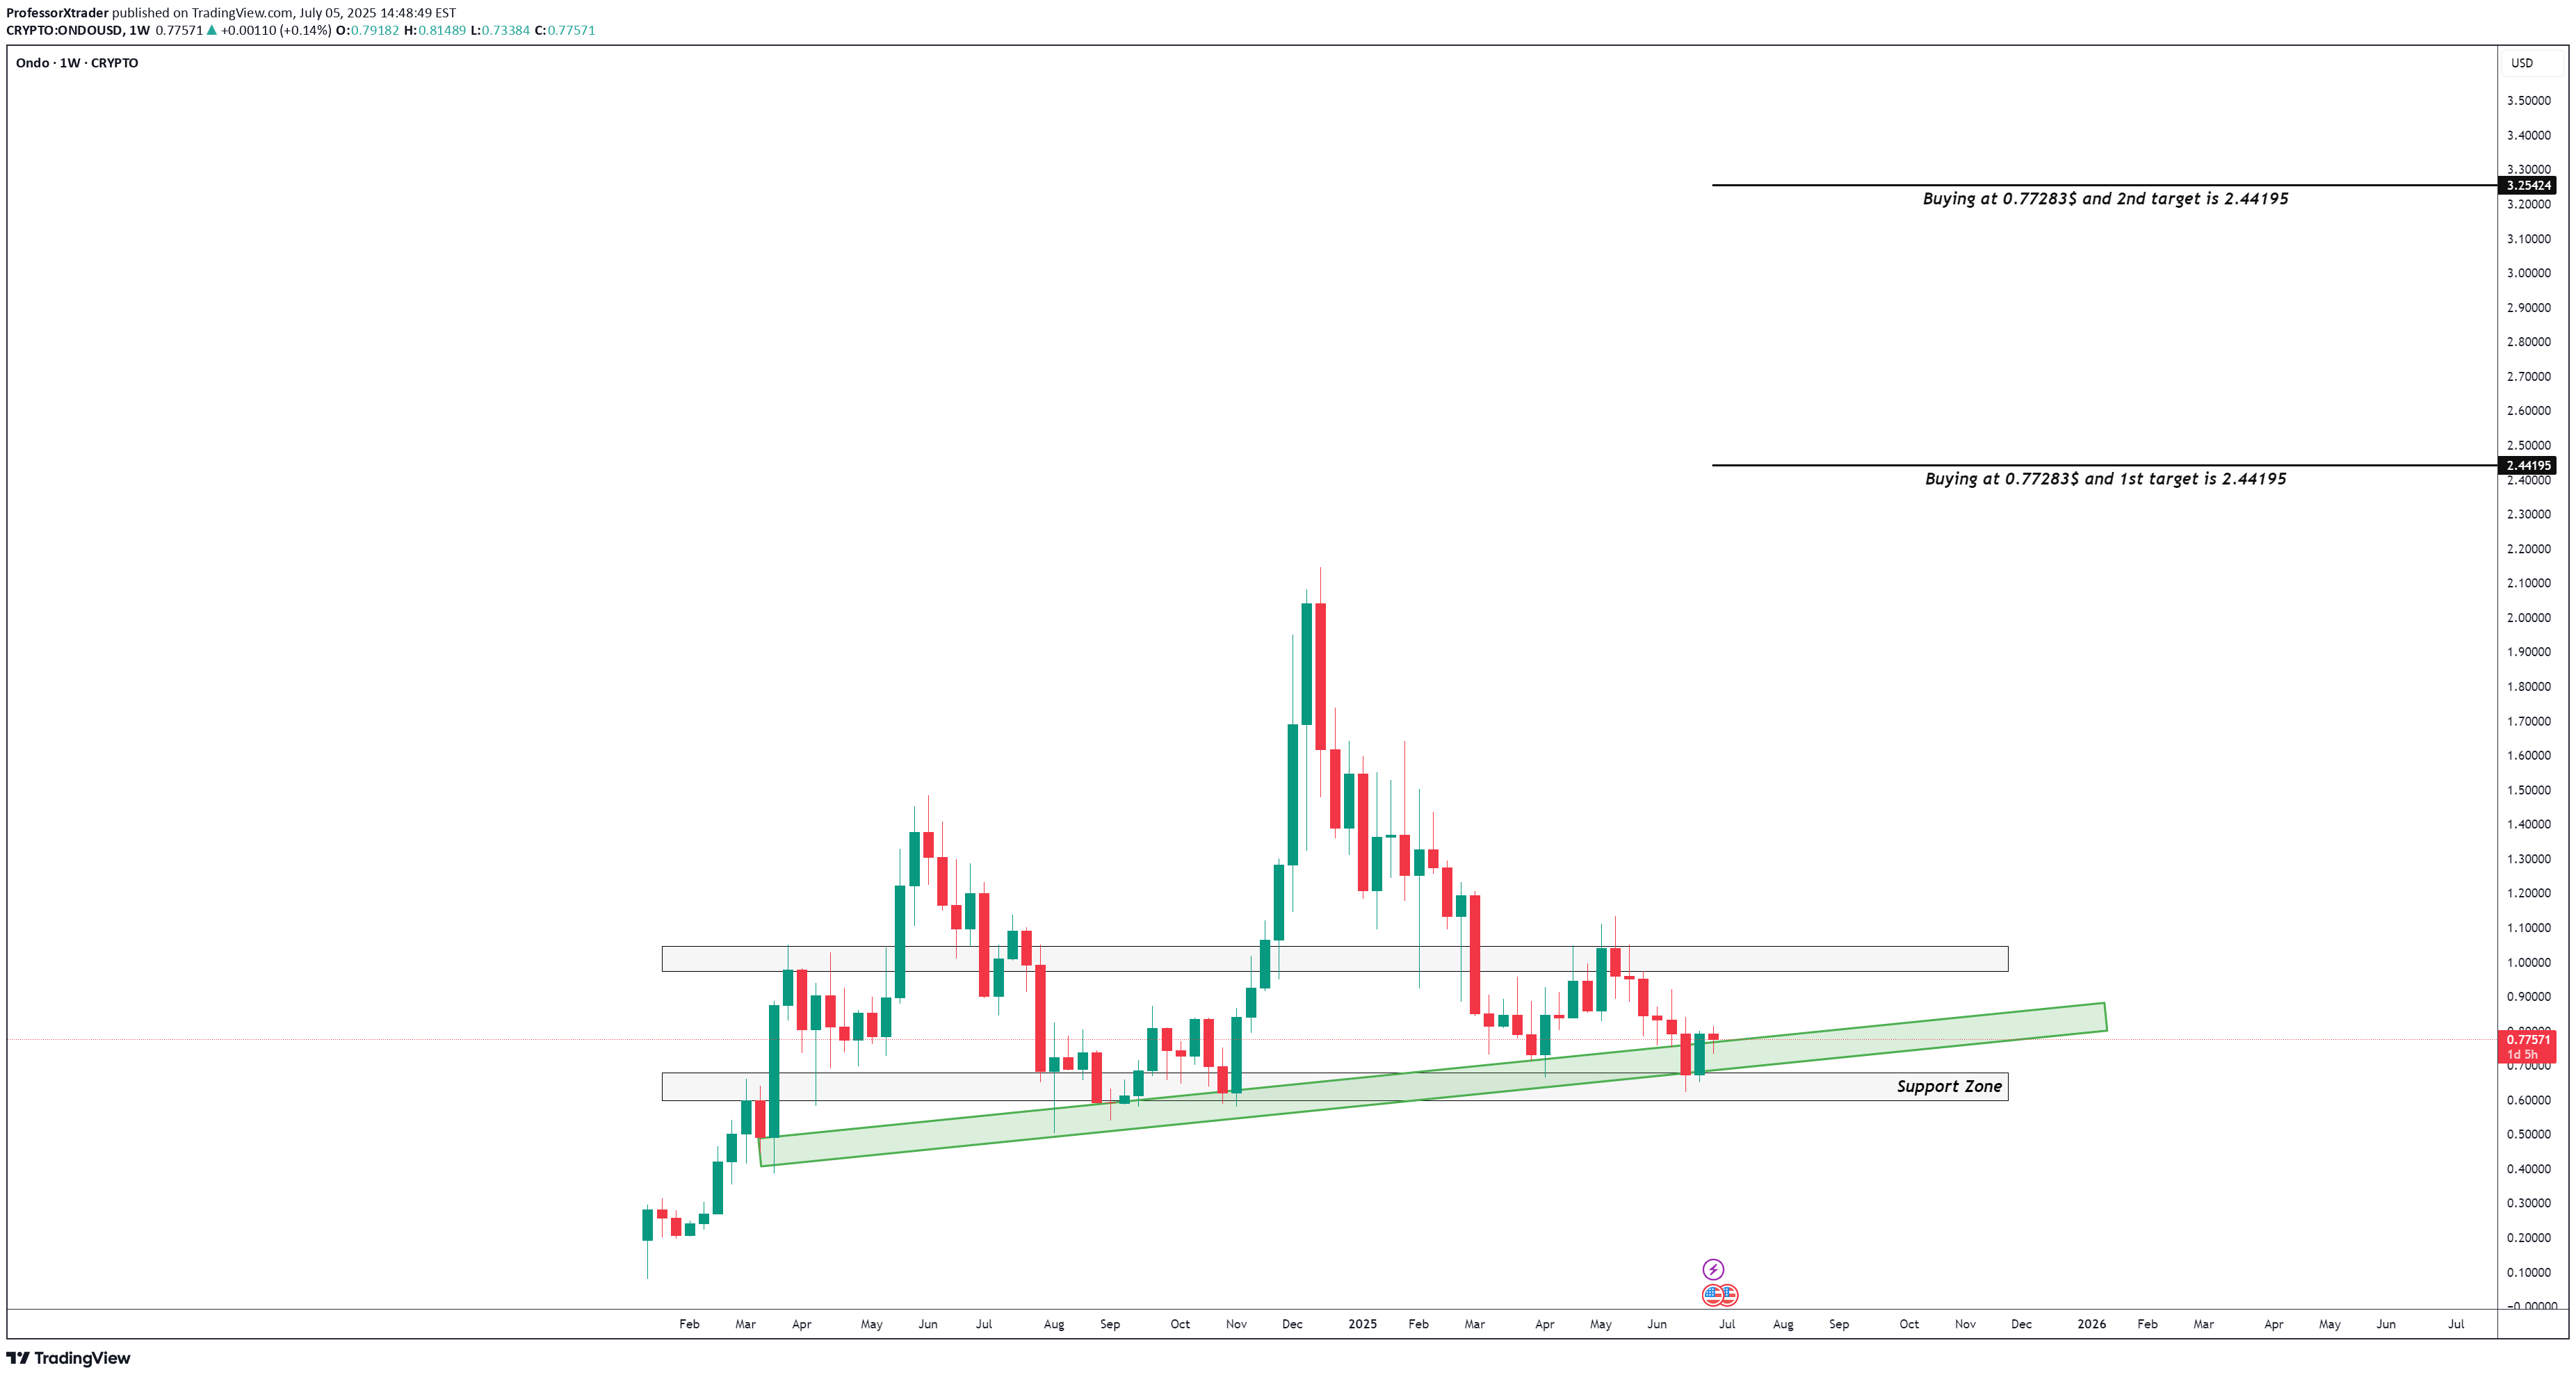
این تحلیل تکنیکال من بر اساس الگوی کندل استیک پوشای صعودی (Bullish Engulfing) است. اگر این الگو را دوباره ببینیم، بازار صعودی شد.
ProfessorXtrader
Just open log on Waves

فقط در waves با 20x طولانی باز کنید 100 دلار در خرید Spot سرمایه گذاری کنید.
ProfessorXtrader
ETH USD

🧠 چرخه اتریوم هیچ رمز و راز نیست 📉 dump → 🔁 ادغام → pump پمپ → تکرار شود؟ 📊 تجزیه چرخه: 📌 پمپ → DUMP → ادغام (CON) ✅ الگوی تکرار شده از سال 2018 ✅ مناطق ادغام در حال راه اندازی لنت ها هستند ✅ RSI هر بار این رفتار دقیق را آینه می دهد 🔎 اکنون در داخل یک شکاف ارزش منصفانه (F.V.G) و منطقه عقب RSI نشسته است ⚡ سیگنال های جریان: 🔹 RSI در همان منطقه جایزه مانند قبل major حرکت می کند 🔹 ETH قیمت نشستن روی پشتیبانی عمودی + منطقه FVG 🔹 آخرین باری که این راه اندازی تشکیل شد؟ ➡ 🚀 🚀 ETH از 90 $ → 4000 $+ رفت 🏁 چه چیزی را تماشا کنیم: ‣ از دامنه RSI فعلی rese از پشتیبانی 1.400 - 1500 دلار پشتیبانی ‣ اهداف بالقوه بعدی: 3،000 دلار → 4،100 دلار 💡 تاریخ تکرار نمی شود - اما قافیه ها
ProfessorXtrader
Neo Is Ready for the take off

🧠 NEO چرخه قیمت - تاریخ خود را تکرار می کند؟ 📈 پمپ → dump → ادغام → تکرار 🔁 هر چرخه گاو نر major NEO همان الگوی را دنبال کرده است: ✅ 2017: پمپ بزرگ → خرابی → ادغام چند ساله ✅ 2021: همان حرکت دقیق - پمپ → زباله → جانبی ⚠ 2025؟ الگوی دوباره رو به رو است ... 🔍 بینش کلیدی: 🟡 مراحل ادغام همیشه پیش از حرکات انفجاری بوده اند 📊 RSI از پایین یک صعود آشنا را نشان می دهد 🚀 شکستن تاریخی درست از مناطق مانند این شروع شد 💰 اهداف (اگر تاریخ تکرار شود): 6 $ 6 → 30 $ → 73 $ → 100 $+ 🔮 آیا این می تواند آرامش قبل از طوفان بعدی باشد؟ justem ساختار را محو نکنید. 📆 صبر = سود در چرخه هایی مانند این. 📌 NEO را روی رادار خود نگه دارید. من فقط در 14 روز پس از تجزیه و تحلیل من ، 200 دلار روی آن در پمپ Spotneo 10 ٪ سرمایه گذاری می کنم. آیا می تواند طی 3-6 ماه آینده به 30 دلار رسیده باشد؟ اکنون نظرات
ProfessorXtrader
Long on Babydoge
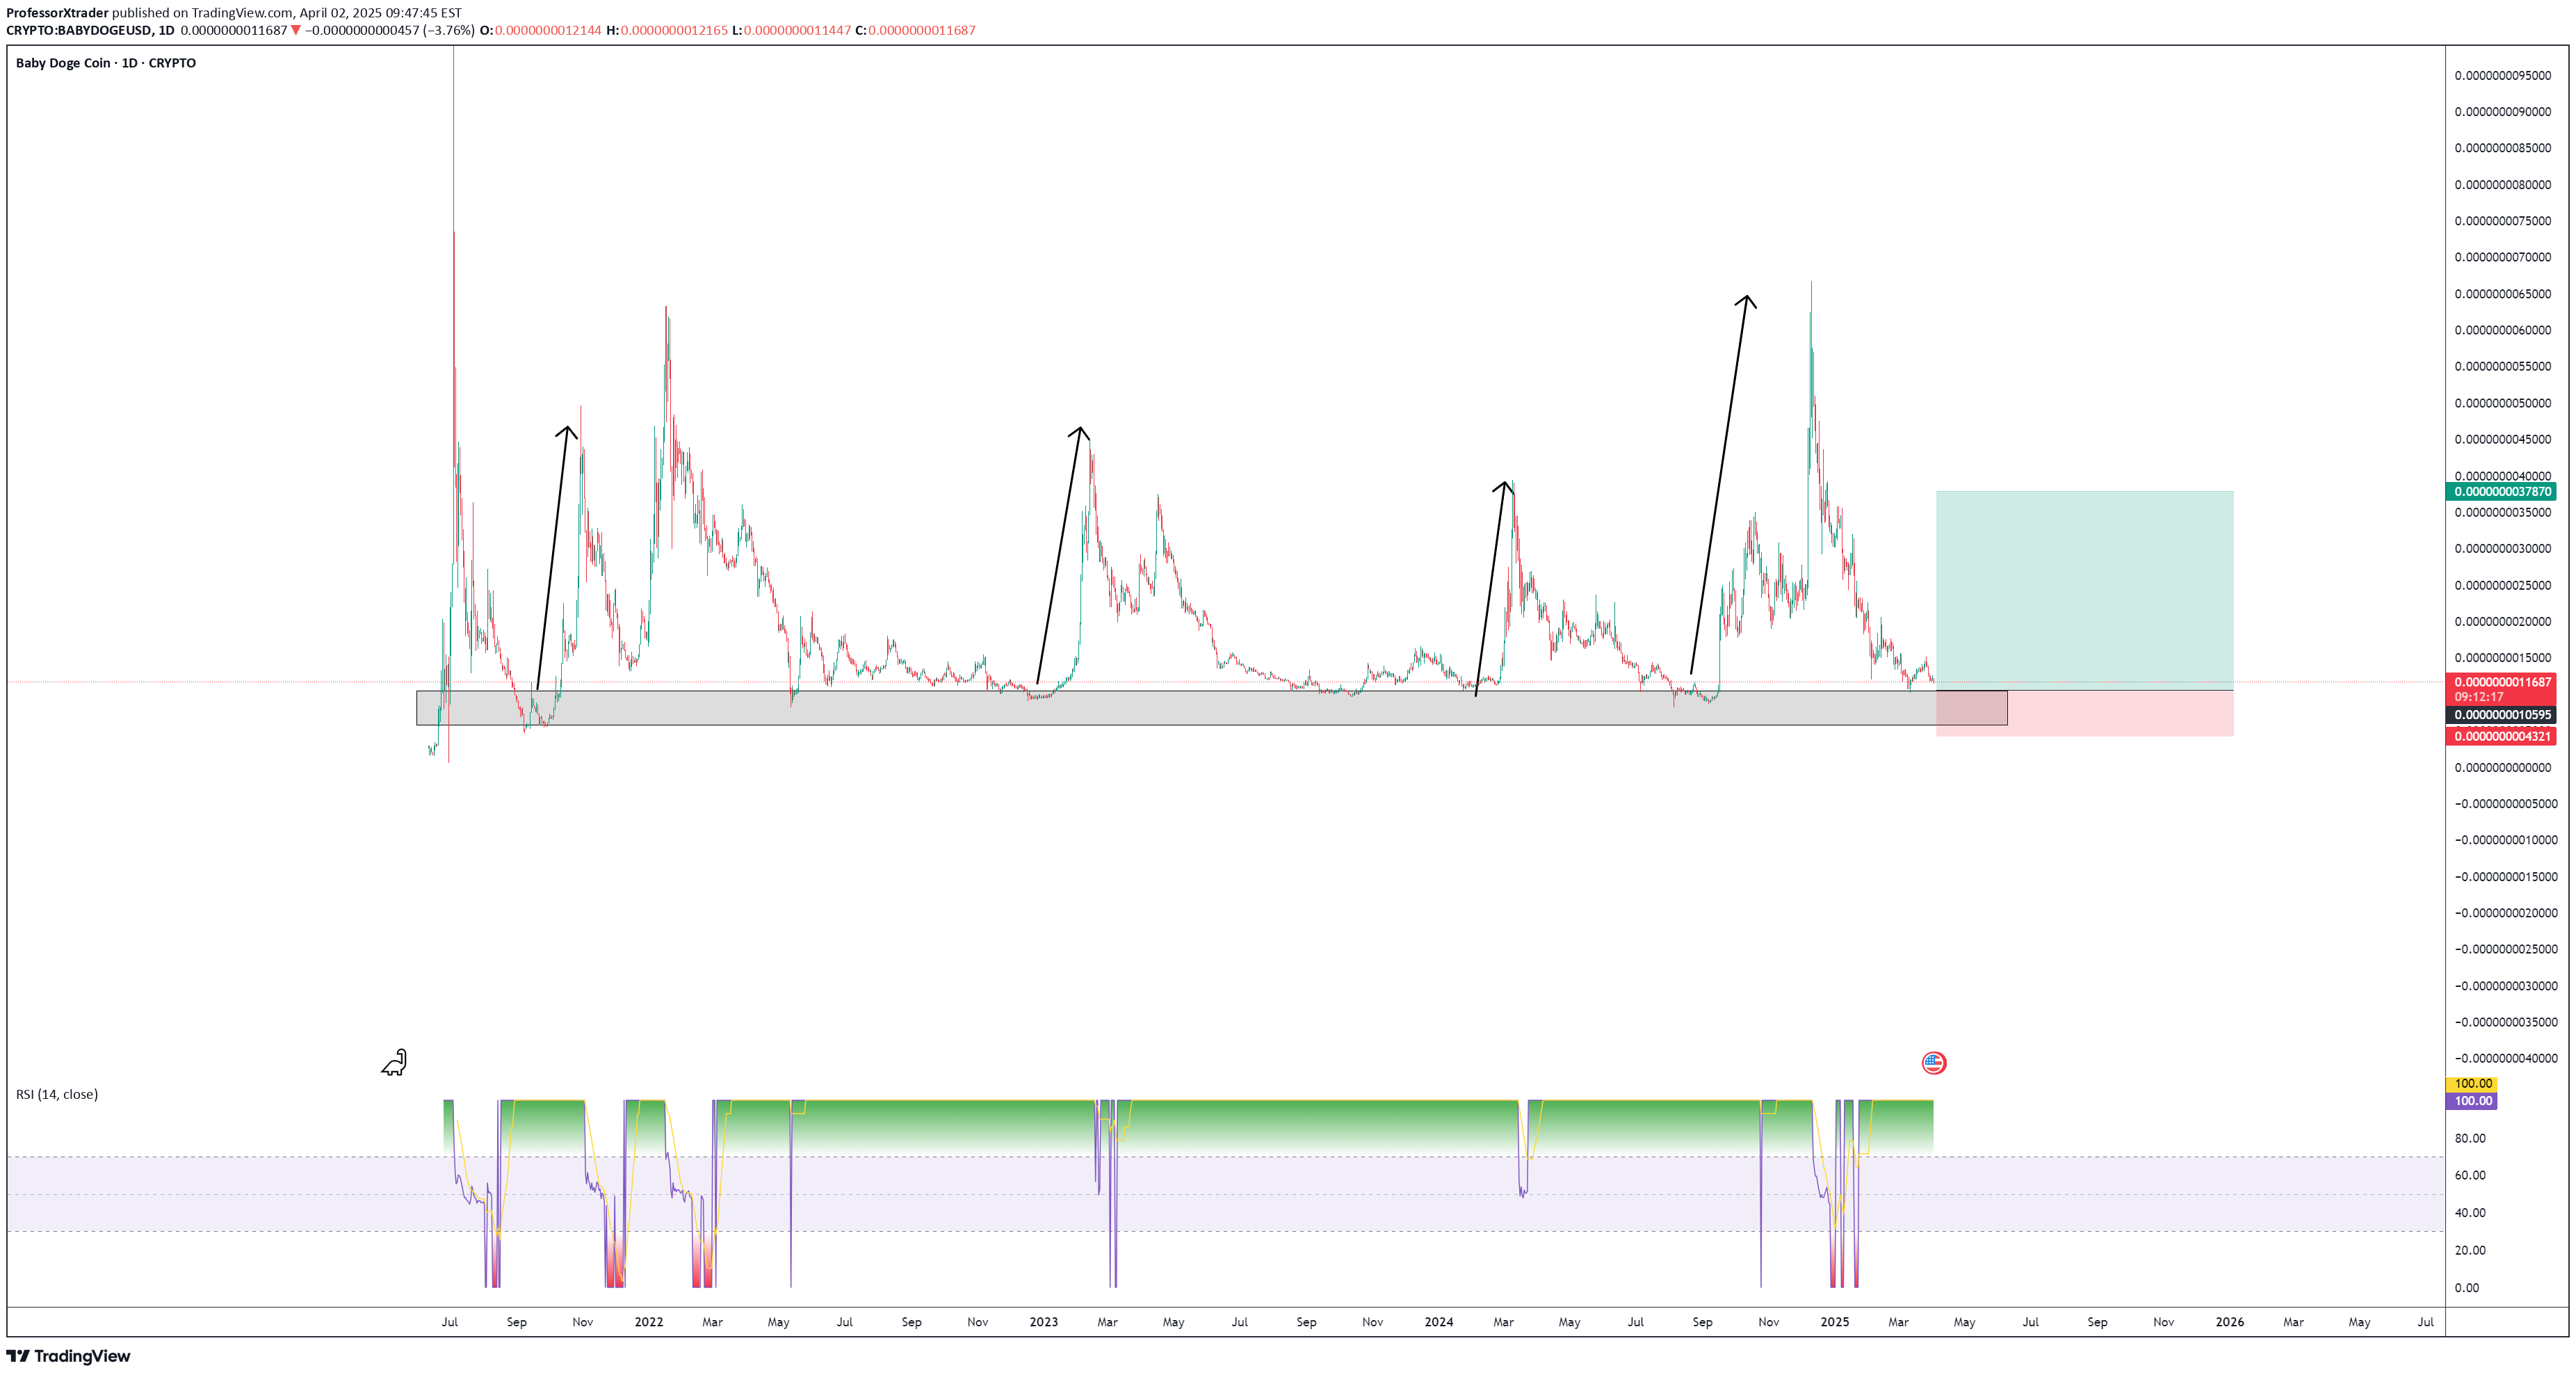
من موقعیت خرید در Babydoge باز کردم. هر بار که به سطح حمایتی میرسد، تقریباً ۳۰۰٪ سود میکند.
ProfessorXtrader
Btc long at cap
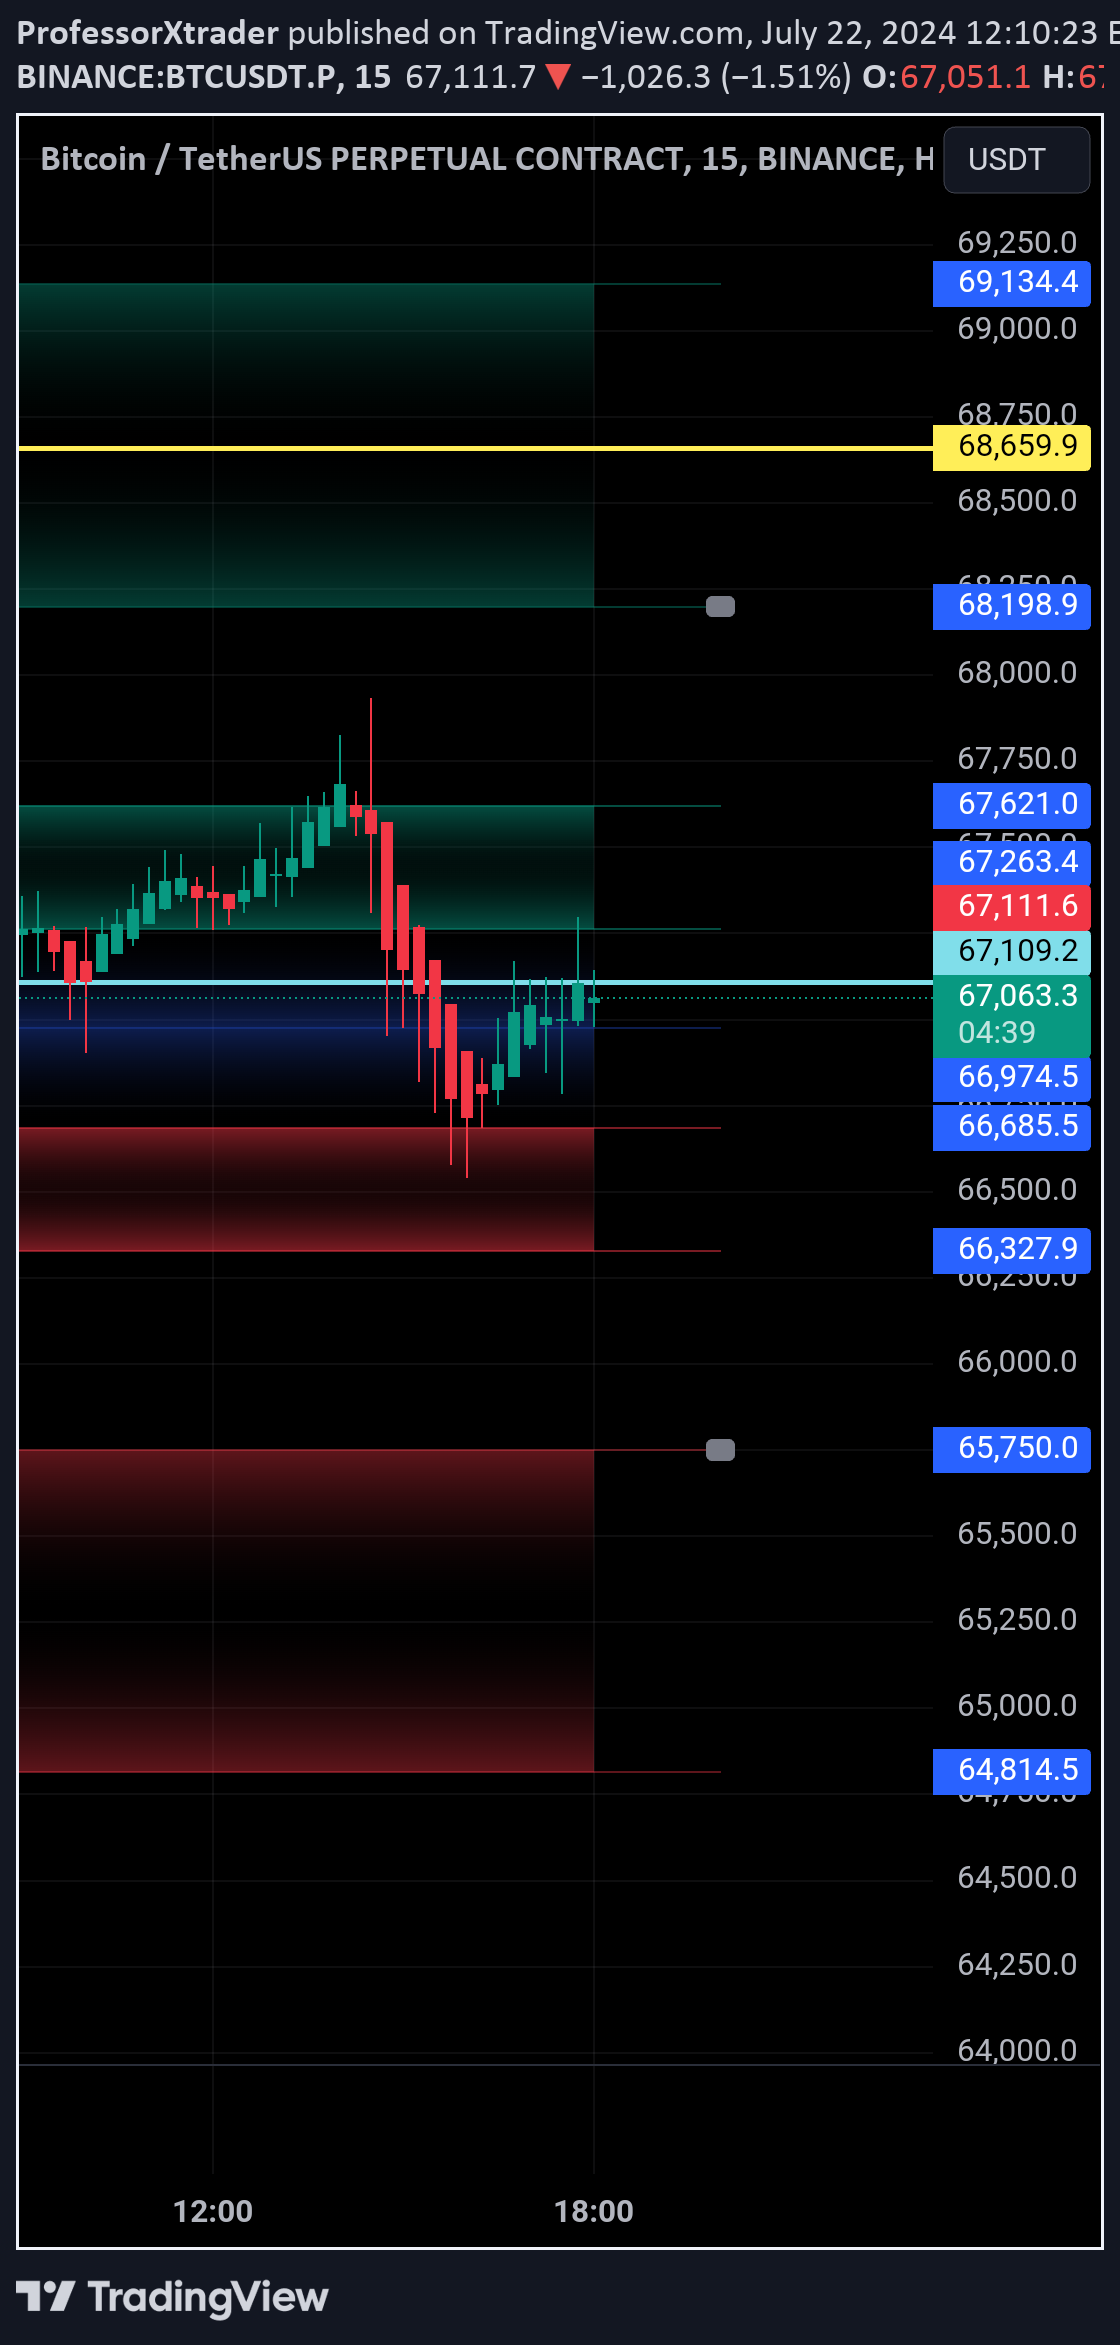
من برای شکار نقدینگی در 68700 طولانی btc ماند. من TARDE طولانی با اهرم 100 برابر باز هستم.
سلب مسئولیت
هر محتوا و مطالب مندرج در سایت و کانالهای رسمی ارتباطی سهمتو، جمعبندی نظرات و تحلیلهای شخصی و غیر تعهد آور بوده و هیچگونه توصیهای مبنی بر خرید، فروش، ورود و یا خروج از بازارهای مالی نمی باشد. همچنین کلیه اخبار و تحلیلهای مندرج در سایت و کانالها، صرفا بازنشر اطلاعات از منابع رسمی و غیر رسمی داخلی و خارجی است و بدیهی است استفاده کنندگان محتوای مذکور، مسئول پیگیری و حصول اطمینان از اصالت و درستی مطالب هستند. از این رو ضمن سلب مسئولیت اعلام میدارد مسئولیت هرنوع تصمیم گیری و اقدام و سود و زیان احتمالی در بازار سرمایه و ارز دیجیتال، با شخص معامله گر است.