
Mizar_trading
@t_Mizar_trading

تریدر چه نمادی را توصیه به خرید کرده؟
سابقه خرید
تخمین بازدهی ماه به ماه تریدر
پیام های تریدر
فیلتر
نوع پیام
3rd Pine Script Lesson: Open a command & send it to a Mizar Bot
Welcome back to our TradingView tutorial series! We have reached lesson number 3 where we will be learning how to open a command on TradingView and send it to a Mizar Bot. If you're new here and missed the first two lessons, we highly recommend starting there as they provide a solid foundation for understanding the concepts we'll be covering today. In the first lesson, you will be learning how to create a Bollinger Band indicator using Pine Script: In the second lesson, you will be guided through every step of coding the entry logic for your own Bollinger Band indicator using Pine Script: In this brief tutorial, we'll walk you through the process of utilizing your custom indicator, Mikilap, to determine the ideal timing for sending a standard JSON command to a Mizar DCA bot. By the end of this lesson, you'll have the ability to fine-tune your trading strategies directly on Mizar using indicators from TradingView. So, sit back, grab a cup of coffee (or tea), and let's get started! To establish a common starting point for everyone, please use the following code as a starting point. It incorporates the homework assignment from our Pine Script lesson number 2. By using this code as our foundation, we can collectively build upon it and delve into additional concepts together. So, sit back, grab a cup of coffee (or tea), and let's get started! // This source code is subject to the terms of the Mozilla Public License 2.0 at mozilla.org/MPL/2.0/ // Mizar Example Code - Lesson I - Coding an indicator // version 1.0 - April 2023 // Intellectual property © Mizar.com // Mizar-Killer-Long-Approach ("Mikilap") // version =5 // Indicator script initiation Pine Script® indicator(title = "Mizar-Killer-Long-Approach", shorttitle = "Mikilap", overlay = true, max_labels_count = 300) // Coin Pair with PREFIX // Bitcoin / USDT on Binance as example / standard value on an 60 minutes = 1 hour timeframe Pine Script® string symbol_full = input.symbol(defval = "BINANCE:BTCUSDT", title = "Select Pair:", group = "General") string time_frame = input.string(defval = "60", title = "Timeframe:", tooltip = "Value in minutes, so 1 hour = 60", group = "General") int length = input.int(defval = 21, title = "BB Length:", group = "Bollinger Band Setting") src = input(defval = close, title="BB Source:", group = "Bollinger Band Setting") float mult = input.float(defval = 2.0, title="BB Standard-Deviation:", group = "Bollinger Band Setting") float lower_dev = input.float(defval = 0.1, title = "BB Lower Deviation in %:", group = "Bollinger Band Setting") / 100 int length_rsi = input.int(defval = 12, title = "RSI Length:", group = "RSI Setting") src_rsi = input(defval = low, title="RSI Source;", group = "RSI Setting") int rsi_min = input.int(defval = 25, title = "", inline = "RSI band", group = "RSI Setting") int rsi_max = input.int(defval = 45, title = " < min RSI max > ", inline = "RSI band", group = "RSI Setting") Expand 7 lines // Defintion of a Pine Script individual function to handle the Request and avoid Repainting Errors Pine Script® Function_Mikilap(simple string coinpair, simple string tf_to_use) => int function_result = 0 bool barstate_info = barstate.isconfirmed open_R, high_R, low_R, close_R = request.security(coinpair, tf_to_use, [open, high, low, close]) // Bollinger part of MIKILAP Pine Script® src_cp = switch src open => open_R high => high_R low => low_R => close_R lower_band_cp = ta.sma(src_cp, length) - (mult * ta.stdev(src_cp, length)) lower_band_cp_devup = lower_band_cp + lower_band_cp * lower_dev lower_band_cp_devdown = lower_band_cp - lower_band_cp * lower_dev bool bb_entry = close_R < lower_band_cp_devup and close_R > lower_band_cp_devdown and barstate_info Expand 6 lines // RSI part of MIKILAP Pine Script® src_sb = switch src_rsi open => open_R high => high_R low => low_R => close_R rsi_val = ta.rsi(src_sb, length_rsi) bool rsi_entry = rsi_min < rsi_val and rsi_max > rsi_val and barstate_info Expand 4 lines // Check if all criteria are met Pine Script® if bb_entry[1] and rsi_entry[1] function_result += 1 if function_result == 1 and ticker.standard(syminfo.tickerid) == coinpair label LE_arrow = label.new(x = bar_index, y = low_R, text = "\n 🢁 \n LE", yloc = yloc.belowbar, color = color.rgb(255,255,255,25), style = label.style_none, textcolor = color.white, tooltip = str.tostring(open_R)) function_result Expand 3 lines // Calling the Mikilap function to start the calculation Pine Script® int indi_value = Function_Mikilap(symbol_full, time_frame) color bg_color = indi_value ? color.rgb(180,180,180,75) : color.rgb(25, 25, 25, 100) bgcolor(bg_color) // Output on the chart // plotting a band around the lower bandwith of a Bollinger Band for the active CoinPair on the chart Pine Script® lower_bb = ta.sma(src, length) - (mult * ta.stdev(src, length)) lower_bb_devup = lower_bb + lower_bb * lower_dev lower_bb_devdown = lower_bb - lower_bb * lower_dev upper = plot(lower_bb_devup, "BB Dev UP", color=#faffaf) lower = plot(lower_bb_devdown, "BB Dev DOWN", color=#faffaf) fill(upper, lower, title = "BB Dev Background", color=color.rgb(245, 245, 80, 80)) Expand 2 lines Open a command to send to a Mizar Bot. Let‘s continue coding Our target: Use our own indicator: Mikilap, to define the timing to send a standard JSON command to a Mizar DCA bot. (1) define the JSON command in a string, with variables for - API key - BOT id - BASE asset (coin to trade) (2) send the JSON command at the beginning of a new bar (3) setup the TradingView alert to transport our JSON command via Webhook/API to the Mizar DCA bot Below you can see the code, which defines the individual strings to prepare the JSON command. In the following, we will explain line by line, what each individual string and command is used for. // Defintion of a Pine Script individual function to handle the Request and avoid Repainting Errors Pine Script® Function_Mikilap(simple string coinpair, simple string tf_to_use) => int function_result = 0 bool barstate_info = barstate.isconfirmed open_R, high_R, low_R, close_R = request.security(coinpair, tf_to_use, ) //Text-strings for alerts via API / Webhook Pine Script® string api_key = "top secret" // API key from MIZAR account string symbol_prefix = str.replace(symbol_full, "BINANCE:", "", 0) string symbol_name = str.replace(symbol_prefix, "USDT", "", 0) string bot_id = "0000" // BOT id from MIZAR DCA bot // String with JSON command as defined in format from MIZAR.COM // BOT id, API key and the BASE asset are taken from separate variables DCA bot identifier: Pine Script® string api_key = "top secret" string bot_id = "0000" These both strings contain the info about your account (BOT owner) and the unique id of your bot, which should receive the JSON command. BASE asset: Pine Script® string symbol_prefix = str.replace(symbol_full, "BINANCE:", "", 0) string symbol_name = str.replace(symbol_prefix, "USDT", "", 0) The shortcut of the base asset will be taken out of the complete string for the coin pair by cutting out the CEX identifier and the quote asset. JSON command for opening a position: Pine Script® Entry_message = '{ "bot_id": "' + bot_id + '", "action": "' + "open-position" + '", "base_asset": "' + symbol_name + '", "quote_asset": "' + "USDT" + '", "api_key": "' + api_key + '" }' If you want to have more info about all possible JSON commands for a DCA bot, please look into Mizar‘s docs: docs.mizar.com/mizar/product/dca-bots/dca-bot-tradingview https://www.tradingview.com/x/OOS0KyY2 As the JSON syntax requires quotation marks (“) as part of the command, we define the string for the entry message with single quotations ('). So please ensure to open and close these quotations before or after each operator (=, +, …). Current status: - We have the entry logic and show every possible entry on the chart => label. - We have the JSON command ready in a combined string (Entry_message) including the BOT identifier (API key and BOT id) as well as the coin pair to buy. What is missing? - To send this message at the opening of a new bar as soon as the entry logic is true. As we know these moments already, because we are placing a label on the chart, we can use this condition for the label to send the message as well. alert(): built-in function - We recommend checking the syntax and parameters for alert() in the Pine Script Reference Manual. As we want to send only one opening command, we are using the alert.freq_once_per_bar. To prepare for more complex Pine Scripts, we have placed the alert() in a separate local scope of an if condition, which is not really needed in this script as of now. Pine Script® if bb_entry[1] and rsi_entry[1] function_result += 1 if function_result == 1 alert(Entry_message, alert.freq_once_per_bar) if function_result == 1 and ticker.standard(syminfo.tickerid) == coinpair label LE_arrow = label.new(x = bar_index, y = low_R, text = "\n 🢁 \n LE", yloc = yloc.belowbar, color = color.rgb(255,255,255,25), style = label.style_none, textcolor = color.white, tooltip = str.tostring(open_R)) Expand 5 lines IMPORTANT REMARK: Do not use this indicator for real trades! This example is for educational purposes only! Configuration of the TradingView alert: on the top right of the chart screen, you will find the clock, which represents the alert section a) click on the clock to open the alert section b) click on the „+“ to create a new alert https://www.tradingview.com/x/z1krDu3h c) set the condition to our indicator Mikilap and the menu will change its format (configuration of the TradingView alert) https://www.tradingview.com/x/WvWMXtcg For our script nothing else is to do (you may change the expiration date and alert name), except to add the Webhook address in the Notification tab. https://www.tradingview.com/x/U3ZZICzO Webhook URL: api.mizar.com/api/v1/dca-bots/trading-view/execute-command https://www.tradingview.com/x/qzdQzskC Congratulations on finishing the third lesson on TradingView - we hope you found it informative and engaging! You are now able to code a well-working easy Pine Script indicator, which will send signals and opening commands to your Mizar DCA bot. We're committed to providing you with valuable insights and practical knowledge throughout this tutorial series. So, we'd love to hear from you! Please leave a comment below with your suggestions on what you'd like us to focus on in the next lesson. Thanks for joining us on this learning journey, and we're excited to continue exploring TradingView with you!
2nd Pine Script Lesson: Coding the Entry Logic - Bollinger Band

خوش آمدید دوباره به مجموعه آموزشی Trading View ما! در این درس دوم، یاد گرفت که چگونه منطق ورود برای یک اندیکاتور Bollinger Band را با استفاده از Pine Script کدنویسی کنید. اگر تازه وارد هستید و درس اول را از دست داده اید، ما اکیداً توصیه می کنیم از آنجا شروع کنید زیرا یک پایه محکم برای درک مفاهیمی که امروز پوشش داد فراهم می کند: در این درس عملی، شما را در هر مرحله از کدنویسی منطق ورود برای اندیکاتور Bollinger Band خودتان با استفاده از Pine Script راهنمایی می کنیم. در پایان این درس، یک اندیکاتور کاربردی داشت که می توانید از آن برای اطلاع رسانی به تصمیمات معاملاتی خود استفاده کنید. پس بنشینید، یک فنجان قهوه بردارید و شروع کنیم! کدنویسی منطق ورود a) در اینجا ما تابع Mikilap را با دو آرگومان فراخوانی می کنیم: - جفت ارز و - بازه زمانی که می استفاده کنیم. // فراخوانی تابع Mikilap برای شروع محاسبات Pine Script® b) در آغاز تابع، رشته ها را به رشته های ساده تبدیل می کنیم. // تعریف یک تابع منفرد Pine Script برای رسیدگی به Request و جلوگیری از خطاهای Repainting Pine Script® c) از آنجایی که ما تابع را برای دریافت یک مقدار صحیح فراخوانی می کنیم، باید یک متغیر خروجی را به عنوان یک عدد صحیح تعریف کنیم و این متغیر را به عنوان آخرین خط در دامنه محلی کد تابع قرار دهیم تا مقدار صحیح را برگردانیم. Pine Script® مرحله 1: با استفاده از باند پایین Bollinger Band بر اساس SMA (close, 21) و انحراف معیار 2.0 سعی کنید میله هایی را برجسته کنید، جایی که close نزدیک به باند پایین باشد a) درخواست مقادیر برای جفت ارز با request.security() Pine Script® ما توصیه می کنیم از توابع repainting مانند request یا barstate فقط در یک دامنه محلی (درون یک تابع) استفاده کنید و request مقادیر محاسبه شده پیچیده را انجام ندهید. برای صرفه جویی در ظرفیت محاسبه، مفید است که فقط چهار OHLC کلاسیک را request و پس از request.security() هر گونه محاسبه ای را با این چهار انجام دهید. b) محاسبه مقادیر پایین Bollinger Bands همانطور که ما به اطلاعات جهانی نیاز داریم، اینکه چه نوع منبع، طول و مقدار انحراف برای محاسبه استفاده شود، بیایید ورودی برای Bollinger Band را در بخش شروع عمومی کد برش داده و جایگذاری کنیم و همانطور که می به دنبال مقادیر close "نزدیک" به پهنای باند پایین باشیم، باید تعریف کنیم که "نزدیک" به چه معناست. بیایید آن را در یک متغیر ورودی دیگر انجام دهیم، شاید بخواهیم بعداً با این تعریف بازی کنیم. Pine Script® ابتدا، بیایید با بازنویسی Bollinger Bandplot، که دیگر نیازی نیست، آن را روی نمودار قابل مشاهده کنیم. // فراخوانی تابع Mikilap برای شروع محاسبات Pine Script® // خروجی روی نمودار // قسمت 2 - رسم Band در اطراف پهنای باند پایین Bollinger Band برای CoinPair فعال روی نمودار Pine Script® c) اکنون ما از همان محاسبه برای جفت ارز در داخل تابع استفاده می کنیم و با انتخاب منبع (OHLC) برای استفاده، که در متغیر ورودی مربوطه فعال است، شروع می کنیم. // تعریف یک تابع منفرد Pine Script برای رسیدگی به Request و جلوگیری از خطاهای Repainting Pine Script® d) از آنجایی که پهنای باند برای مقادیر close جالب توسط باند ما تعریف شده است، تنها چیزی که برای قسمت Bollinger Band در اندیکاتور Mikilap ما کم است این است که بررسی کنیم آیا مقدار close یک bar در داخل band ما است یا خیر. از آنجایی که ما در مورد میله های بسته شده صحبت می کنیم، مطمئن شوید که واقعاً بسته شده است با استفاده از barstate.isconfirmed (تابع داخلی repainting!) و آن را در یک متغیر در سر تابع ذخیره کنید تا از درخواست مکرر این اطلاعات جلوگیری شود. Pine Script® اکنون بیایید بررسی کنیم که آیا مقدار close یک bar در داخل band ما است یا خیر. Pine Script® و در صورتی که مقدار close در داخل باشد، متغیر خروجی را 1 افزایش دهید. Pine Script® با استفاده از bb_entry[1]، ما به bar آخر در کنار میله فعلی اشاره می کنیم، زیرا می در باز شدن bar پس از برآورده شدن معیارها وارد شویم. e) و برای اینکه این ورودی های احتمالی قابل مشاهده باشند، می یک برچسب در زیر bar قرار دهیم و قیمت ورودی (= مقدار باز bar) را به عنوان mouseover (توضیحات ابزار) نشان دهیم. این فقط باید در صورتی اتفاق بیفتد که coinpair فعال روی نمودار همان coinpair باشد که در محاسبه تابع است. Pine Script® نکته: شما برچسب ها را دوست داشت (!) و در صورتی که به دنبال نمادهای متنی هستید که می توانند به عنوان برچسب استفاده شوند، اینجا را ببینید: messletters.com/en/symbols/ اگر به کمک نیاز دارید از راهنمای مرجع Pine Script استفاده کنید، که 99٪ از همه چیز را در Pine Script توضیح می دهد، اینجا: tradingview.com/pine-script-reference/v5/ f) از آنجایی که تابع ما اکنون مقادیر صحیح مختلفی (0 یا 1) را برمی گرداند، می توانیم از این اطلاعات برای رنگ آمیزی پس زمینه نمودار فعلی در صورت وجود 1 استفاده کنیم. // فراخوانی تابع Mikilap برای شروع محاسبات Pine Script® g) برای به پایان رساندن این درس کوچک Pine Script و دستیابی به اهداف اولیه خود، فقط باید اندیکاتور دوم (RSI) را در تابع ادغام کنیم. ما می از RSI برای 0.5 روز (12 ساعت) استفاده کنیم و از آن برای اطمینان از عدم ورود به یک ورودی طولانی در یک بازار اشباع فروش (< 25) یا اشباع خرید (> 70) استفاده کنیم. ما از RSI (low, 12) در محدوده 25 تا 45 استفاده کرد. وظایف شما: متغیرهای ورودی جدیدی برای RSI تعریف کنید: src_rsi و length_rsi متغیرهای ورودی جدیدی برای محدوده RSI که می استفاده کنیم تعریف کنید: rsi_min و rsi_max (لطفاً از قالب "inline" یک نوع ورودی استفاده کنید) RSI (src_rsi, length_rsi) را در داخل تابع Mikilap خود محاسبه کنید یک متغیر بولی (rsi_entry) تعریف کنید تا بررسی کند که آیا مقدار RSI محاسبه شده در داخل محدوده است (لطفاً به عنوان آخرین بررسی barstate_info را اضافه کنید) بررسی ورودی RSI را به بررسی ورودی Bollinger Band اضافه کنید تا آنها را ترکیب کنید تبریک می گوییم برای اتمام درس دوم در Trading View - امیدواریم آن را آموزنده و جذاب یافته باشید! ما متعهد هستیم که بینش های ارزشمند و دانش عملی را در طول این مجموعه آموزشی در اختیار شما قرار دهیم. بنابراین، دوست داریم از شما بشنویم! لطفاً در زیر نظر خود را با پیشنهادات خود در مورد اینکه می در درس بعدی روی چه چیزی تمرکز کنیم، بگذارید. از اینکه در این سفر یادگیری به ما پیوستید متشکریم، و ما هیجان زده هستیم که به کاوش در Trading View با شما ادامه دهیم!
1st Pine Script Lesson: Coding an Indicator - Bollinger Band

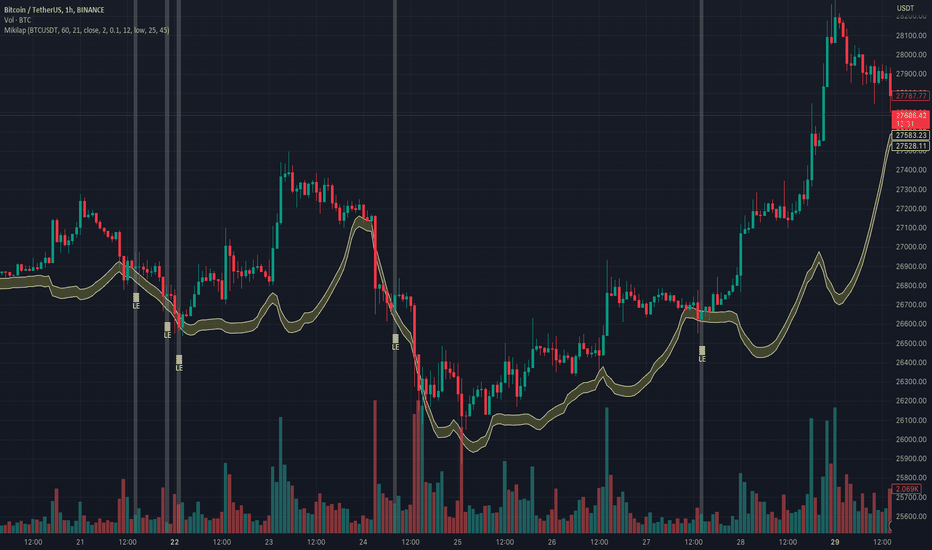
1st Pine Script Lesson: Coding an Indicator - Bollinger Band Welcome to this lesson on Trading View, where we will be learning how to create a Bollinger Band indicator using Pine Script. Bollinger Bands are a popular tool that helps measure a security's volatility and identify potential trends in price movement. Essentially, the indicator consists of three lines: a middle line that's a simple moving average (SMA), and an upper and lower band that are two standard deviations away from the SMA. The upper band represents the overbought level, meaning the price of the security is considered high and may be due for a correction. The lower band represents the oversold level, meaning the price is considered low and may be due for a rebound. Pine Script is a programming language specifically used for creating custom indicators and strategies on Trading View. It's a powerful tool that allows traders to customize their technical analysis to fit their special trading needs and gain deeper insights into the markets.. In this lesson, we'll be taking a hands-on approach to learning. We'll walk through each step of creating our own Bollinger Band indicator using Pine Script, with the goal of helping you gain confidence in your ability to customize and create indicators that meet your unique trading needs. So, grab a cup of coffee and let's get started! Step 1: Set up a new chart Let‘s set up a new clean chart to work with for this example. You will find the menu to manage your layouts on the top right of the TradingView screen. a) add a new layout b) rename it to „Mizar Example“ c) select BTCUSDT from Binance d) set the time frame to 1 hour e) clean the screen (closing the Volume indicator) f) save it Step 2: Coding an indicator Let‘s code our new indicator („Mizar-Killer-Long-Approach“)and make the possible entry moments visible on the chart. You will find the Pine Editor on the bottom left of the TradingView screen. a) open the Pine Editor b) use „Open“ in the Pine Editor menu bar c) use the item: create a new indicator d) let‘s use full screen for a better overview use the three dots on the right end of the Pine Editor menu bar and open the script in a separate new browser tab e) rename it to “Mikilap“ by clicking on the current name f) save it Step 3: Coding an indicator Let‘s start coding Our target: 1. create an own new indicator: Mikilap, which bases in general on RSI and Bollinger Band 2. define the parameter for Mikilap, to select the long entries 3. show the long entries on the chart by - putting a label below the bar - change the background color of the timeframe for the bar on the chart Initiation/Generals • Indicator initiation //Indicator script initiation indicator(title = "Mizar-Killer-Long-Approach", shorttitle = "Mikilap", overlay = true, max_labels_count = 300) indicator = Pine keyword for an indicator script title = Long form of the name short title = Short form of the name as shown on the chart overlay = true: output like labels, boxes, … are shown on the chart false: output like plots, … are shown in a separate pane • General variables and input // Coin Pair with PREFIX // Bitcoin / USDT on Binance as an example / standard value on an 60 minutes = 1-hour timeframe string symbol_full = input.symbol(defval = "BINANCE:BTCUSDT", title = "Select Pair:", group = "General") string time_frame = input.string(defval = "60", title = "Timeframe:", tooltip = "Value in minutes, so 1 hour = 60", group = "General") Using the input type of a variable allows you to change this setting in the setup on the chart without changing the Pine Script code. Framework Code on Main Level • Framework code on the main level around the indicator calculation function // Defintion of a Pine Script individual function to handle the Request and avoid Repainting Errors Function_Mikilap(simple string coinpair, simple string tf_to_use) => int function_result = 0 // placeholder for indicator calculations function_result // Calling the Milky Way function to start the calculation int indi_value = Function_Mikilap(symbol_full, time_frame) Output on the chart - Part 1 // Output on the chart // Part 1 - plotting a Bollinger Band for the active CoinPair on the chart int length = input.int(defval = 21, title = "BB Length:", group = "Bollinger Band Setting") src = input(defval = close, title="BB Source", group = "Bollinger Band Setting") float mult = input.float(defval = 2.0, title="BB Standard-Deviation", group = "Bollinger Band Setting") upper_band = ta.sma(src, length) + (mult * ta.stdev(src, length)) lower_band = ta.sma(src, length) - (mult * ta.stdev(src, length)) upper = plot(upper_band, "BB Upper", color=#faffaf) lower = plot(lower_band, "BB Lower", color=#faffaf) fill(upper, lower, title = "BB Background", color=color.rgb(245, 245, 80, 80)) Done for today! • Let‘s save our current script and take a look if we see our Bollinger Band plotted on the chart. • Step 1: Save (top right) • Step 2: check in the compiling section, that there are no errors (separate pane below the code) • Step 3: go to the Mizar Example chart and add an Indicator How does it look now? You will see the Bollinger Band as a yellow area around the candles. By pressing the „Settings“ button behind the name of our indicator, the menu for Mikilap will open and you can adjust all the settings we have done with input type variables. Congrats if you‘ve made it until here! Get prepared for the next lesson, where we will continue with the indicator/entry logic.
سلب مسئولیت
هر محتوا و مطالب مندرج در سایت و کانالهای رسمی ارتباطی سهمتو، جمعبندی نظرات و تحلیلهای شخصی و غیر تعهد آور بوده و هیچگونه توصیهای مبنی بر خرید، فروش، ورود و یا خروج از بازارهای مالی نمی باشد. همچنین کلیه اخبار و تحلیلهای مندرج در سایت و کانالها، صرفا بازنشر اطلاعات از منابع رسمی و غیر رسمی داخلی و خارجی است و بدیهی است استفاده کنندگان محتوای مذکور، مسئول پیگیری و حصول اطمینان از اصالت و درستی مطالب هستند. از این رو ضمن سلب مسئولیت اعلام میدارد مسئولیت هرنوع تصمیم گیری و اقدام و سود و زیان احتمالی در بازار سرمایه و ارز دیجیتال، با شخص معامله گر است.