Lanmar
@t_Lanmar

تریدر چه نمادی را توصیه به خرید کرده؟
سابقه خرید
تخمین بازدهی ماه به ماه تریدر
پیام های تریدر
فیلتر
نوع پیام
Lanmar
ETH holding key levels: I am long
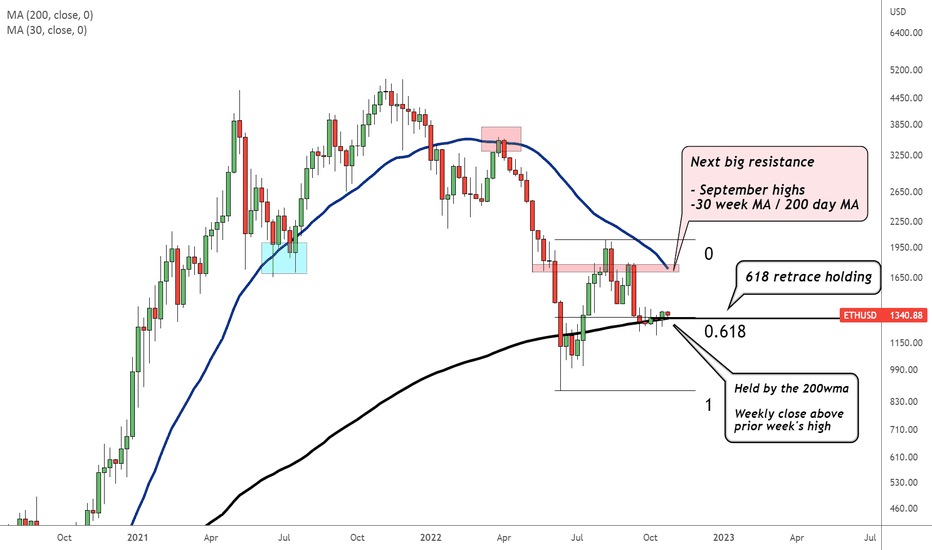
فکر کنید بسیاری از معامله گران رمزنگاری در سمت طولانی تحت موقعیت قرار نمی گیرند. * مدت میان مدت* روند نزولی دست نخورده باقی مانده است ، اما فکر می کنیم حداقل در این سطوح حداقل به مقاومت کلید بعدی می بینیم. بازی ریسک پایین تر این است که منتظر تأیید بیشتر در حجم بالا باشید. من اینجا هستم ETH ماهانه - با نگاه به ETH از نمای چشم پرنده ، هنوز هم در بالای سطح بسته های هفتگی سال 2018 و 50 ماه SMA شرکت می کند: ETHBTC - من تا زمانی که بالاتر از این سطح باشد ، برای ETH اولویت دارم: مارا به طور بالقوه front در حال اجرا رمزنگاری است: تنظیم سکه برای H&S/Squeeze شکست خورده (هنوز هم در یک روند نزولی بسیار قوی اما اگر H&S شکست بخورد ، می توانیم فشار بیشتری را ببینیم): S&P 500 MA 200 هفته را برگزار کرد و روزانه می چرخد. این می تواند یک سیگنال برای اشتهای ریسک کوتاه مدت باشد: هدف یک در اینجا (نقطه تر و تمیز): ETHBTC:
Lanmar
The Bitcoin Cycle: A guide to time the next major entry
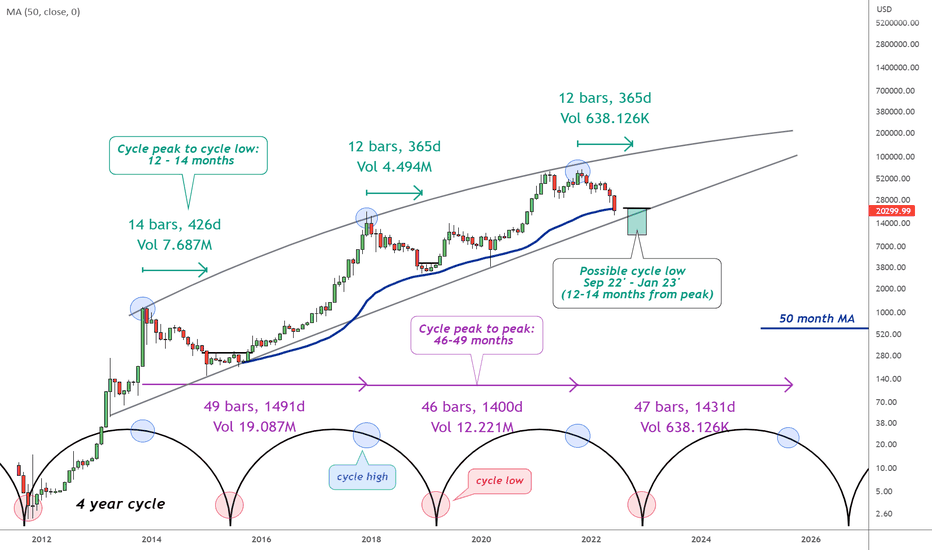
Bitcoin می تواند در 3-9 ماه آینده به یک چرخه پایین نزدیک شود. با بزرگنمایی در نمودار هفتگی ، دید که قیمت تمایل به ایجاد مقاومت به صورت افقی * پس از * ضربه زدن به چرخه کم و تلفیقی دارد. هنگامی که قیمت از آن مقاومت خارج شد ، باعث ایجاد سیگنال خرید می شود. این نوع عملی است که می ببینم برای طولانی شدن با اندازه. با موضوع چرخه ها ، من از پاراگراف اولین کتابی که خوانده ام استفاده می کنم که من را به بازارهای مالی علاقه مند کرد. از چرخه ها: نیروهای مرموز که باعث وقوع حوادث می شوند چگونه می توان در هر نمونه مشخص ، خواه a گفت یا نه ریتم منظم که فرد کشف می کند ناشی از یک اساسی واقعی است زور یا صرفاً به طور اتفاقی؟ بیایید با یک عقل سلیم شروع کنیم و منطق ساده اگر یک چرخه بارهای کافی را تکرار کرده است ، با منظم و با قدرت کافی ، احتمال وجود دارد قابل توجه است چنین منظم نمی تواند به طور منطقی تصادف کند. خط پایین: قابلیت اطمینان یک چرخه بر اساس چگونگی تکرار آن چرخه در گذشته است. من فرض می کنم چرخه موجود در این پست همچنان در بازی باقی مانده است و از آن به عنوان راهنمای من برای کمک به زمان بعدی major استفاده می کنم. نکته اصلی این است که بر اساس یک سیگنال وارد شوید نه خرید فقط به این دلیل که قیمت در محدوده پایین چرخه است. این چرخه فقط به وزن شواهد می افزاید و به زمان بندی کمک می کند - این سیگنال نیست. در دو بازار خرس قبلی (2014 - 2015 و 2018 - 2019) پایتخت در قیمت سال بعد وجود داشت که منجر به کمبود چرخه شد. قیمت برای تکرار تنظیم می شود زیرا ما در سپتامبر 2022 به سال 2023 می رویم. این بار متفاوت است این است که محکم در زیر 200 هفته کارشناسی ارشد معامله می شود که باعث می شود یک رویداد از نوع کاپیتولاسیون در 4 ماه آینده بیشتر باشد. برای باطل کردن قیمت باید بالاتر از 25K بسته شود. در حال حاضر ، از صبر و شکیبایی استفاده کنید و برای قیمت های پایین تر برنامه ریزی کنید زیرا ما به این نوع Zonecapitulation می پردازیم که بر اساس عملکرد فعلی قیمت ، برنامه را به نظر می رسد. پشتیبانی زیادی در سال 18500 اما احتمالاً شکست می خورد. خط بالقوه در sand red Linewe're در حدود نیمی از چرخه در اینجا است ، فقط به موقع برای تأیید ETF هفته گذشته. تصحیح در زمان و/یا قیمت احتمالاً در Q1 2024 است. اگر اصلاح بیشتر با زمان باشد (قیمت تلفیقی در محدوده محکم بین 45k - 39k) ، پس اصلاح عمیق تر در قیمت ممکن است در Q2 دنبال شود. تصحیح در زمان: EMA 10 ماهه با افزایش تقاضا در جایی بین 39K یا بالاتر ادامه می یابد. تصحیح در قیمت: آزمایش مجدد 35 کیلو پوند در سطح بالا ، یا آزمایش عمیق 30-32K در انتهای پایین (در حال حاضر کمتر). ترکیبی از هر دو برای شارژ صحیح آن ایده آل است
سلب مسئولیت
هر محتوا و مطالب مندرج در سایت و کانالهای رسمی ارتباطی سهمتو، جمعبندی نظرات و تحلیلهای شخصی و غیر تعهد آور بوده و هیچگونه توصیهای مبنی بر خرید، فروش، ورود و یا خروج از بازارهای مالی نمی باشد. همچنین کلیه اخبار و تحلیلهای مندرج در سایت و کانالها، صرفا بازنشر اطلاعات از منابع رسمی و غیر رسمی داخلی و خارجی است و بدیهی است استفاده کنندگان محتوای مذکور، مسئول پیگیری و حصول اطمینان از اصالت و درستی مطالب هستند. از این رو ضمن سلب مسئولیت اعلام میدارد مسئولیت هرنوع تصمیم گیری و اقدام و سود و زیان احتمالی در بازار سرمایه و ارز دیجیتال، با شخص معامله گر است.