
David_Perk
@t_David_Perk

تریدر چه نمادی را توصیه به خرید کرده؟
سابقه خرید
تخمین بازدهی ماه به ماه تریدر
پیام های تریدر
فیلتر
نوع سیگنال
David_Perk

دامنه هفتگی دستکاری شده در داخل معامله شد تا فروشندگان را القا کند آنها را متوقف کرد OB ایجاد شده است مجدداً کوتاه آماده است در اینجا افراد زیادی وجود دارند که به قمار معتاد هستند اما آنها نمی آن را بپذیرند - بنابراین آنها خود را معامله گر می نامند زیرا به نظر می رسد بسیار بهتر و مولد از معتاد به بازی های کازینو یا شرط بندی های ورزشی است اطمینان حاصل کنید که به دلایل مناسب تجارت می کنید شما باید به خود و آنچه انجام می دهید نگاه کنید تجارت با مسئولیت پذیری دیوید پرک
David_Perk

قیمت در سطح کلید IFVG است دامنه دستکاری شده. CIOF ایجاد شده است من کوتاه شدم و در محدوده بازپرداخت اضافه می کنم دلیل سازگاری بیشتر معامله گران این است که اگر در صورت عدم حضور در مجموعه ای وجود نداشته باشد ، می هر روز تجارت کنند و بی تاب شوند. این را در نظر بگیرید: شما این شانس را دارید که مجبور شوید برای شخص دیگری کار نکنید. آیا این کافی نیست که شما نظم و انضباط داشته باشید؟ بیرون ماندن نیز تصمیم است موفق باشید دیوید پرک
David_Perk

سلام بچه ها چه خبر ، امروز ما قصد داریم بلوک سفارش را تجزیه کنیم. این الگوی قدرتمند می تواند به عنوان سطح و همچنین به عنوان تأیید ورود به بازه زمانی پایین استفاده شود. ما هر دو را تجزیه کرد. بلوک سفارش آخرین شمع صعودی یا نزولی قبل از یک بازار قوی است move که سیگنال هایی که در آن موسسات سفارشات بزرگی را قرار می دهند ، اغلب به عنوان پشتیبانی یا مقاومت در آینده عمل می کنند. بله ، اساساً منطقه تقاضای آن است ، و اغلب هنگام استفاده از پروفایل بازار با POC در هم تلاشی بود. هر بلوک سفارش احتمال بالایی ندارد. برای فیلتر کردن بهترین سطوح بلوک سفارش من باید این دو شرط را برآورده کند: 1. واقع در سطح حق بیمه / تخفیف همانطور که می توانیم در نمودارهای زیر بلوک سفارش که شکست خورده است ، موردی باشد که دارای گسترش است ، اما به نقدینگی مناسب نیست و در تخفیف قرار نمی گیرد. و این چیزی است که باعث ضعیف شدن آن می شود زیرا موسسات برای خرید نیاز به نقدینگی دارند و آنها این کار را با قیمت های حق بیمه انجام نمی دهند. بنابراین هیچ حمله نقدینگی - تجارت و همچنین باید در تخفیف باشد. 2. باید FVG یا IFVG داشته باشد به منظور move بازار و ایجاد خلاء نقدینگی - شکاف. شما به پول بسیار زیادی احتیاج دارید. فقط بازیکنان بزرگ می توانند این کار را انجام دهند. بنابراین اگر شکاف وجود نداشته باشد ، نشانه های آن مبنی بر اینکه آنها تجارت نمی کنند و شما نیز نباید باشید. اگر شکاف در OB وجود داشته باشد ، یکی از آنها قوی بود. همانطور که گفته شد ما می توانیم از بلوک سفارش به عنوان سطح کلیدی استفاده کنیم که از آن می توانیم تجارت کنیم یا می توانیم از آن به عنوان تأیید ورود استفاده کنیم - تغییر در ترتیب flow. ما از آن در بازه زمانی پایین استفاده می کنیم. در اینجا ترازهای بازه زمانی صحیح است ماهانه OB به عنوان سطح کلید - ورود به بلوک سفارش روزانه هفتگی OB به عنوان سطح کلید - ورود بلوک سفارش H4 روزانه OB به عنوان سطح کلید - ورود بلوک سفارش H1 H4 OB به عنوان سطح کلید - M 15 ورود به بلوک سفارش ورودی ساده است که شما نیاز دارید - بازگشت به تخفیف - سطح کلید HTF - LTF OB ایجاد شده است پس از بسته شدن شمع ها / شمع نزدیک / بالا یا شمع های متوالی ، به موقعیت خود وارد می شوید. در زیر چند نمونه از تماس های موفق من قبل از واقعیت آورده شده است. بدون عقب نشینی ، کارش. Bitcoin - ورود به بلوک سفارش Bitcoin - سفارش ورود به بلوک Dogecoin - سفارش ورود به بلوک Palantir - ورود به نقطه میانی بلوک سفارش شاخص دلار - ورود به بلوک سفارش دریغ نکنید که هر سؤالی را رها کنید. من همیشه خوشحالم که جواب می دهم برای پست های بیشتر وبلاگ های آموزشی من را دنبال کنید. دیوید پرک
David_Perk

دامنه روزانه دستکاری شده سفارش نزولی flow OB آفریده شده TP 1 - 50 ٪ محدوده کامل TP کم .... من در David Perktp 1 Donefull tp انجام شد
David_Perk

دامنه روزانه دستکاری شد و فروشندگان را به بازار کشاند. حالا می تواند برخلاف آنها تا اوج قیمت های روز قبل حرکت کند. این موقعیت تمام معیارهای احتمالی را که من در نظر دارم برآورده می کند و من وارد معامله شده ام. موفق باشید دیوید پرک
David_Perk

دستکاری هفتگی محدوده تا سطح کلیدی انجام شد. رد شد و بلاک سفارش (OB) ایجاد شد. بازآزمایی بلاک سفارش (OB) به داخل شکاف ارزش منصفانه (IFVG) و ناحیه 61.8 درصد. اکنون آماده رفتن به سقف محدوده است. شکاف ارزش منصفانه (IFVG) به عنوان حمایت عمل میکند. موفق باشید دیوید پرک
David_Perk
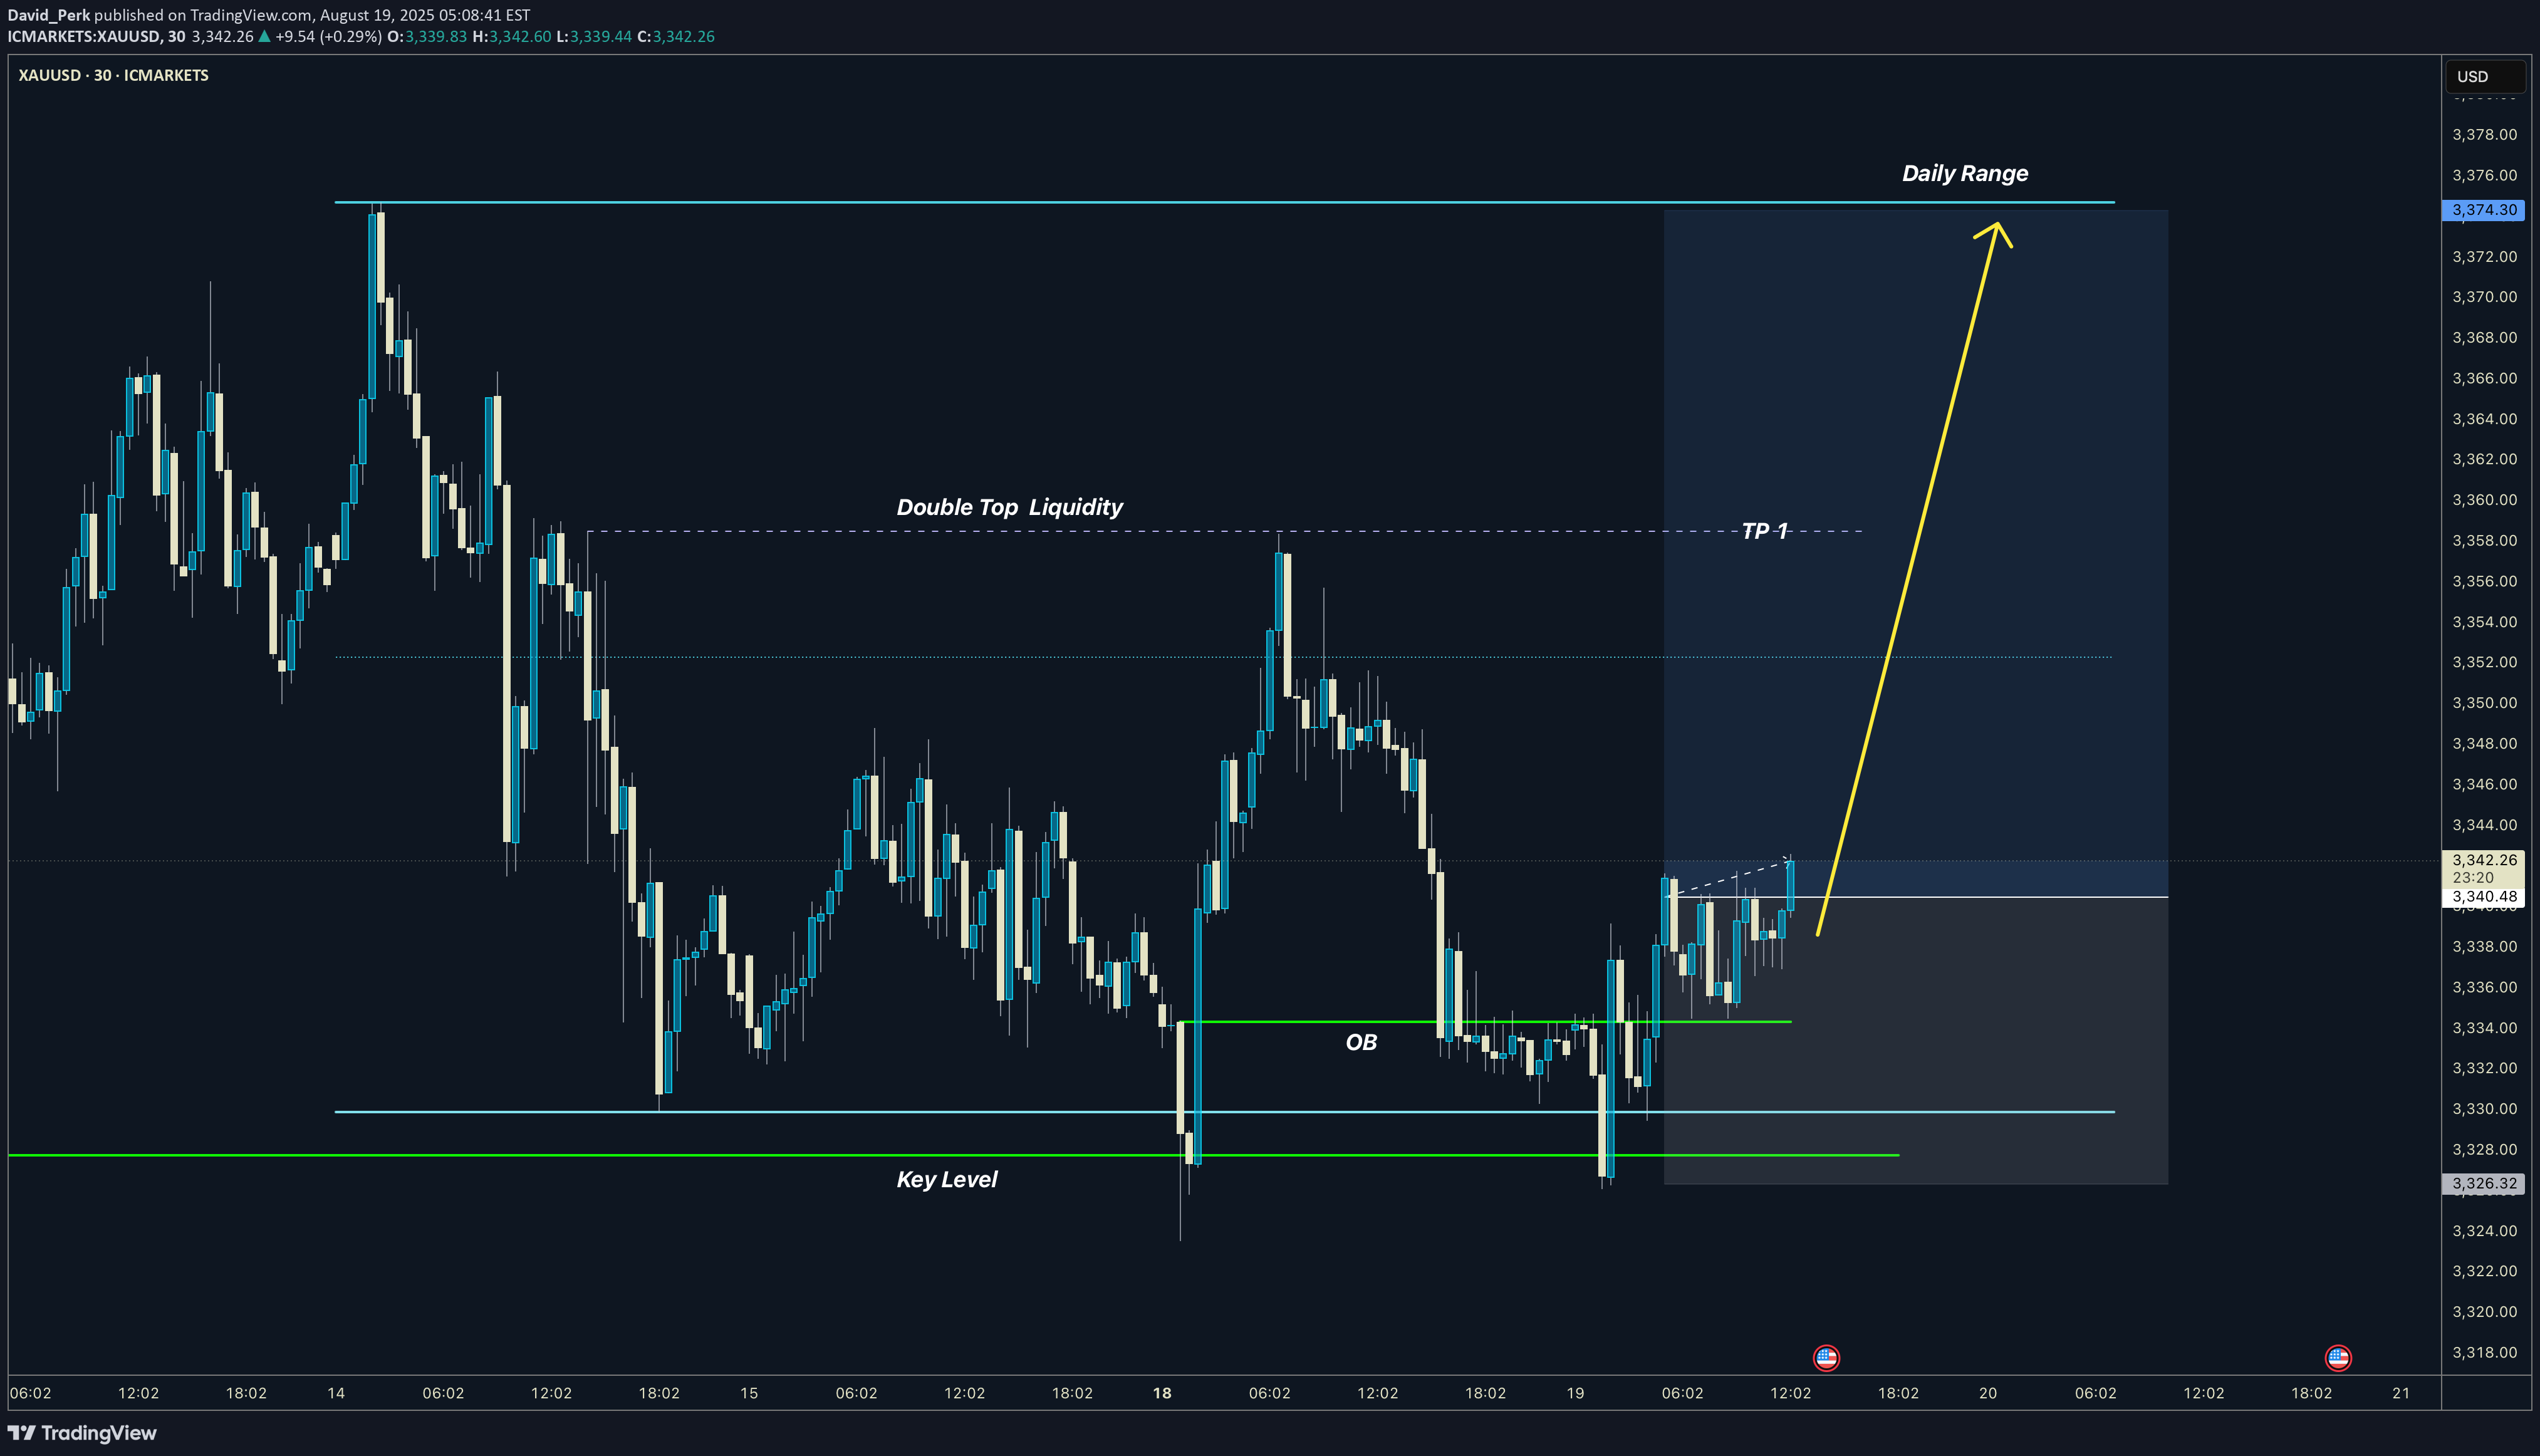
Dailyrange دستکاری شد و قیمت در بلوک سفارش واکنش نشان داد و پس از آن رد و ایجاد OB = صعودی آن اکنون. هدف قرار دادن دامنه میانی و سپس اوج کامل. نظرات خود را به من اطلاع دهید موفق باشید دیوید پرک با نام مستعار Dave FX Hunteri در اوایل دستکاری های کم عمق وارد شده است در اینجا چگونه باید باشد .. درس آموخته شده
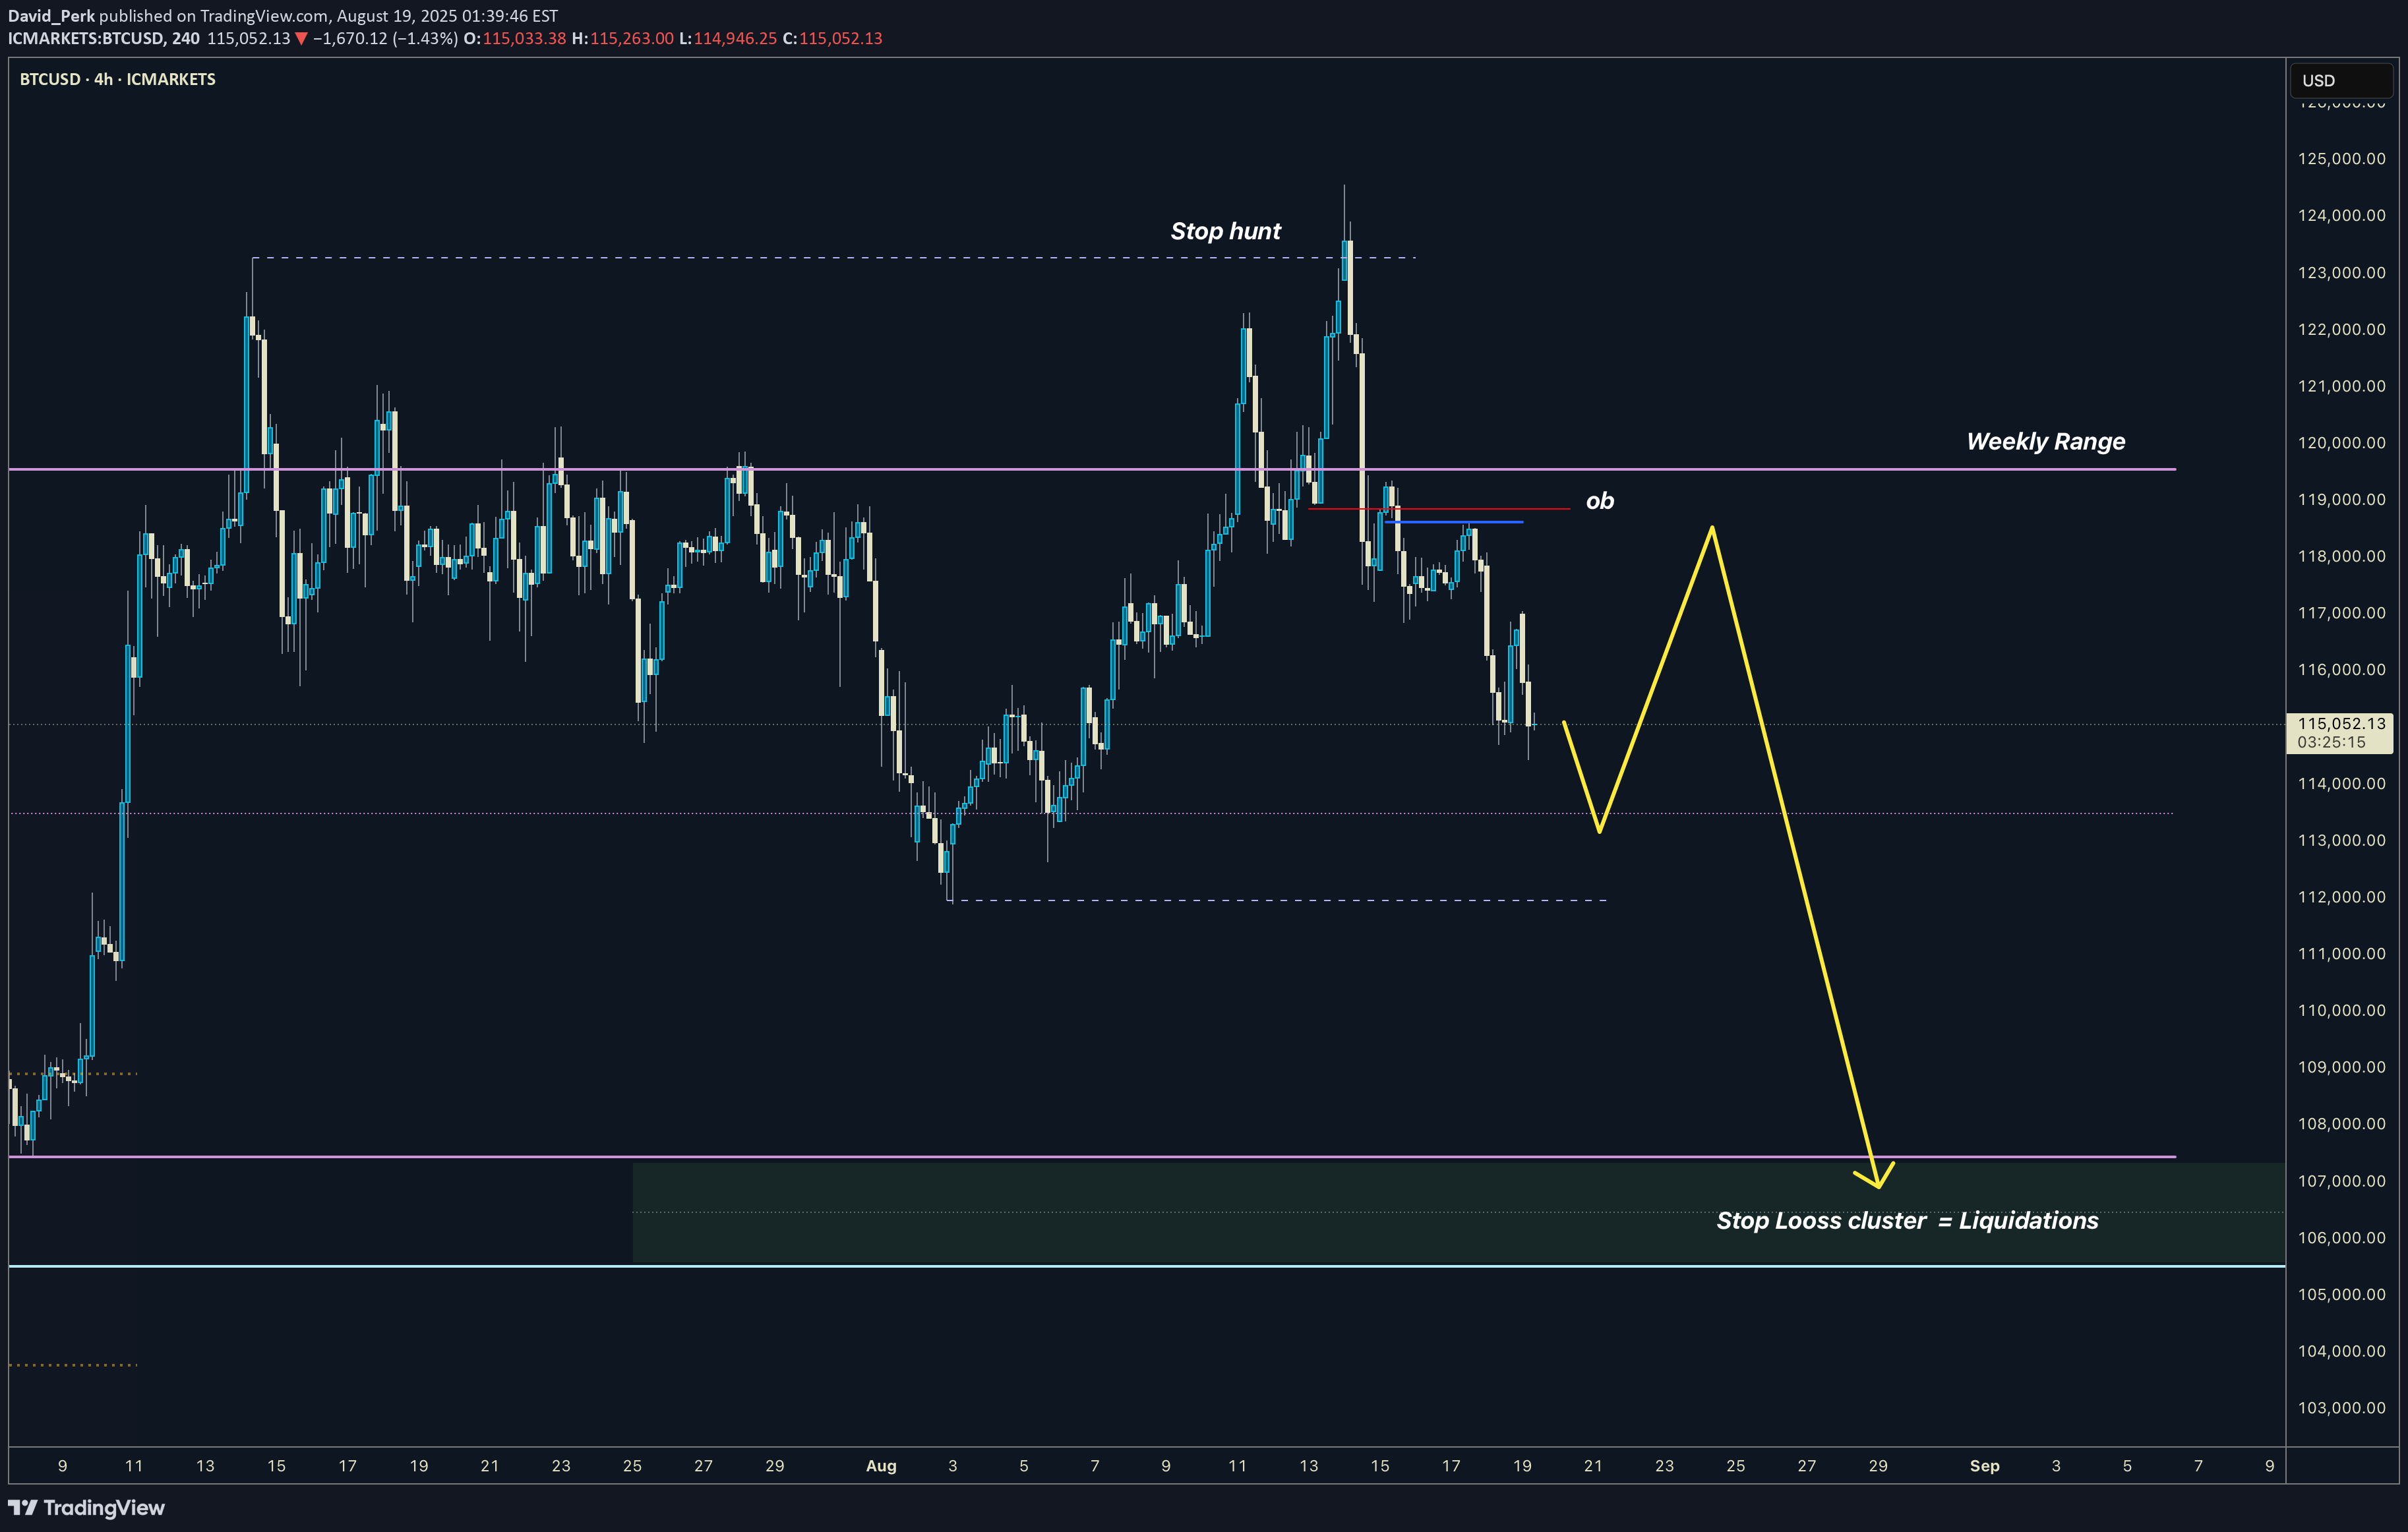
David_Perk
همه صعودی هستند ، ما می توانیم مدت طولانی اهرم های تاریخی را ببینیم. هرکسی که انتظار دارد گاو نر تا پایان سال ادامه یابد. (من هم) تأثیرگذار پیش بینی صدها هزار نفر حتی اهداف Milion .. شرکت های خزانه داری می گویند که آنها در حال خرید هستند. (اما واقعاً؟) شما قوانین را می دانید. من f همه انتظار دارند که اتفاق دیگری رخ دهد. این فقط یک طرحواره MMXM است و این بدان معنی است که آن را بازی کرد. II موقعیت نقطه من (همیشه) را به فروش نبرید ، اما من همچنین با هدف باز کردن این بازی کوتاه خود را باز نگه می دارم. ای کاش این بازی انجام نشود ، اما بازار به آرزوها اهمیت نمی دهد ، بنابراین انتظار غیر منتظره ای را داشته باشید دیوید پرک با نام مستعار دیو fx شکارچی
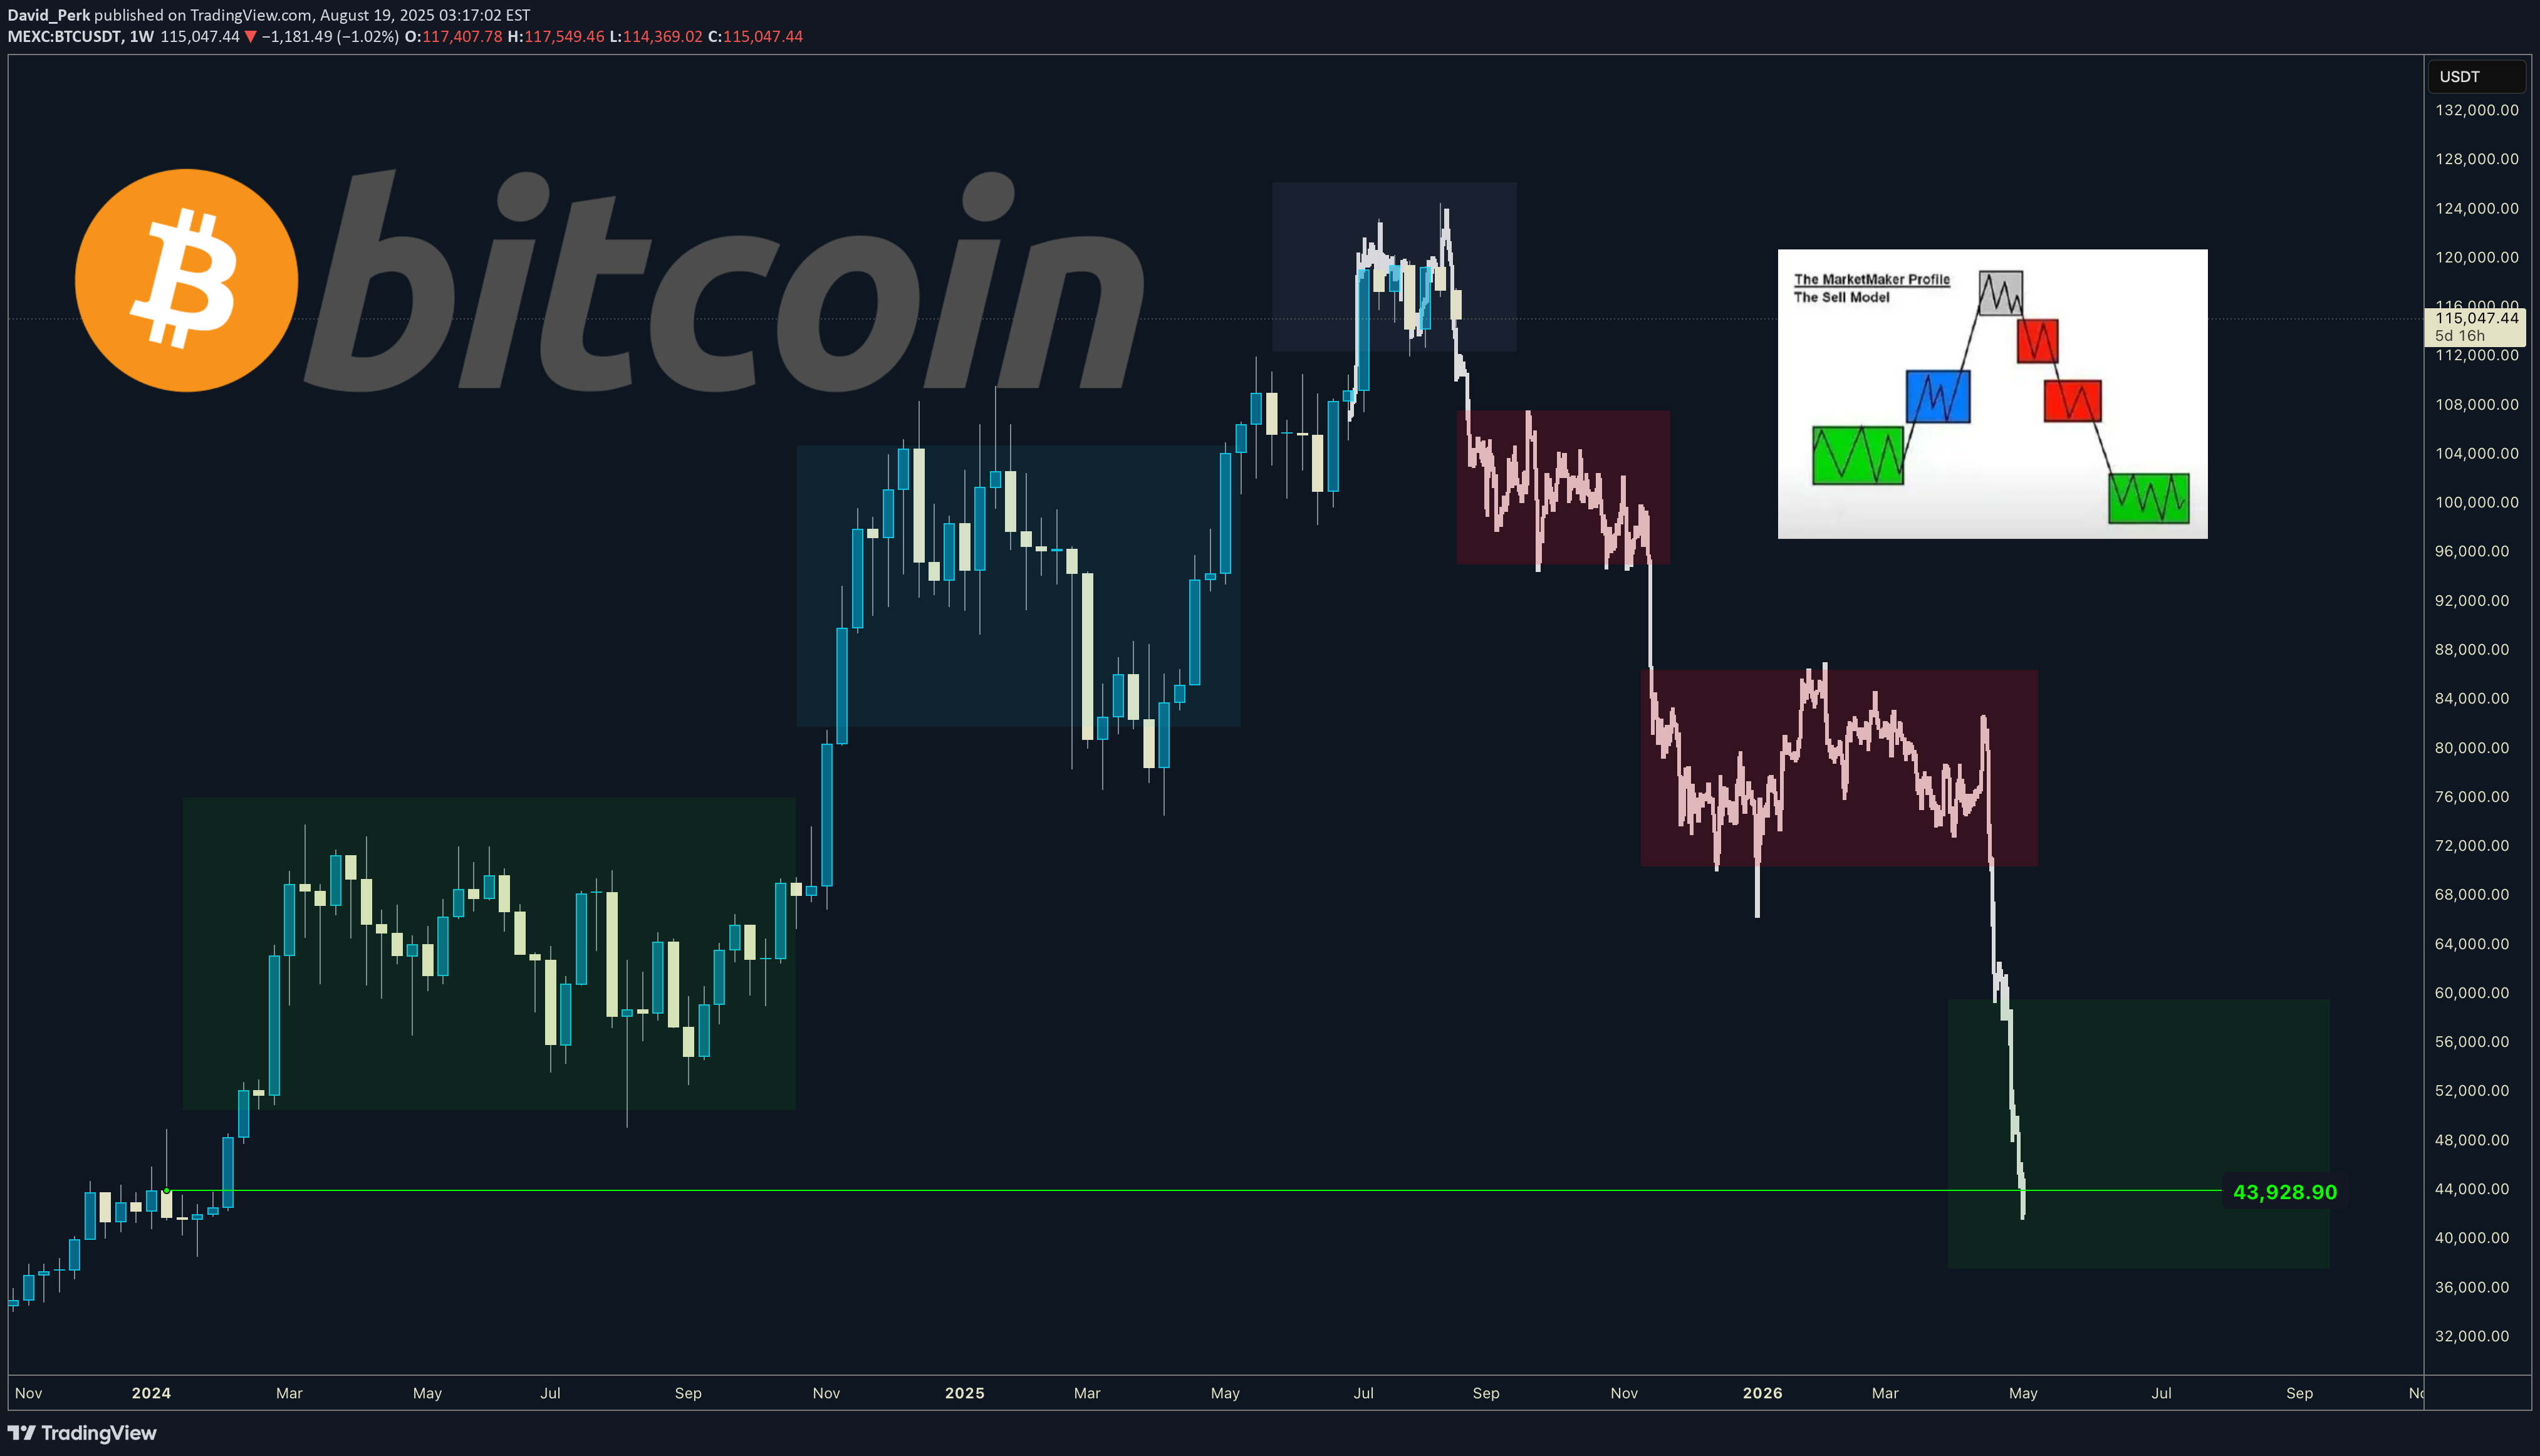
David_Perk
Bitcoin یک محدوده هفتگی ایجاد کرده که به اشتباه شکسته شده است. این امر باعث فعال شدن دستورات خرید استاپ شده است. همچنین بالاترین میزان اهرم تاریخی در موقعیت های خرید (لانگ) وجود دارد که باید نقد شود. نقد شدن ها زیر محدوده هفتگی بود، بنابراین محدوده 107 هزار دلاری محتمل است. من موقعیت اسپات خودم را (هرگز) نمی فروشم، اما از قبل در موقعیت فروش (شورت) هستم. نظر شما دوستان چیست؟ موفق باشید. دیوید پرک معروف به دیو اف ایکس هانتر
David_Perk

Hey whats up traders, today Im going to reveal my COT approach. If you’re serious about finding higher timeframe bias based on what the big players are doing, then COT data is a tool you need to know. It offers unique insights into the positioning of institutional traders—and if read correctly, it can help you align with real market momentum rather than noise. Before we break it down step-by- step. I want to mention that this is my personal approach. Larry Williams is doing it differently and I have seen some other approaches. This is what works for me, might you find it also usefull. What Is COT Data? The Commitment of Traders (COT) report is published every Friday by the CFTC (U.S. Commodity Futures Trading Commission). It shows the open positions of various market participants in the futures markets as of the previous Tuesday. This data is based on the requirement that large traders must report their positions once they pass a certain threshold. In short, we’re peeking into the order flow of institutions—excluding high-frequency trading and market making noise. Hope you already recognized small disadvantage to us as retail traders. Big players report data on Tuesday and it's published on Friday. So we basically have it late and we dont know what has happen in last 3 days. But no worry I will show you my trick how to read between the lines. COT helps us: •Understand HTF (Higher Timeframe) bias •Spot shifts in institutional positioning •Identify trend continuations or potential reversals •Avoid getting trapped in retail sentiment traps It’s not a standalone entry tool, but rather a macro confirmation layer for swing or position trades. Huge advantage by following large players is that they are trading on fundamentals and you dont need to worry about that - you just follow them. But you must follow the right participants, because there is few. Who Are the Market Participants? The COT report breaks down traders into several categories. Each one has a different motive and behavior in the market: 1. Commercials •Think of them as hedgers. •These are producers, manufacturers, and institutions trying to lock in prices for raw materials or currencies. •They are usually contrarian at extremes. When they reach record net long or net short positions, reversals often follow. 2. Non-Commercials (Speculators) •These are institutional funds, hedge funds, and large speculators. •Their goal? Profit. •Often, they follow trends and their positioning reflects the broader market sentiment of the big money. 3. Dealers •Mostly big banks and institutions facilitating trades. •They manage risk rather than speculate heavily, so they typically take the opposite side of speculative flows. 4. Leveraged Money •Hedge funds using high leverage. •Their positions often reflect short-term speculative behavior. •Watching their net positioning and changes week-to-week can give clues on momentum exhaustion. Now you might think which one to follow and Yes you can build your strategy on following any of them fore example Larry Williams - been trading base on Commercials Anton Kreil - suggest following Leveraged money I tried both but for me works best - Non commercials ( Speculators) Again here you cant say definitely which one is right or wrong. What works for you is right. Thats it. There are multiple versions of the report, but here are the most commonly used, Im using - ✅ Traders in Financial Futures (TFF) •Focused on financial markets like forex, bonds, and indexes. Where to find COT data? It's free and you can find it on the SEC website there is simple week to week format. As you can see below. Many traders are watching this. I dont say this is wrong but you dont have complete data - missing big picture. As you can see here these data below are clearly giving you a picture about an order flow and positioning changedsvn the positions which can confirm trend or help you spot potential reversal you need to watch bigger data sample. Institutions doesnt reverse market in a week, they need to of load positions and I it takes them some time. Which will explain later. Im collecting the data to the collums. I want see longs, shorts of commercials and from that I calculate. Following Longs % exposure Shorts % exposure Net positions 13 weeks average Historical Highest positions Historical Lowest Positions Relationship between these numbers helps me justify whats going behind the price action, but also spot strong levels. I will show you how to put it together with the context of the charts and then I will show you few order flow patterns examples, it's not difficult but it requires a bit of practice. Bullish Pattern - Longs growing / Shorts being closed This is the strongest COT patter and clean sign of buying This is classing pattern what we have just seen on the EURUSD Notice how longs has been growing constantly and net positions confirms that. In may been able to see rapid shorts closing, which and confirmed bullish trend and we can look just for the bullish setups. Now lets look to the USDJPY chart it will be tricky because it's all red and looks tricky but focus to the numbers and price action, how longs are growing while shorts being closed. Very weak JPY. Bearish consolidation Shorts being build Massive shorts being added int he consolidation phase longs doenst move at all. Further big drop coming. This is now happening on the AUDUSD. Look at this tight price consolidation and let's read what is happening. just look at the COT its clean longs around 23K constantly while they are building massive shorts. Whats gonna happens next is clear. Profit taking move This ofter occurs when we can see sharp move above the highs but without real longs being added, rather they being closed. As on our example below on the gold. We can see massive profit taking on longs while price was moving up. But they were not been adding shorts. What doest it tell us. They do not want to trade full reversal - not building short position, but market is overheated and they taking profits to buy later for lower or price can go to the consolidation where they will be building short, but definitely its late for us to go long. Here is another example on USDCHF Notice longs positions in the moment where there was 46K long and then next week change -12K net. It's a huge change which has started Sell off. But look in to Shorts , there is no heavy shorting, price simply go down based on huge longs profit taking. This is why its important to look in to bigger picture because if you look only in to week to week data. You will still see bigger longs than shorts and it will give you bullish opinion. Hope it's clear. And by the way now we can see 2 weeks with more then +3.4K longs. Its getting bullish IMO. Now lets look to the another example on the USDCAD Now we will use one of my past analysis where based on the data I predicted further move. And here I want to mention one thing. Even though we can see COT being bearish. It doesnt mean that price cant go up in short term (can be be 2- 3 weeks) There for you still need to use price action and dont just blindly short, but short run above the highs, because this is where big players add shorts. Not on the lows. P rice moving up shorts being added - Reversal coming This is showing positions building for the sell. In this case you can see both growing longs and shorts remember. Big players are hedgers, they are taking longs to move price up so they build shorts. Once they got their positions they close longs and sell of starts. Lets look to my TV analysis where I have seen shorts grown recently while GBP was moving up close the Monthly Order block , but notice the shorts colum how the shorts were growing recently and also longs dropped from 110K to 100K. Clena signs of the reversal but again I waited for a pullback above the weekly highs. Click to open a chart bellow This was a prediction from few week ago. Now let's look how the data looks right now. On the GBPUSD chart below we can see reveal in the data. Long significantly dropped by 50% and shorts increased by 50%. This is a clean reversal pattern in the COT. Look at net positions it clearly flipped to the bearish and big drop is coming. Few more tips Remember they know we are watching this data and what we see is what they want us to see, so they are often trying to hide their positions as long as possible. Thats why intra-week reversal are happening on Wednesday after they report their positions. They cannot hide the data forever, follow the data week by week to keep in track whats happening. It will increase your winning ratio. Every 3 months there is a new futures contract. The must close the positions and reopen them in to the new contract, They are using it for reversals. Also some if there is some US holidays on the day when report should be released to the public its delayed to the next week. And thats when they do biggest positions changes secretly. COT data isn’t a magic crystal ball—but it’s a powerful tool if you know how to combine it with technical analysis. You need to use your mechanical system. It perfectly fits with my CLS strategy and It's suitable for swing traders. Think outside the box. Even when you see bearish COT - dont be stupid to sell low. It's not NOD order flow for intraday scalping, you have time. But if you something is clearly bearish every run above weekly and daily highs is high probability Sell in the smart money trend. Dont hesitate to ask any questions and follow. I share COT weekly updates. “Adapt what is useful. Reject whats useless and add whats is specifically yours.” [/I] David Perk aka Dave FX Hunter
سلب مسئولیت
هر محتوا و مطالب مندرج در سایت و کانالهای رسمی ارتباطی سهمتو، جمعبندی نظرات و تحلیلهای شخصی و غیر تعهد آور بوده و هیچگونه توصیهای مبنی بر خرید، فروش، ورود و یا خروج از بازار بورس و ارز دیجیتال نمی باشد. همچنین کلیه اخبار و تحلیلهای مندرج در سایت و کانالها، صرفا بازنشر اطلاعات از منابع رسمی و غیر رسمی داخلی و خارجی است و بدیهی است استفاده کنندگان محتوای مذکور، مسئول پیگیری و حصول اطمینان از اصالت و درستی مطالب هستند. از این رو ضمن سلب مسئولیت اعلام میدارد مسئولیت هرنوع تصمیم گیری و اقدام و سود و زیان احتمالی در بازار سرمایه و ارز دیجیتال، با شخص معامله گر است.