
Crypto-Swing
@t_Crypto-Swing

تریدر چه نمادی را توصیه به خرید کرده؟
سابقه خرید
تخمین بازدهی ماه به ماه تریدر
پیام های تریدر
فیلتر
نوع پیام
BTC – Weekly Inside Bar and Wychoff Accummulation

در حالی که جهان به مجموعه ای پیچیده از موضوعاتی که بی ثباتی اجتماعی را در جبهه های مختلف تهدید می کند ، فرو می رود ، Bitcoin سطح غیر منتظره ای از مقاومت را نشان داده است. طی دو هفته گذشته از 53.4 کیلو به 67.4 دلار صعود کرده است و با این کار ، در بازه زمانی هفتگی (دایره نارنجی) بزرگ را در داخل Bar تأیید کرده است. این یک تشکیل صعودی است ، به طور معمول نشان دهنده وارونگی روند و در این حالت ، پس از 16 هفته تصحیح 3-3-5 مسطح می آید. از این گذشته ، وقتی به نمودار روزانه نگاه می کنیم ، می توان یک الگوی 5 موج تکانشی کاملاً واضح را به سمت صعود از پایین مشاهده کرد و نشان دهنده تغییر قابل توجه در احساسات است. با این حال ، از طریق دوره اصلاحی ، یک الگوی سر و شانه به خوبی مشخص شده است ، با مقاومت تأیید شده از گردن تا 6 تا 12 ژوئیه. این تصحیح عمیق تر پایین تر از سطح 45.4K دلار یا به سمت پیش بینی 1.618 موج A از B (بالای الگوی H&S) ، که هدف نیز با سطح پشتیبانی S3 محوری هفتگی همزمان است. هرچند داخل bar قوی است و قیمت به سرعت به عقب برگردد تا سطح 0.236 کانال رو به زوال را آزمایش کند. با انجام این کار ، BTC بسیاری از سطوح مهم از جمله 1W 12mA ، 1W 20mA و نقطه محوری هفتگی را که اکنون پشتیبانی می کنند ، پس گرفته است. و همانطور که در آخرین پست من ، از لحاظ تاریخی ، بین نصف و بالای بازار بعدی اشاره کردم ، قیمت BTC هرگز زیر سطح پایین گروه Bollinger Band هفتگی بسته نشده است ، که هم اکنون 58.4 دلار در آن قرار دارد و قبل از آن فقط یک بار در زیر 52.85 در RSI قرار گرفته است (که از آن به شدت به بازار جدید جدید راه اندازی شده است). در حقیقت ، حتی وقتی فرد به مدل Wychoff برای تجمع/توزیع نگاه می کند ، می توانیم یک مورد قوی را ایجاد کنیم که ما فقط در حال تکمیل مرحله انباشت در آماده سازی برای تقدیر قابل توجه قیمت هستیم ، با فازهای توزیع هنوز در آینده. خوب ، نظر شما چیست؟ آیا شکستن گردنبند یک سیگنال کاذب بود و ما قصد داریم یک ماه شلیک کنیم ، یا آیا این تجمع فقط یک تله گاو نر و اصلاح عمیق تر دنبال شد؟
BTC – Bottoming Signs

خوب ، یک هفته پس از پست قبلی من در مورد چشم اندازهای جهت Bitcoin است و این پرونده نزولی بود که پیروز شد. من به یک الگوی 3 کلاغ سیاه اشاره کردم که شمعدان های هفتگی در MACD شکل گرفته و حرکت نزولی در MACD ایجاد کرده اند ، که سطح پشتیبانی از بازی را تحت الشعاع قرار می دهد. این هفته می توانیم ببینیم که حرکت نزولی با افت بزرگ (16 ٪) از 63.8 کیلو دلار به 53.4 کیلو دلار در انتهای فتیله ادامه دارد. و این ماهیت این فتیله است که توجه من را به خود جلب می کند. در اینجا تعدادی از مشاهدات خود را ذکر می کنم: (1) می توانیم ببینیم که فتیله پایین طولانی است ، که نشانگر خرید قوی 53K دلار است. (2) سطح پشتیبانی با 52.9 کیلو دلار تأیید شده است. (3) این فشار خرید منجر به شکستن کانال کانال در حال کاهش شده است. (4) قیمت پشتیبانی بالاتر از سطح S1 محوری هفتگی است. (5) بولینگر پایین Band به طور موقت شکسته شد ، اولین مورد برای تاریخ Bitcoin. بنابراین ، در حالی که قیمت از پایین هفته به شدت بازگردد ، آیا حرکت بیشتری نسبت به نزولی وجود دارد؟ خوب ، مطمئناً MACD در حال گسترش است که نشان می دهد حرکت در این بازه زمانی رو به پایین است و RSI سطح پشتیبانی بحرانی را در 52.85 شکسته است. مهمتر از همه ، شکستن این سطح در هفتگی RSI ، بین نصف و بعد در تمام وقت ، قبلاً فقط یک بار اتفاق افتاده است بشر این در ژوئیه 2013 ، به دنبال اصلاح چند هفته ای بود ، پس از آن پرایس در مسیر عظمت خود قرار گرفت. در واقع ، این همزمان با MACD گسترده بود به نظر می رسد ، با وجود حرکت نزولی ، اگر تاریخچه راهنما باشد ، کاهش قیمت می تواند خسته شود. با نگاهی به نمودار روزانه و ما شاهد اتفاق بسیار جالبی از یک اژدها پرواز Doji هستیم و به دنبال آن یک شمعدان صعودی قوی است. نشانگر تأیید معکوس روند. پایین تر BB پشتیبانی را ارائه داده است و قیمت آن تنها 500 دلار است که از پشتیبانی 1D 200mA و 0.786 کانال در حال کاهش فیبوناچی استفاده می کند. از نظر موج الیوت ، تکمیل آشکار تصحیح 3-3-5 تصحیح مسطح (4> موج ABC) وجود دارد که در طرح 1X A از B و یک افزایش RSI از بالای سرزمین خریداری شده و در امتداد MACD برطرف می شود. اگر قیمت بتواند 1d 200mA را بازپس گیری کند و RSI بالاتر از روند نزولی آن بازگردد ، می تواند دلیل صعودی optimism باشد. نظر شما چیست؟ آیا قیمت گذاری بیشتر به 50 کیلو دلار (پیش بینی FIB S2 و 1.236 برای C) کاهش می یابد یا شاید حتی 48K (پیش بینی 1.382 موج C)؟ یا آیا قیمت به وجود آمده است و ما پس از بازپس گیری 200mA به بالای 64k شلیک کرد؟
BTC – Strength or Weakness
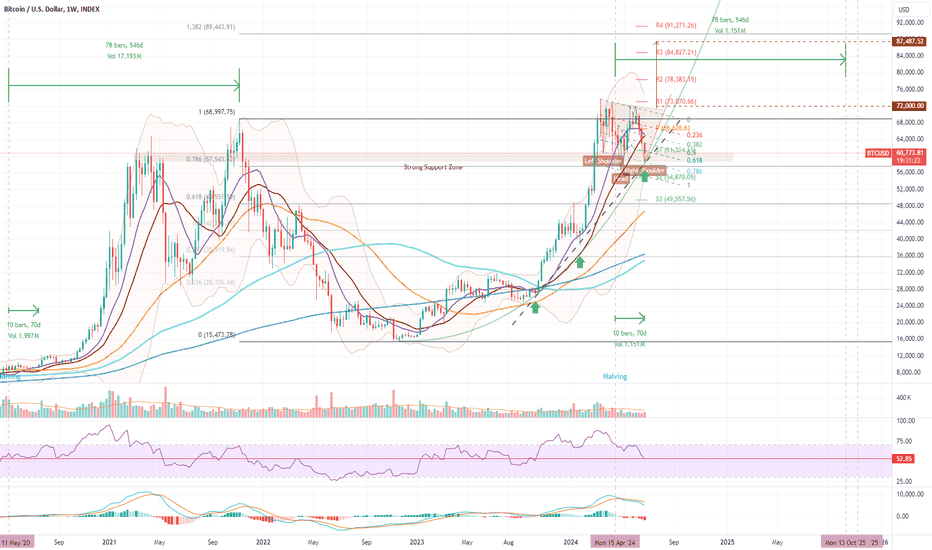
از آنجا که ما آماده می شویم تا در هفته یازدهم پس از رویداد Bitcoin نصف ، ببینیم که نوسانات قیمت معمولی باعث ایجاد ترس ، عدم اطمینان و تردید در سرمایه گذاران جدید می شود. با این حال ، شاخص های زیادی وجود دارد که نشان می دهد قیمت BTC به خوبی پشتیبانی می شود و برای یک تجمع خوب در Oct-Nov 2025 تنظیم می شود ، اما البته ، نگرانی های نزولی نیز وجود دارد. در اینجا برخی از مشاهدات من آورده شده است: دلایل صعودی بودن خطوط پشتیبانی - قیمت به خوبی از یک منطقه پشتیبانی همگرا خارج شده است ، جایی که ما می بینیم یک خط پشتیبانی قوی (سیاه نقطه) ، با بخش 0.786 کانال در حال کاهش فیبوناچی ، همزمان با ویک پایین شمع این هفته ، همگرا است. منطقه پشتیبانی - این هفته همچنین شاهد است که قیمت همچنان یک منطقه قوی از پشتیبانی بین 58K و 61K دلار را آزمایش می کند ، که از ماه مارس از آن گزاف گویی شده است. این همچنین با سطح پشتیبانی S1 محوری ماهانه هماهنگ است. اصلاح فیبوناچی - پشتیبانی همچنین در سطح 0.786 از اصلاح فیبوناچی از زمان قبلی در تمام زمان ها نیز دقیقاً زیر فتیله شمع هفتگی قرار دارد. صعود به حدود 61.4 دلار ، سطح محوری ماهانه S1 و همچنین سطح 0.618 کانال رو به کاهش را پس می گیرد. فقط 550 دلار بالاتر از قیمت فعلی. گروههای بولینگر - در اینجا ما همچنین می بینیم که Bollinger Band پایین تر برای پشتیبانی از قیمت در حال افزایش است زیرا در حال سقوط فوقانی band برای فشار دادن دامنه است. شایان ذکر است که پایین BB پایین هرگز بین یک رویداد نیمه تمام و در تمام مدت زمان بالا شکسته نشده است. میانگین حرکت - 100mA به سمت یک صلیب صعودی بالاتر از 200mA در حال افزایش است. RSI -ما می بینیم که یک خط محوری از پشتیبانی لمس می شود ، که از آن به عنوان طبقه ای برای اجرای گاوهای قبل از نیمه نیمه کار کرده است. سر و شانه های معکوس - اقدام قیمت از ماه مارس آنچه را که می تواند الگوی IH&S باشد ، ردیابی کرده است ، که تأیید می شود اگر قیمت به زیر 56.522k دلار نرسد و می تواند بالاتر از 72K دلار برسد. با توجه به تنظیمات فوق از پشتیبانی ، چنین رویدادی بسیار سریع به سمت C. 90K دلار ، سطح 1.382 اصلاح بازار خرس قبلی را مشاهده می کند. دلایل نزولی بودن MACD -در اینجا می بینیم که MACD کوتاه مدت نشان می دهد که هنوز هم در حال روند نزولی است. 3 کلاغ سیاه - 3 هفته گذشته شاهد کمترین میزان پی در پی در شمعدان های همپوشانی بوده است. این می تواند یک تنظیم نزولی نشانگر یک دوره اصلاحی قابل توجهی باشد. نظر شما چیست؟ آیا ما قصد داریم یک اصلاح طولانی را مشاهده کنیم ، شاید تا 48.5 کیلو دلار در سطح 0.618 اصلاح بازار خرس قبلی؟ (این یک تنظیم خوب برای یک الگوی بزرگ فنجان و دسته بود.) یا ، آیا ما قصد داریم گوشه ای را در این تصحیح بچرخانیم و بیش از 72K دلار را برای تجمع به اوج های جدید تمام وقت برگردانیم؟
Decision Time for DOGE (and the Alts)

با نگاهی به بازار Altcoin ، با تعجب از اینکه آیا ما کاپیته شده ایم یا نه ، متوجه می شوم که DOGE نمونه ای بسیار مفید از خطرناک بودن وضعیت Alt-Coin را ارائه می دهد. با نگاهی به نمودار استاندارد روزانه ، اجازه دهید موارد نزولی و صعودی را در نظر بگیریم: مورد نزولی در مرحله اول ، ما یک الگوی سر و شانه های چند ماهه را مشاهده می کنیم ، با قیمت گذاری درست در بالای گردن. اگر قیمت یک شکست زیر آن گردنبند را تأیید کند ، الگوی H&S کاهش بالقوه را به 0.01094 دلار نشان می دهد. بیایید آن را 1 سنت بنامیم. این بیش از 90 ٪ ضرر از قیمت فعلی است. قیمت پشتیبانی از تمام میانگین های متحرک را خراب کرده است ، توسط یک خط محوری هفتگی پشتیبانی نمی شود و به شدت به تعطیل شدن 50 ٪ (از یک موج قبلی) چسبیده است. در این سناریو ، جذب کننده هایی نیز وجود دارند که قیمت را پایین می آورند: موج C - معمولاً به یک حرکت 5 موج شکسته می شود ، و می تواند کامل در نظر گرفته شود ، به جز اینکه به طور معمول به یک پیش بینی فیبوناچی 0.618 یا بیشتر به نزولی (از A از B) می رسد ، اگرچه همیشه نیست. حمایت آزمایش نشده - به وضوح دو خط پشتیبانی آزمایش نشده ، با 0.10716 دلار و 0.09046 دلار قابل مشاهده است. مقدار پایین تر که همزمان با پیش بینی 0.786 از اصلاح فیبوناچی است. نشانگرها - MACD کاهش خود را کاهش نداده است ، حتی در چند روز گذشته هم تند و تیز است و نشان می دهد که حرکت کم است. پرونده صعودی اعتراف می کنم که این بحث به آسانی نیست ، با این حال ، در حالی که قیمت بالاتر از 0.115 دلار است ، امید وجود دارد! بنابراین ، می توانیم بگوییم که تا زمانی که قیمت سطح 8/5 فیبوناچی را در اختیار داشته باشد ، این احتمال وجود دارد که بتوانیم از 200MA (آبی تیره) و خط محوری S1 حمایت کنیم. XABCD - پشتیبانی از این الگوی هارمونیک XABCD گارتلی ، با تمام خطوط در نسبت های فیبوناچی و یک پایه XD گسترده در 0.786 نشسته است. بیشتر ، کمترین میزان امروز در D ، به پایین آمد تا 0786 را با سرعت بالایی از حرکت XA لمس کند. نشانگرها - RSI فقط وارد قلمرو Overbought می شود ، که معمولاً نشانه ای از نزدیک بودن یا اتفاق افتاده است. حجم - به همان اندازه که قبل از شروع قیمت در ماه مارس آغاز شد ، با کمی سنبله فروش که به نظر می رسد پیش از وارونگی در روند است ، پایین است. مرحله ماه - 3 روز تا ماه کامل وجود دارد ، که به نظر می رسد تا چند روز از صعود پیروی می کند ، به این معنی که اکنون می توانیم یک پایین را لمس کنیم. بنابراین ، همه چیز در مورد آن گردنبند است. یک شکست تأیید شده زیر 0.115 دلار و ما می توانیم کف را ببینیم. یا اگر نگه داشته شود ، می توانیم پس از بازپس گیری قیمت چند سطح پشتیبانی ، یک وارونگی صعودی major را ببینیم. نظر شما چیست؟ آیا فروپاشی بعد از نیمه از بازار Alt-Coin احتمالاً است؟ یا آیا Alt-Season در حال شروع است؟
BTC - Time for a correction

مشاهده پس از 58 هفته افزایش قیمت در یک کانال به خوبی تعریف شده ، Bitcoin دارای hit بالای آن کانال است ، در حالی که یک تشکیل جام تقریباً عالی را ردیابی می کند. با توجه به شرایط پایدار بیش از حد خریداری شده از RSI هفتگی و MACD که در حال چرخش است ، به نظر می رسد که BTC آماده اصلاح و ساخت یک دسته برای تکمیل تشکیل فنجان است. هدف اصلاح با پشتیبانی تأیید نشده در حدود 30.5 کیلو دلار ، همزمان با 50 ٪ اصلاح این حرکت از 15.4K دلار و 1W 200mA ، به نظر می رسد حداقل تصحیح در حدود 30.5K دلار است. در زیر آن ، سطح فیبوناچی 61.8 ٪ (27.0K دلار) را می بینیم که همزمان با پایین کانال در حال افزایش است ، با پشتیبانی قوی حدود 25.2K دلار نشان داده شده است. بنابراین ، به نظر می رسد شرط safe برای یک هدف در قیمت از 30.5k تا 25.5k $ در طی 6 هفته آینده باشد. ملاحظات دیگر خطوط دیگر همگرایی - درست بالاتر از سطح 78.6 ٪ اصلاح فیبوناچی جایی است که دو خط پشتیبانی (سیاه و سفید) با 1W 300mA در حدود 23K دلار همگرا می شوند. پشتیبانی تأیید نشده - در زیر همه موارد دیگر ، سطح پشتیبانی غیرقابل تأیید با 18.4K دلار است که قیمت آن در 12 دسامبر 2022 رد شد.
BCH – an interesting setup

با نگاهی به علاقه اخیر به bch و قدرت کوتاه مدت نمایش داده شده در btc، متوجه می شوم که پتانسیل bch برای ادامه عملکرد بهتر btc در حرکت بعدی وجود دارد. در این نمودار چیزی را می بینیم که به نظر می رسد یک اصلاح موج 4 و یک پرچم صعودی است که به نظر می رسد در حال شکستن به سمت بالا است. همه اینها بالاتر از نقطه محوری هفتگی با سطح بعدی مقاومت در حدود 390 دلار، درست بالاتر از پیش بینی 1.618 اصلاح موج 4 رخ می دهد. آیا این می تواند افزایش 38 درصدی را به همراه داشته باشد؟ این یک احتمال است، تا زمانی که btc به نشان دادن مقداری قدرت ادامه دهد. اما آیا این روند بهبودی را از بین می برد؟ بالا بودن پایین تر در rsi و macd در این حرکت می تواند یک واگرایی نزولی strong را نشان دهد، بنابراین ما باید منتظر بمانیم و از نزدیک تماشا کنیم که اوضاع چگونه پیش می رود. در کوتاه مدت، با این حال، به نظر می رسد که یک انفجار بالاتر ممکن است در کارت باشد.
Bitcoin - The consolidation

در این مطالعه، من نگاهی دقیق به ساختار موج الیوت جنبش از 10 مارس میاندازم تا این تثبیت دیوانهکنندهای را که از 23 مارس شاهد آن بودهایم، در نمودار 4 ساعته، با پالایش تعداد امواج مطالعه قبلی درک کنم. . در حال حاضر روی محور هفتگی 28 هزار دلار نشسته ام، ساختار موج اصلاحی را می بینم که توسعه یافته است، که نه تنها شامل دو شکل مثلث متقارن متوالی است، بلکه هر دو بخشی از یک اصلاح پیچیده نامنظم دو سه (wxy) با هدف قیمت c هستند. . 24 هزار دلار تقریباً 14٪ اصلاح از قیمت فعلی. شکستن زیر انتهای خط حمایت مثلث می تواند محرکی برای افت عمیق تر باشد. شکست تایید شده بالای خط مقاومت بالایی مثلث این سناریو را باطل می کند. شما چی فکر میکنید؟ آیا ما شاهد سقوط به سمت 24 هزار دلار بود یا ادامه روند صعودی به بالای 30 هزار دلار؟
Bitcoin - A higher-higher?

با قویتر شدن واگرایی قیمت در rsi، macd و حجم، اوج اخیر به 29.1 هزار دلار در btc نقطهای برای اصلاح به نظر میرسد. در این مطالعه، من همگرایی را در منطقه 25.5 دلاری سطح 0.5 کانال صعودی، 1w200ma، 1d50ma، سطح 0.618 رالی را به 29.1k دلار و سطح حمایت تایید نشده را در 25.2k دلار نشان می دهم. به نظر شما، آیا برای آزمایش سطح پشتیبانی تایید نشده در حدود 25.2 هزار دلار، اصلاح 10%+ را داریم؟ به نظر من اینطور است
Bitcoin – A Sign of Strength

از آنجایی که تعداد آدرسهای bitcoin به تازگی در حال افزایش است، قیمت bitcoin با افزایش شدید در منطقه 25 هزار دلاری، نشانهای از قدرت را در شرایط سخت نشان میدهد. مقاومت. بهطور کلیتر، میتوانیم این را حرکتی بالای خط گردن یک الگوی معکوس بزرگ سر و شانه ببینیم. بسته شدن تایید شده بالای این خط گردن، سیگنال اصلی معکوس روند بود که حرکت قیمت را به حدود 36 هزار دلار و احتمالاً در نهایت حتی بالاتر از 40 هزار دلار، 43 هزار دلار یا حتی 48 هزار دلار نشان می دهد. در نمودار هفتگی، شمعدان چکشی، پشتیبانی از 1w 20ma را پیدا میکند، و به دنبال آن رنگ سبز و بزرگ bar نیز کاملاً محوری به نظر میرسد. همه این موارد در هر دو نمای روزانه و هفتگی بر روی یک بسته بالاتر از خط گردن است، اما به نظر می رسد strong دلایلی برای اعتماد به نفس گاوها در اینجا وجود دارد. شما چی فکر میکنید؟ جایی که bitcoin در حرکت بالاتر متوقف شد؟ یا اینکه همه اینها فقط یک تله گاو نر است و سکههای mtgox در شرف هجوم به بازار هستند و قیمتها را به پایینهای دورهای جدید سوق میدهند؟ 😊
Bitcoin - Technical formations breaking down?

در این مطالعه، من گوه رو به رشدی را نشان میدهم که شکسته شده است و باعث افت اخیر شده است و قیمت برای سومین بار خط حمایت ساختار مگافون صعودی را پیدا میکند. چالشهای فعلی در این نمودار برای غلبه بر گاوها عبارتند از: شکستن گوه حرکتی در زیر تکیه گاه مگافون ایجاد می کند. یک پرچم خرس تشکیل می شود تعداد موج الیوت رو به پایین 4 است، با یک پای 5 تا پایان. شکست به زیر 21351 دلار به این معنی است که ما پایین تر می رویم. زمانی که 21.3 هزار دلار شکسته شود، سطوح پشتیبانی بعدی 20.4 هزار دلار و 18.4 هزار دلار است. از سوی دیگر، اگر قیمت بتواند حمایتی بالاتر از 21.4 هزار دلار پیدا کند و افزایش یابد، ممکن است به سمت 40 هزار دلار افزایش یابد. این به این دلیل است که موج 5 (که با رنگ سبز مشخص شده است) ناگهان به یک موج کوچک 1 تبدیل می شود و شروع موج 3 پا بالاتر را نشان می دهد. خبر خوب این است که چه افزایشی از 21.5 هزار دلار، 20.4 هزار دلار یا 18.4 هزار دلار باشد، مطمئناً به نظر می رسد روند صعودی باشد. شما چی فکر میکنید؟ آیا ما به سرعت به سمت 40 هزار دلار می رویم، قبل از صعود به سمت 18 هزار دلار عقب می مانیم، در شرف شکسته شدن کامل و فرو رفتن دوباره در ادامه بازار نزولی هستیم؟
سلب مسئولیت
هر محتوا و مطالب مندرج در سایت و کانالهای رسمی ارتباطی سهمتو، جمعبندی نظرات و تحلیلهای شخصی و غیر تعهد آور بوده و هیچگونه توصیهای مبنی بر خرید، فروش، ورود و یا خروج از بازارهای مالی نمی باشد. همچنین کلیه اخبار و تحلیلهای مندرج در سایت و کانالها، صرفا بازنشر اطلاعات از منابع رسمی و غیر رسمی داخلی و خارجی است و بدیهی است استفاده کنندگان محتوای مذکور، مسئول پیگیری و حصول اطمینان از اصالت و درستی مطالب هستند. از این رو ضمن سلب مسئولیت اعلام میدارد مسئولیت هرنوع تصمیم گیری و اقدام و سود و زیان احتمالی در بازار سرمایه و ارز دیجیتال، با شخص معامله گر است.