
CaptBlackBeard
@t_CaptBlackBeard

تریدر چه نمادی را توصیه به خرید کرده؟
سابقه خرید
تخمین بازدهی ماه به ماه تریدر
پیام های تریدر
فیلتر
نوع پیام
CaptBlackBeard
BCH DWEB Node trend chart.
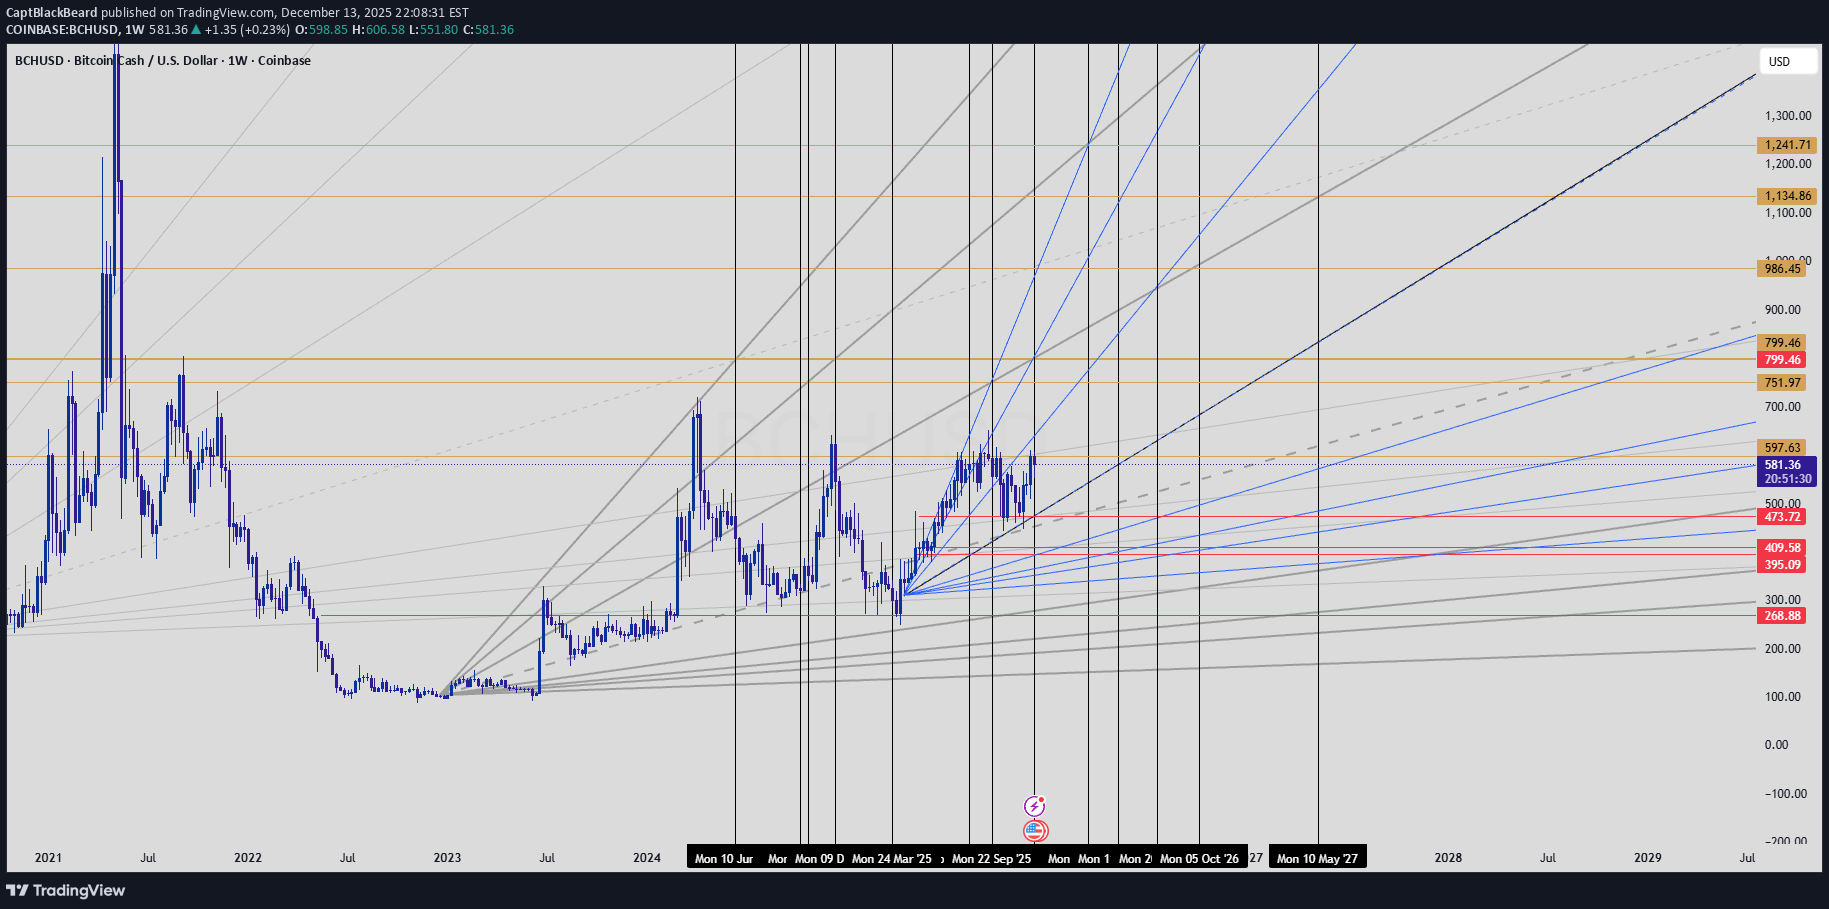
طرفداران گان با روندهای DWEB ساخته شده اند، تقاطع هایی که برای محورهای بالقوه مشخص شده اند و در صورت صعودی شدن سطوح مهم. اگر در اینجا شکست خورد، از فن های Gann (درجا) به عنوان روند استفاده کنید. یک قدم در یک زمان
CaptBlackBeard
رمزگشایی ترندهای سینوسی DWEB: نقشه راه قیمت و زمان
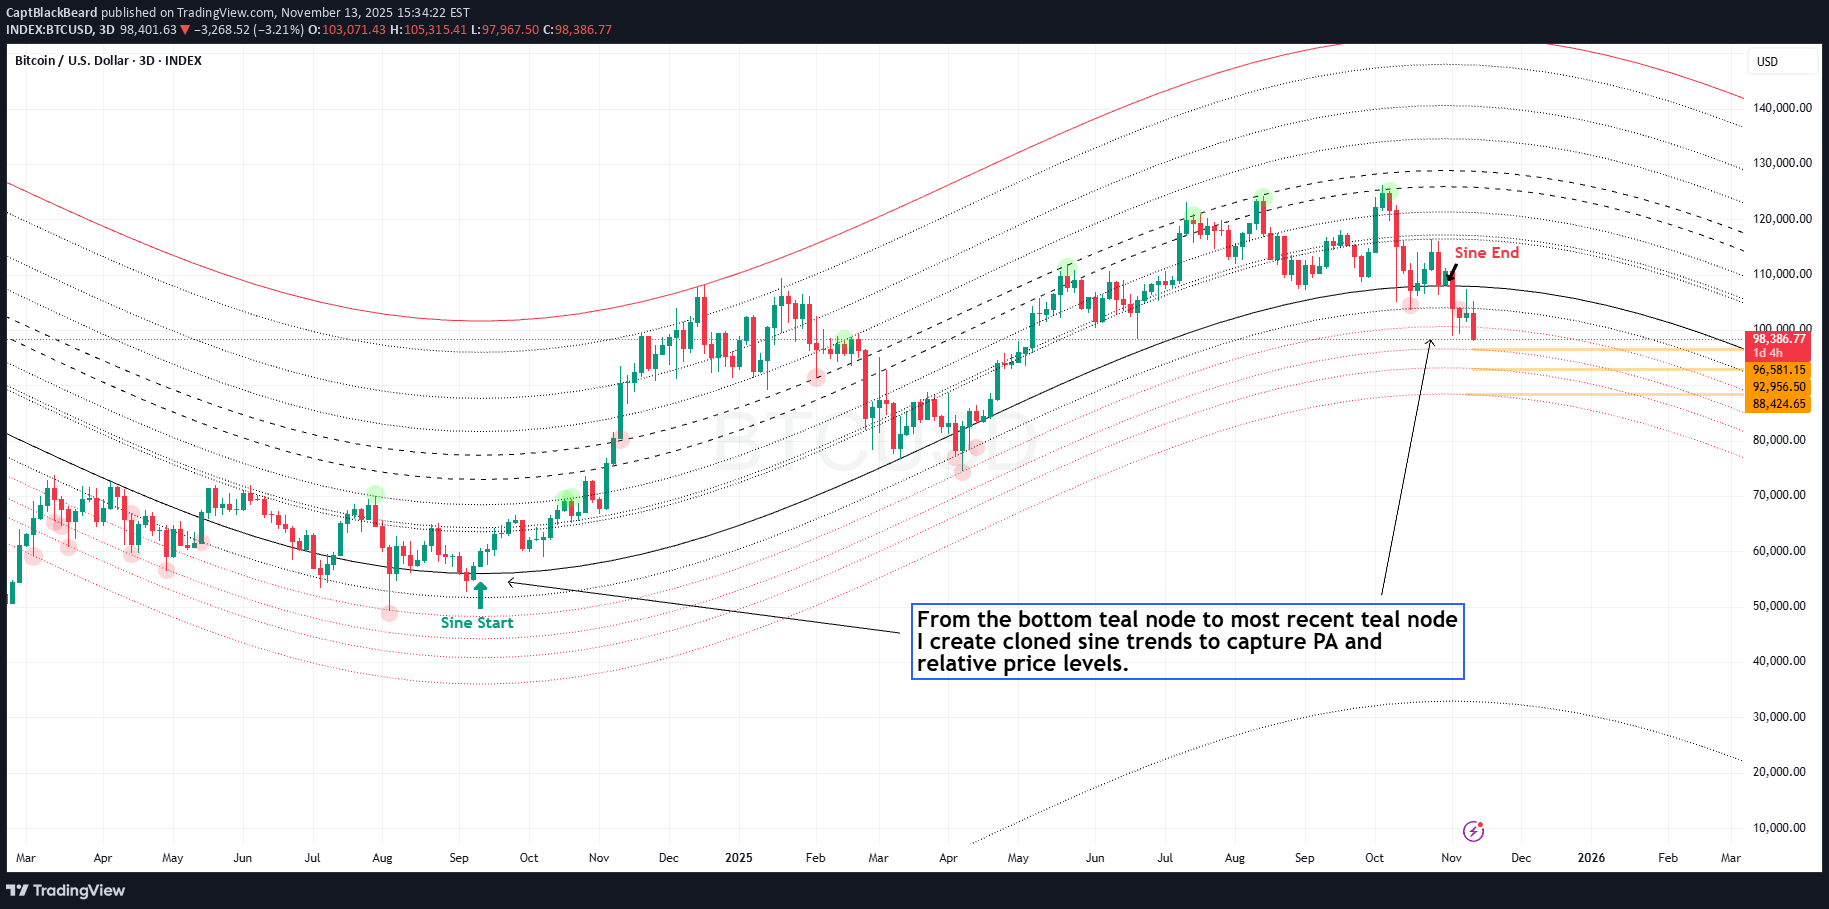
از پایینترین گره فیروزهای تا جدیدترین گره فیروزهای، روندهای سینوسی همسانسازی شده را ایجاد میکنم تا حرکت قیمت (PA) و سطوح قیمتی را نسبت به زمان ثبت کنم. *اندیکاتور گره DWEB، گرهها را در مختصات ایدهآل برای قیمت، زمان و تعادل قرار میدهد.
CaptBlackBeard
تحلیل زکش (ZEC): نمودار، روندها و استراتژیهای سرمایهگذاری بلندمدت و کوتاهمدت
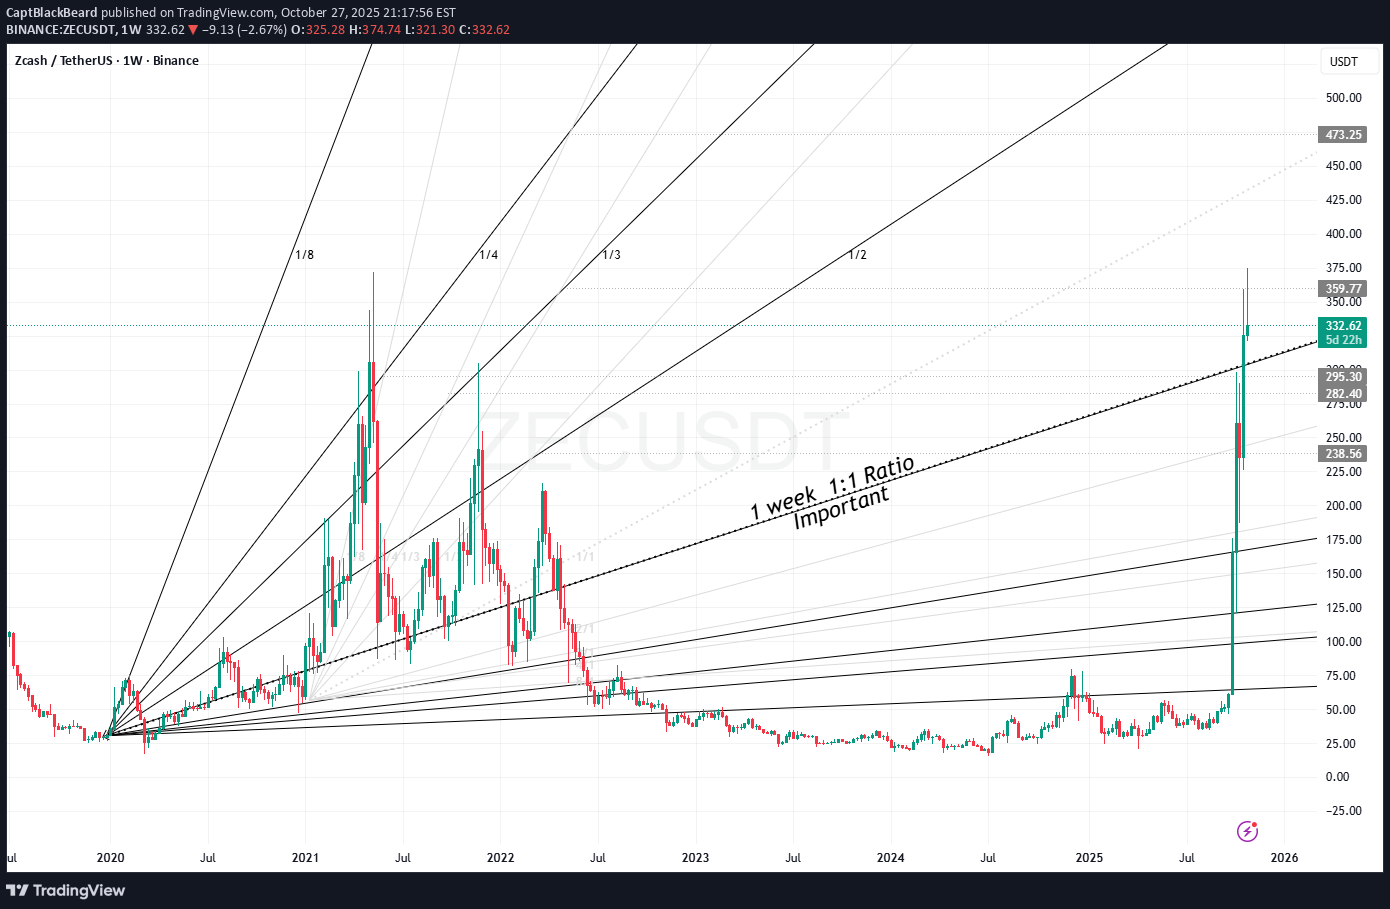
نشانگر DWEB روی ZEC هنگامی که طرفداران گان را با گرههای گره ارائه شده همسو میکنید، بیشتر زمان میبرید، روندهای آینده را دریافت میکنید که معنادار هستند. مرحله بعدی استفاده از فن های متعدد و شناسایی تقاطع ها برای data اضافی است. این hard است که بگوییم این روند صعودی ماند اما من می گویم که هنوز در یک منطقه سالم است. خرید تاپ کار من نیست، اما دانستن زمان کاهش همیشه مهم است. بسیاری از سطوح پایین تر وجود دارد که در راه صعود گذشته بودند. آنها شکاف هایی هستند که همیشه باید آنها را ممکن دانست. دراز مدت، من همیشه Zcash را به عنوان یک سرمایه گذاری دوست داشتم. بازی طولانی = سرمایه گذاری : خرید مگا شیب، پشتیبانی جامد و تست مجدد. هدف R/R و احساسات صفر داشته باشید. ممکن است بخواهید ZEC بعدی را پیدا کنید و کمی از آن محافظت کنید. بازی کوتاه = معامله : محدودیت ها را متوقف کنید، دستورات را محدود کنید، صبور باشید! ممکن است بخواهید ZEC بعدی را پیدا کنید و اجازه دهید این یکی این کار را انجام دهد. معامله مارجین در قله ها، روی hot سکه، می تواند شما را له کند.
CaptBlackBeard
رمزگشایی اعداد 913 و 13/9: آیا آسانتر از چیزی است که فکر میکنیم؟
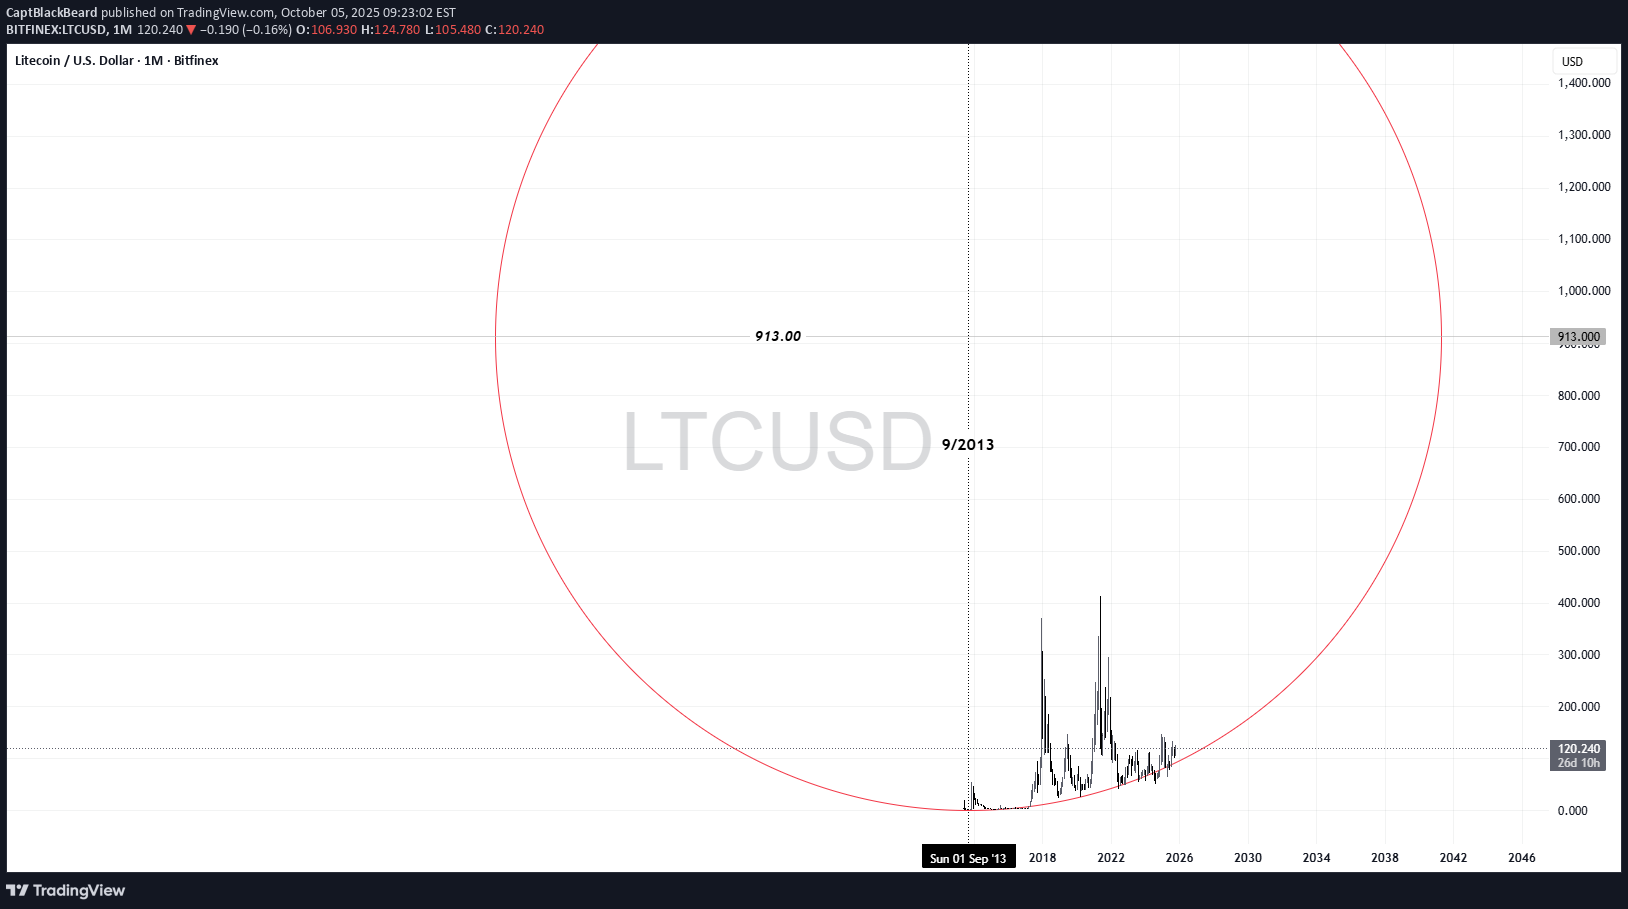
جالب است که کارها چطور پیش میروند. شاید از آنچه فکر میکنیم آسانتر باشد.
CaptBlackBeard
DWEB Node trends, intersects, levels, pivots
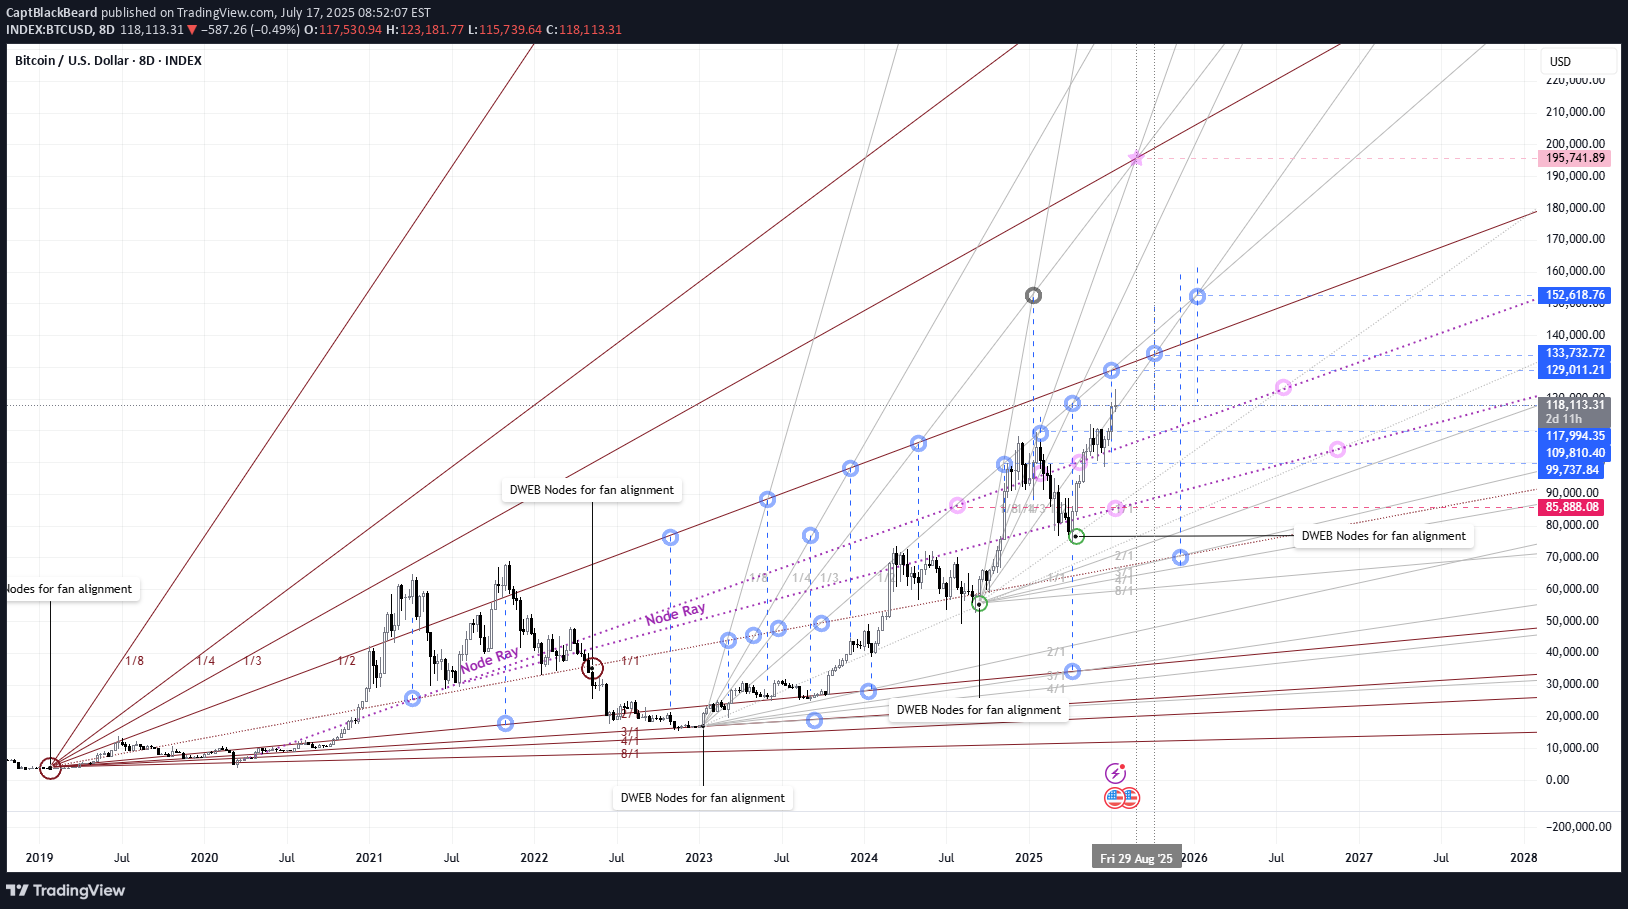
با استفاده از اندیکاتور DWEB، شما می توانید خط روند major را که بین 2 گره هم رنگ (شروع با رنگ یکسان) ساخته شده است، پیدا کنید. با استفاده از این گره ها و خطی که به دست می آورید، یک نقطه شروع و تراز برای بادبزن ها و پرتوهای گن داشت. این بادبزن ها و پرتوها، زمانی که به درستی قرار داده شوند، روندهای بسیار دقیقی را برای دنبال کردن در آینده ارائه می دهند. هنگام استفاده از روندهای چند گره ای با بادبزن ها و پرتوها، متوجه شد که وقتی همه چیز به درستی تراز شده باشد، نقاطی که خطوط در آن ها تلاقی می کنند، به احتمال زیاد دارای مقداری form از data هستند. این می تواند در مناطق زمانی/محوری (x)، سطوح قیمت (y) یا هر دو باشد. با دقت نگاه کنید، ساخت این نمودار فقط 20 دقیقه طول کشید و شرط می بندم که data بسیار بیشتری در آن یافت می شود و از ابزارهای طراحی برای کمک به پیش بینی روندهای آینده و حرکت قیمت استفاده شده است. سینوس، فیبوناچی، هندسه و غیره. نمودار اصلی را با گره های DWEB روشن در اینجا ببینید. در بلندمدت، من نسبت به BTC بسیار خوشبین هستم. این یک نمودار 8 بعدی است، پس این نکته را در نظر داشته باشید.
CaptBlackBeard
Simple DWEB node trends
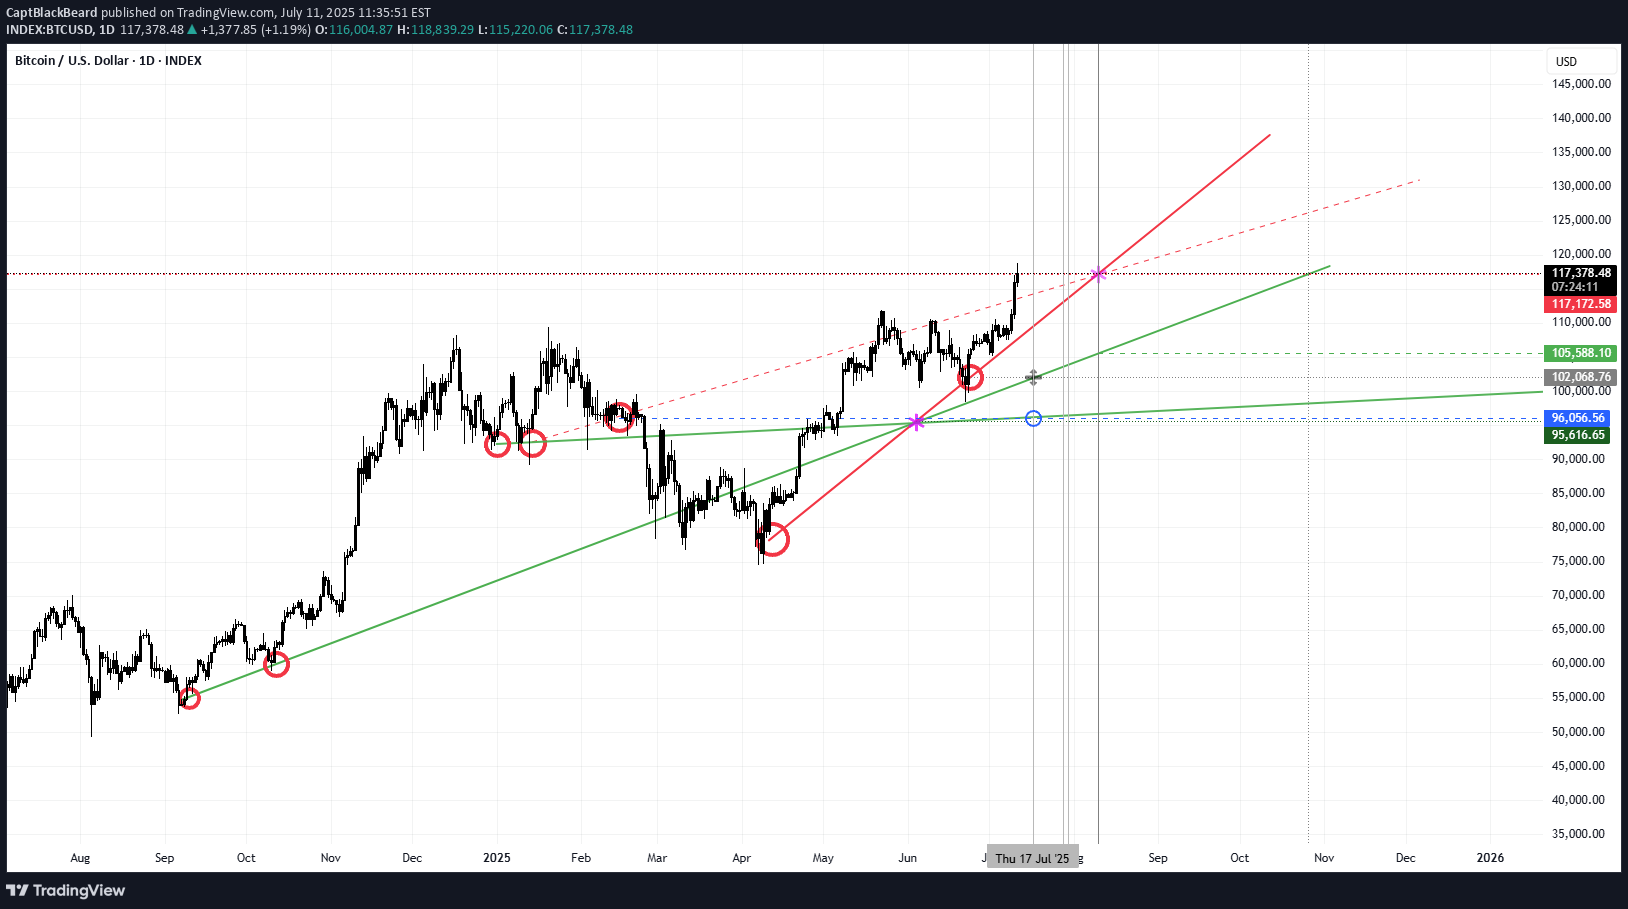
تنها خطوط روند 1D که برای همگرایی به آنها نیاز دارید. بر اساس گرههای روند DWEB ایجاد شدهاند. محل تقاطعها برای واکنش قیمت محلی مشخص شدهاند. فقط در نمودار 1D استفاده شود.
CaptBlackBeard
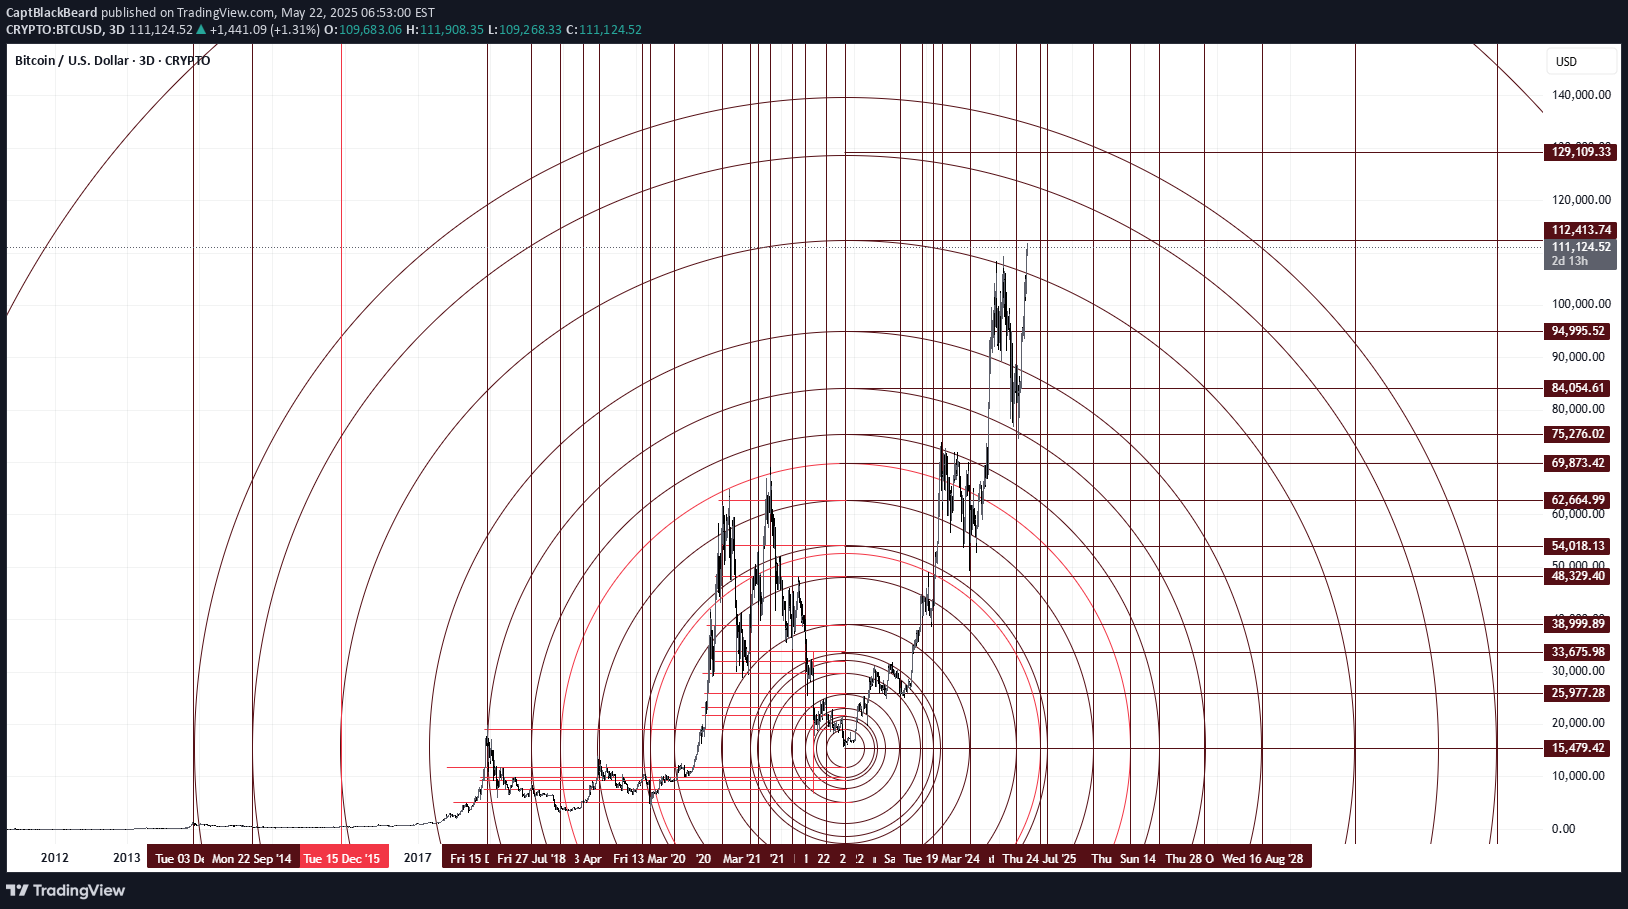
BTC Fixed Rings and Tangents
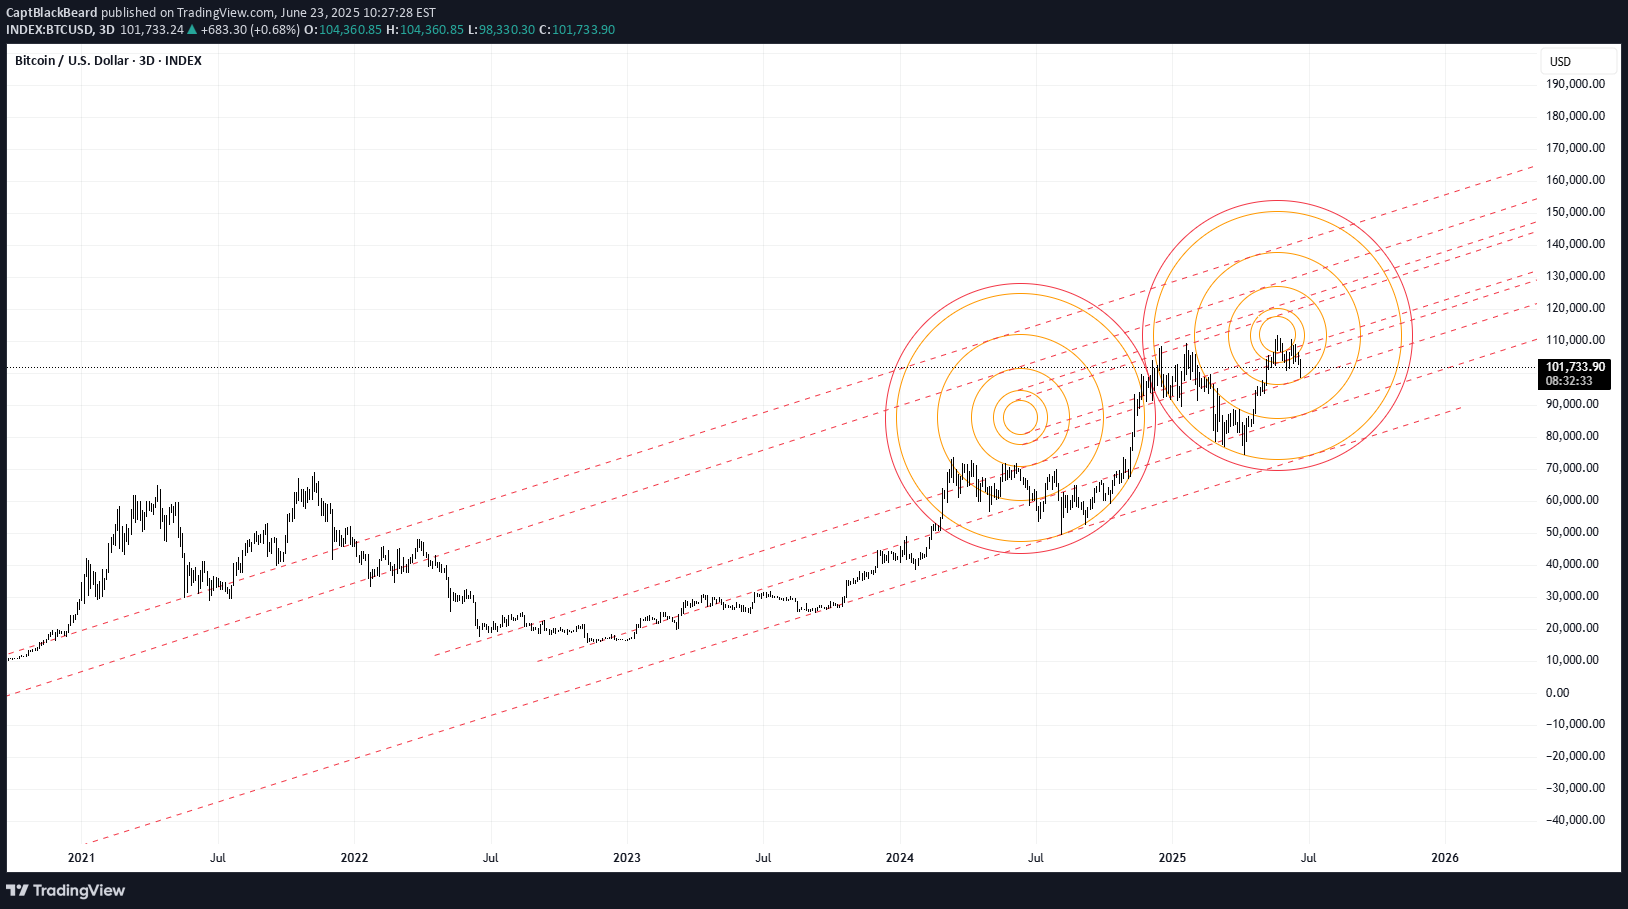
واقعاً بسیار خوب است که به آن نگاه کنید اما شرط می بندم که این روندها و حلقه ها بسیار عالی هستند data حرکت به جلو. همچنین می توانید خطوط عمودی و افقی خود را برای سطح قیمت و برخی از محوری (ممکن) به مماس دایره اضافه کنید.
CaptBlackBeard
BTC curve trends 23h
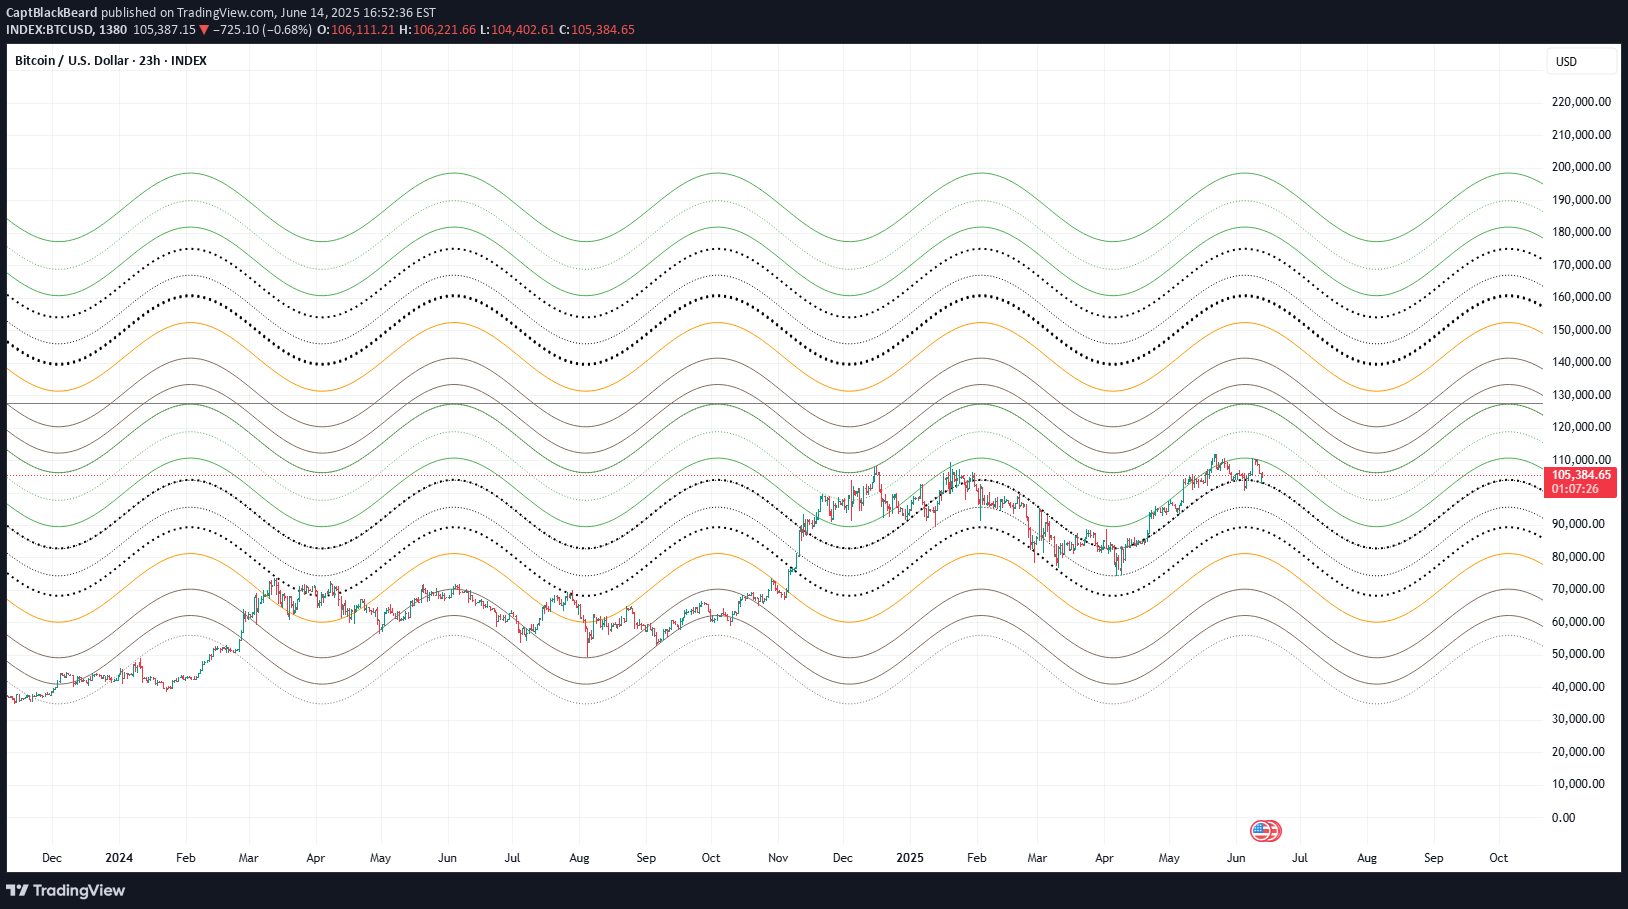
روندهای منحنی ساده که با استفاده از ابزار گره های DWEB ساخته شده اند.
CaptBlackBeard
Circular trends, tangents, levels of intrest
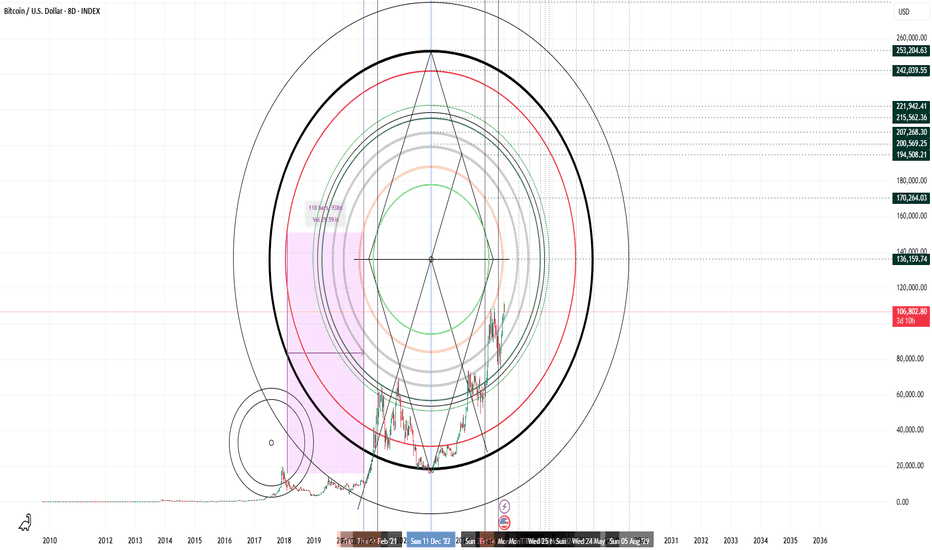
روند مبتنی بر بیضی متمرکز و تراز با قیمت و زمان بود. مماس برای تلاقی آینده و data برای ساختن نمودارها از. مماس های پایین تر از قیمت فعلی را می توان در قسمت های پایین دایره ها برای پشتیبانی مشخص کرد. بلند مدت من همیشه در مورد آینده BTC صعودی هستم. من برای انجام معاملات کوتاه مدت ، روند و زمان و زمان را دنبال می کنم. *با تمام نمودارهای من ، جستجوی تقاطع ها عاقلانه است*
CaptBlackBeard
Tangents
مماس ها بر اساس قیمت و زمان ، گذشته و آینده مشخص می شوند. توجه کنید که چگونه حلقه ها نه تنها محورهای مماس (عمودی) را در خود جای می دهند ، بلکه قیمت را به خوبی به عنوان روند منحنی S&R در آغوش می گیرند
سلب مسئولیت
هر محتوا و مطالب مندرج در سایت و کانالهای رسمی ارتباطی سهمتو، جمعبندی نظرات و تحلیلهای شخصی و غیر تعهد آور بوده و هیچگونه توصیهای مبنی بر خرید، فروش، ورود و یا خروج از بازارهای مالی نمی باشد. همچنین کلیه اخبار و تحلیلهای مندرج در سایت و کانالها، صرفا بازنشر اطلاعات از منابع رسمی و غیر رسمی داخلی و خارجی است و بدیهی است استفاده کنندگان محتوای مذکور، مسئول پیگیری و حصول اطمینان از اصالت و درستی مطالب هستند. از این رو ضمن سلب مسئولیت اعلام میدارد مسئولیت هرنوع تصمیم گیری و اقدام و سود و زیان احتمالی در بازار سرمایه و ارز دیجیتال، با شخص معامله گر است.