
BoredApeYachtClub
@t_BoredApeYachtClub

تریدر چه نمادی را توصیه به خرید کرده؟
سابقه خرید
تخمین بازدهی ماه به ماه تریدر
پیام های تریدر
فیلتر
نوع سیگنال
BoredApeYachtClub
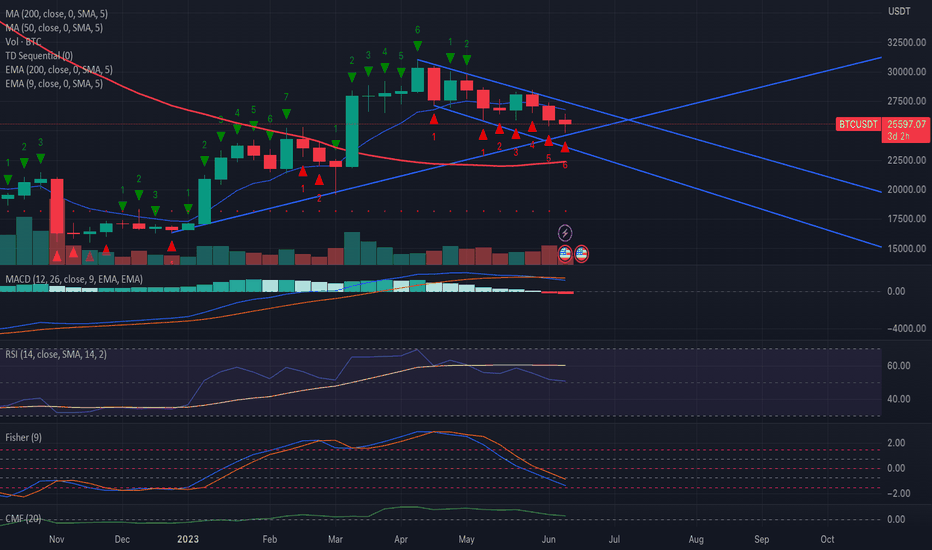
بر اساس تحلیل من از بازه زمانی هفتگی، ما در حال حاضر در TD 6 قرار داریم. معمولاً، زمانی که به شاخص TD 9 برسیم، شاهد یک تغییر روند بود، که کمی بیش از 3 هفته دیگر اتفاق افتاد. من معتقدم که جلسه آتی فدرال رزرو، دیدگاه بهتری در مورد احتمال افزایش نرخ بهره در آینده به ما داد. در جلسه قبلی فدرال رزرو، به طور گسترده پیش بینی می شد که افزایش نرخ بهره ای وجود داشت. اگر جلسه بعدی نیز عدم افزایش نرخ بهره را تأیید کند، می توانیم نتیجه گیری کنیم که احتمالاً در آینده قابل پیش بینی افزایش نرخ بهره دیگری وجود داشت، صرف نظر از اینکه نمودار data چه چیزی را نشان می دهد (که در حال حاضر احتمال دو افزایش نرخ بهره دیگر را نشان می دهد). با نظارت دقیق بر شاخص های TD و توجه به نتایج جلسه بعدی فدرال رزرو، می توانیم بینش ارزشمندی در مورد روند آتی افزایش نرخ بهره به دست آوریم. این امر ما را قادر می سازد تا بر اساس روندهای نوظهور در بازار، تصمیمات آگاهانه تری بگیریم. اگر بخواهم یک هدف قیمتی تخمینی ارائه دهم، می گویم منطقه 24 هزار تا 24.5 هزار دلار، زیرا در این منطقه همگرایی زیادی وجود دارد، قبل از حرکت صعودی بعدی ما. بر اساس برخی از خطوط من، 3 واحد دیگر و پایین ترین سطح کانال تقریباً 22 هزار دلار بود. اما به خاطر داشته باشید که مجبور نیستیم به 22.2 هزار دلار برسیم... این خط روند نزولی است که در 3 ماه گذشته در آن بوده ایم. ما می توانیم به خوبی بالاتر از 24 هزار دلار باقی بمانیم و همچنان الزامات T9 را برآورده کنیم.
BoredApeYachtClub

لطفا در مورد تله احتمالی که در بازار راه اندازی می شود احتیاط کنید و هوشیار باشید. ذکر این نکته ضروری است که ما هنوز شمارش موج 5 را تکمیل نکرده ایم. در بهترین حالت، ممکن است شاهد یک موج جدید با ارتفاع 4 باشیم که تخمین زده می شود حدود 27500 باشد. در چند ساعت آینده، میتوان انتظار سیل خریداران FOMO را داشت که در نتیجه در زمان باز شدن بازار در روز سهشنبه، یک پمپ کوچک ایجاد میشود. با این حال، چالش واقعی در اواسط هفته در پیش است. زمانی که معامله معلق نهایی شود، تسلیم عظیمی رخ داد. این به دلیل تخلیه قابل توجه نقدینگی در بازار است زیرا people وجوه خود را به خزانه منتقل می کند. در نتیجه، Bitcoin و Ethereum نیز احتمالاً تحت تأثیر قرار گرفت. بنابراین، بسیار مهم است که احتیاط کنید و از خرید FOMO در هر پمپ اجتناب کنید. هنوز انتظار می رود که هدف ما برای 25300 تا قبل از تسویه بازار محقق شود. لطفاً آگاه باشید و پیامدهای این عوامل را در حین حرکت در نظر بگیرید.
BoredApeYachtClub

با استفاده از داده های سال 2019، من آن را با نمودار فعلی مقایسه کردم و متوجه الگوهای مشابه بسیار زیادی شدم. من از 2019 data برای توضیح آنچه که پیش بینی می کنم در سال 2023 رخ داد استفاده کرد. چندین شباهت در الگوها وجود دارد که قبلاً آشکار شده است، و من تمام تلاش خود را برای توضیح آنچه که فکر می کنم ممکن است رخ دهد انجام داد. اول از همه، بیایید سال 2019 را بررسی کنیم. بازار از پایین ترین سطح خود خارج شد و سه موج صعودی قابل توجه را تجربه کرد، که دقیقاً منعکس کننده حرکت اخیر ما از پایین ترین سطح 15 هزار تا 30 هزار است. در سال 2019 نیز شاهد تشکیل مثلث متقارن در اوج موج سوم بودیم که دقیقاً همان چیزی است که امروز در حال آشکار شدن است. همانطور که از دادههای سال 2019 مشخص است، این مثلث در نهایت شکست و منجر به کاهش شدید به سمت نقطه شروع موج 3 شد. اگر قیمتهای امروزی را اعمال کنیم، این به کاهش تقریباً 20 هزار تومانی تبدیل میشود. در نتیجه، علامت بسیار مورد انتظار 25.3k که بسیاری از people منتظر آن هستند، در صورتی که قصد خرید در آن سطح را داشته باشید، باطل شد. به دنبال این کاهش، ممکن است یک افزایش کوتاه قیمت وجود داشته باشد که احتمالاً به محدوده 23 تا 24 هزار نفر می رسد، اما پس از آن یک افت دیگر به دنبال داشت که احتمالاً ظرف چند روز به زیر 20 هزار کاهش می یابد. در این مرحله، بسیاری تصور می کنند که این کف نهایی است و وارد بازار می شود که منجر به یک فتیله بلند به سمت بالا می شود. با این حال، این حرکت صعودی کوتاه مدت بود و قیمت برای چند هفته کاهش مییابد و پایینترین حد خود را در حدود 17 تا 18 هزار تومان ایجاد میکند. متعاقباً، برای باقی مانده سال، میتوانیم انتظار یک رالی متوسط را داشته باشیم که احتمالاً در حدود 30 هزار نفر به پایان میرسد. پیشبینی میشود که آغاز سال 2024 چالشبرانگیز باشد، با کاهش به پایینترین سطح تاریخ 15 هزار نفر درست قبل از شروع نصف شدن. در روز نصف شدن، انتظار میرود که فروش قابل توجهی رخ دهد و به دنبال آن یک رالی بعدی که قیمت را به بیش از 30 هزار افزایش میدهد. امیدوارم این تحلیل برای شما روشنگر باشد. متشکرم!
BoredApeYachtClub

همانطور که از حرکت به سمت بالا از 25800 می بینید. ما یک الگوی 5 موج به بالا داشتیم. به دنبال ساختار پنج موجی، یک الگوی abc داریم که همین امروز اجرا شده است. ما امروز یک موج c تشکیل دادیم که کمتر از موج a است. تکمیل موج 2 در مقیاس بزرگتر. قیمت هدف بین 28 تا 28.4 هزار برای موج 3 است.
BoredApeYachtClub

بر اساس TD Sequential data ارائه شده، تعداد فعلی در T6 است، که نشان دهنده ادامه روند بالقوه است. با این حال، تجزیه و تحلیل ما نشان می دهد که احتمالاً یک معکوس در اطراف T9 رخ می دهد که تقریباً سه روز دیگر است. این تغییر به طور بالقوه می تواند منجر به کاهش قیمت بیت کوین به حدود 25 هزار یا احتمالاً کمتر شود. توجه به این نکته مهم است که استفاده از اندیکاتورهای اضافی مانند RSI و MACD میتواند تأیید بیشتری از سیگنال برگشت بالقوه را ارائه دهد. نظارت بر این اندیکاتورها در کنار TD Sequential می تواند دقت تجزیه و تحلیل را افزایش دهد و به تصمیم گیری های تجاری آگاهانه کمک کند.
سلب مسئولیت
هر محتوا و مطالب مندرج در سایت و کانالهای رسمی ارتباطی سهمتو، جمعبندی نظرات و تحلیلهای شخصی و غیر تعهد آور بوده و هیچگونه توصیهای مبنی بر خرید، فروش، ورود و یا خروج از بازار بورس و ارز دیجیتال نمی باشد. همچنین کلیه اخبار و تحلیلهای مندرج در سایت و کانالها، صرفا بازنشر اطلاعات از منابع رسمی و غیر رسمی داخلی و خارجی است و بدیهی است استفاده کنندگان محتوای مذکور، مسئول پیگیری و حصول اطمینان از اصالت و درستی مطالب هستند. از این رو ضمن سلب مسئولیت اعلام میدارد مسئولیت هرنوع تصمیم گیری و اقدام و سود و زیان احتمالی در بازار سرمایه و ارز دیجیتال، با شخص معامله گر است.