تحلیل تکنیکال officialjackofalltrades درباره نماد BTC در تاریخ ۱۴۰۴/۱۰/۲

BTCUSDT - Range-Bound at $87K
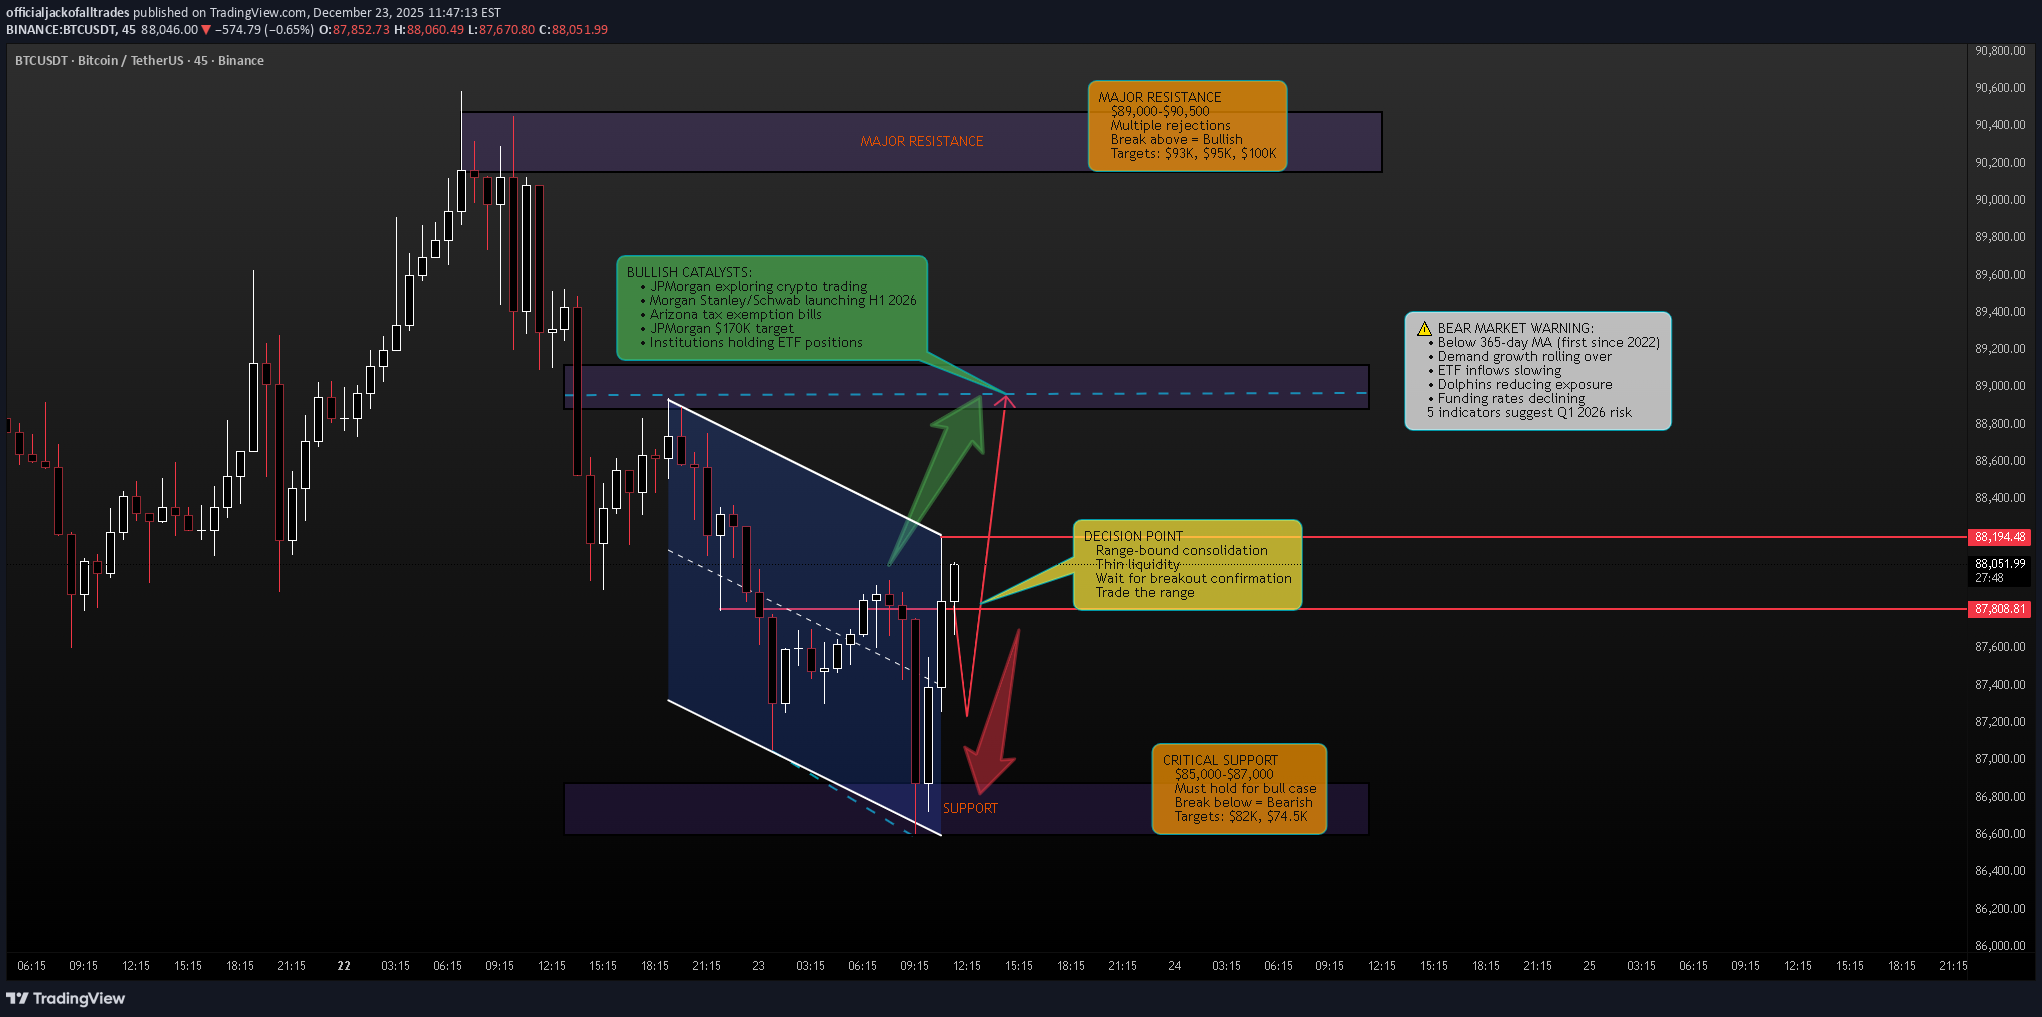
Executive Summary BTCUSDT is trading at approximately $87,740 after a turbulent 2025 that saw Bitcoin hit an all-time high of $126,272 in October before correcting 30%. The price is now stuck in a tight consolidation range between $85,000 support and $90,000 resistance. While short-term metrics show slight recovery (+1.5% weekly, +3.53% monthly), the bigger picture is concerning: YTD performance is -6.25%, and multiple on-chain indicators suggest we may be entering a late-cycle distribution phase with bear market risk in early 2026. BIAS: NEUTRAL TO SLIGHTLY BEARISH - Bullish Potential with Bearish Undertones The short-term structure allows for bullish breakout, but the weight of on-chain evidence and macro factors lean bearish for Q1 2026. Trade the range, respect the levels. Current Market Context - December 23, 2025 Bitcoin finds itself at a critical juncture: Current Price: $87,825.99 (-0.99% on the day) Day's Range: $86,601.90 - $88,940.00 52-Week Range: $74,508.00 - $126,199.63 All-Time High: $126,272.76 (October 6, 2025) Volume: 9.22K (below 30D average of 17.23K) Down 30.06% from ATH Performance Metrics - MIXED: 1 Week: +1.50% (Green) 1 Month: +3.53% (Green) 3 Months: -21.67% (Red) 6 Months: -18.27% (Red) YTD: -6.25% (Red) 1 Year: -7.83% (Red) The short-term green metrics mask a deeply concerning longer-term picture. Bitcoin is underperforming its 2024 and 2023 seasonal patterns significantly. THE WARNING SIGNS - 5 Charts Suggest Bear Market Risk Multiple on-chain and market-structure indicators are flashing caution: 1. Bitcoin's Apparent Demand Growth Is Rolling Over Demand growth slowing after multiple waves earlier in the cycle While price remained elevated through 2025, demand failed to make new highs This divergence indicates price strength relied more on momentum and leverage than fresh spot buying When demand growth flattens while price stays high, markets shift from accumulation to distribution This often marks early stages of a bear market or long consolidation 2. US Spot Bitcoin ETF Inflows Are Losing Momentum ETFs have been the strongest source of structural demand this cycle In 2024, ETF inflows accelerated steadily into year-end Q4 2025 shows inflows flattening and, in some periods, declining ETFs represent long-term capital, not short-term trading When ETF demand slows while price remains high, large buyers are stepping back Without sustained institutional inflows, Bitcoin becomes more vulnerable to derivatives-driven volatility 3. Dolphin Wallets (100-1,000 BTC) Are Reducing Exposure "Dolphins" are typically sophisticated investors and funds Sharp decline in dolphin holdings on a one-year basis Similar behavior appeared in late 2021 and early 2022, ahead of deeper drawdowns This points to risk reduction by experienced holders When this cohort distributes while price remains elevated, it reflects expectations of lower returns ahead 4. Funding Rates Are Trending Lower Across Exchanges Funding rates measure cost to hold leveraged positions Clear downward trend across major exchanges Indicates waning demand for leverage even as price remains relatively high In bull markets, strong rallies are supported by rising funding and persistent long demand Falling funding rates suggest traders are less confident and less willing to pay to stay long This environment often precedes choppy price action or broader trend reversals 5. Bitcoin Broke Below the 365-Day Moving Average The 365-day MA historically separates bull markets from bear markets Bitcoin has now crossed below this level for the first sustained period since early 2022 Previous macro-driven sell-offs in 2024 and early 2025 tested this level but failed to close below it A sustained break signals a shift in long-term momentum Increases probability that rallies will face stronger resistance CRITICAL: None of these signals confirms a full bear market alone. Together, they suggest rising downside risk and weakening support. How Low Could Bitcoin Go? If bear market develops: Bitcoin's realized price is currently near $56,000 (average cost basis of all holders) In prior bear markets, Bitcoin often bottomed near or slightly below this level This doesn't mean Bitcoin must fall to $56,000 But in a full bear scenario, long-term buyers historically step in closer to that zone Wide range of outcomes possible, including prolonged sideways movement rather than sharp decline THE BULL CASE - Wall Street Is Coming Despite the warning signs, major bullish catalysts are emerging: JPMorgan Exploring Crypto Trading Largest US bank considering crypto trading services for institutional clients Assessing spot and derivatives trading products Would represent major evolution for JPMorgan CEO Jamie Dimon has been critical of Bitcoin but bank is expanding blockchain activity In May, Dimon said JPMorgan would allow clients to buy Bitcoin Bank launched tokenized money-market fund (MONY) on Ethereum with $100M initial capital Arranged short-term bond for Galaxy Digital on Solana blockchain Wall Street's Broader Embrace Morgan Stanley offering crypto trading on E*Trade platform (H1 2026) Charles Schwab ($11.6 trillion firm) launching Bitcoin trading (H1 2026) 20% of Schwab clients already own crypto Growing institutional demand as regulatory frameworks clarify Trump administration pledged to make America "crypto capital of the world" JPMorgan Analysts' Price Target JPMorgan analysts projected Bitcoin could climb to $170,000 within 6-12 months Contingent on perpetual futures deleveraging completing Global crypto market valued at ~$3.1 trillion Bitcoin accounts for ~$1.8 trillion Projected to reach new ATH next year as adoption grows Arizona Crypto-Friendly Legislation Senator Wendy Rogers proposed bills to exempt virtual currency from taxation SB 1044: Exempt crypto from state taxation SB 1045: Bar cities/counties from taxing blockchain nodes SCR 1003: Amend constitution to exclude crypto from property tax Arizona already has digital asset reserve law Other states (New Hampshire, Texas) have similar laws Technical Structure Analysis Price Action Overview - 4 Hour Timeframe The chart shows a clear consolidation structure: Current Range: MAJOR RESISTANCE: $89,000-$90,500 zone SUPPORT: $86,600-$87,200 zone Price oscillating between these levels Multiple tests of both zones without sustained follow-through Neither bulls nor bears have full control Equilibrium state - buyers step in near support, sellers defend resistance Recent Price Action: Sharp rejection from ~$90,500 area Price dropped to current ~$87,740 level Testing mid-range support Two scenarios visible on chart: Bullish: Break above resistance toward $89,000+ Bearish: Break below support toward $85,000 Key Observations: Volume below 30-day average (9.22K vs 17.23K) - thin liquidity Range-bound trading suggests indecision Breakout direction will determine next major move Holiday period typically sees lower liquidity, amplifying moves Key Support and Resistance Levels Resistance Levels: $88,940 - Day's high / immediate resistance $89,000-$90,500 - MAJOR RESISTANCE ZONE $92,000-$93,000 - Secondary resistance (breakout target) $95,000 - Psychological level $100,000 - Major psychological barrier $126,272 - All-time high (October 2025) Support Levels: $87,200 - Immediate support $86,600-$87,000 - MAJOR SUPPORT ZONE $85,000 - Critical support (strong demand in early December) $82,000-$83,000 - Secondary support $74,508 - 52-week low $56,000 - Realized price (bear market bottom zone) Chart Pattern Analysis Current structure shows a consolidation rectangle : Clear horizontal support at $86,600-$87,200 Clear horizontal resistance at $89,000-$90,500 Price compressing within this range Breakout imminent - direction TBD Volume declining during consolidation (typical) Watch for volume spike on breakout for confirmation Moving Average Analysis Price trading BELOW 365-day moving average - bearish signal This is first sustained break below 365 MA since early 2022 Short-term MAs may be providing temporary support Long-term trend structure has weakened significantly Rallies likely to face resistance at declining MAs Volume Analysis Current volume: 9.22K (significantly below 30D average of 17.23K) Thin liquidity environment Low volume consolidation typical before breakouts Holiday period reducing participation Watch for volume confirmation on any breakout Low volume moves are less reliable Market Structure Assessment Current State: Range-bound with thin liquidity High sensitivity to leverage-driven moves Retail participation appears cautious Institutional flows have slowed Selling pressure primarily retail-driven from leveraged and short-term participants US spot Bitcoin ETF holdings declined less than 5% despite 30%+ drawdown - institutions holding Expert Analysis - Ray Youssef (NoOnes CEO): "BTC's upside is now tied to liquidity expansion, sovereign policy clarity, and risk sentiment, rather than to monetary debasement alone." "From a market-structure perspective, Bitcoin remains stuck in a compressing, range-bound action bout." Bitcoin has failed to deliver on its hedge narrative in 2025, demonstrating heightened sensitivity to macroeconomic factors rather than trading like digital gold. SCENARIO ANALYSIS BULLISH SCENARIO - Breakout Above $90,000 Trigger Conditions: Daily close above $90,500 with volume ETF inflows resume/accelerate JPMorgan or other major bank announces crypto trading launch Positive regulatory news Break above 365-day MA Price Targets if Bullish: Target 1: $92,000-$93,000 - First resistance above range Target 2: $95,000 - Psychological level Target 3: $100,000 - Major psychological barrier Extended: $170,000 (JPMorgan analyst target for 2026) Bullish Catalysts: JPMorgan crypto trading launch Morgan Stanley E*Trade crypto (H1 2026) Charles Schwab Bitcoin trading (H1 2026) Arizona crypto tax exemption bills Trump administration pro-crypto policies ETF inflow recovery Institutional adoption acceleration BEARISH SCENARIO - Breakdown Below $85,000 Trigger Conditions: Daily close below $85,000 ETF outflows accelerate Funding rates continue declining Dolphin wallets continue distributing Break below 365-day MA confirmed Macro risk-off event Price Targets if Bearish: Target 1: $82,000-$83,000 - Secondary support Target 2: $74,508 - 52-week low Target 3: $65,000-$70,000 - Major support zone Bear Market Bottom: $56,000 area (realized price) Bearish Risks: 5 on-chain indicators warning of bear market Below 365-day MA for first time since 2022 Demand growth rolling over ETF inflows losing momentum Dolphin wallets reducing exposure Funding rates trending lower YTD performance negative (-6.25%) 30% down from ATH NEUTRAL SCENARIO - Continued Range Trading Most likely short-term outcome: Price continues oscillating between $85,000-$90,000 Low volume holiday trading Wait for January 2026 for directional clarity Institutions reassess positions in new year Watch for ETF flow data in early January MY ASSESSMENT - NEUTRAL TO SLIGHTLY BEARISH The evidence is genuinely mixed, but the weight leans bearish: Bearish Factors (Dominant): 5 on-chain indicators warning of distribution phase Below 365-day MA - historically bearish Demand growth diverging from price ETF inflows slowing Sophisticated holders (dolphins) reducing exposure Funding rates declining YTD, 3M, 6M, 1Y all negative 30% down from ATH with no recovery momentum Bullish Factors (Secondary): Wall Street adoption accelerating (JPMorgan, Morgan Stanley, Schwab) Pro-crypto regulatory environment under Trump Arizona tax exemption bills JPMorgan $170K price target Institutions holding ETF positions despite drawdown Short-term metrics slightly positive My Stance: NEUTRAL with Bearish Lean I believe the path of least resistance is sideways to down in Q1 2026. The on-chain data is too concerning to ignore. However, Wall Street adoption could provide a floor and eventually drive recovery. Strategy: Trade the range - buy support, sell resistance Don't get caught in the middle Respect $85,000 as critical support Respect $90,000 as critical resistance Wait for breakout confirmation before directional bets Reduce position size given uncertainty Trade Framework Scenario 1: Bullish Breakout Trade Entry Conditions: 4H candle closes above $90,500 Volume exceeds recent average ETF inflows positive Trade Parameters: Entry: $90,500-$91,000 on confirmed breakout Stop Loss: $88,000 below recent support Target 1: $93,000 (Risk-Reward ~1:1) Target 2: $95,000 (Risk-Reward ~1:1.8) Target 3: $100,000 (Extended) Scenario 2: Range Trade - Buy Support Entry Conditions: Price tests $86,600-$87,200 support zone Bullish rejection candle Volume spike on bounce Trade Parameters: Entry: $86,800-$87,200 at support Stop Loss: $85,500 below support zone Target 1: $89,000 (Risk-Reward ~1:1.5) Target 2: $90,500 (Risk-Reward ~1:2.5) Scale out at resistance Scenario 3: Bearish Breakdown Trade Entry Conditions: 4H candle closes below $85,000 Volume confirmation ETF outflows accelerating Trade Parameters: Entry: $84,500-$85,000 on confirmed breakdown Stop Loss: $87,500 above recent support Target 1: $82,000 (Risk-Reward ~1:1) Target 2: $78,000 (Risk-Reward ~1:2.5) Target 3: $74,500 (52-week low) Risk Management Guidelines Position sizing: 1-2% max risk per trade (reduced due to uncertainty) Thin liquidity = amplified moves - use wider stops Holiday period trading - expect erratic price action Watch ETF flow data closely Monitor on-chain metrics for trend confirmation Don't fight the range - trade within it Scale out at targets rather than all-or-nothing Be prepared for extended consolidation Invalidation Levels Bullish thesis invalidated if: Price closes below $85,000 on daily timeframe ETF outflows accelerate significantly Funding rates go deeply negative Dolphin distribution accelerates Break below 52-week low ($74,508) Bearish thesis invalidated if: Price closes above $93,000 with volume ETF inflows surge Reclaim 365-day moving average JPMorgan announces crypto trading launch Major institutional adoption news Conclusion BTCUSDT is at a critical juncture. After hitting an all-time high of $126,272 in October 2025, Bitcoin has corrected 30% and is now stuck in a consolidation range between $85,000 and $90,000. The Concerning Data: 5 on-chain indicators warning of potential bear market in 2026 Below 365-day MA for first time since 2022 Demand growth diverging from price ETF inflows losing momentum Sophisticated holders reducing exposure YTD: -6.25%, 3M: -21.67%, 6M: -18.27% The Hopeful Data: JPMorgan exploring crypto trading Morgan Stanley, Charles Schwab launching crypto in H1 2026 Arizona crypto tax exemption bills JPMorgan analysts target $170,000 Institutions holding ETF positions despite drawdown Key Levels: $90,000-$90,500 - MAJOR RESISTANCE (breakout level) $86,600-$87,200 - MAJOR SUPPORT (current test) $85,000 - CRITICAL SUPPORT (must hold) $70,000 - Realized price (bear market bottom zone) The Setup: Bitcoin is range-bound with thin liquidity. The on-chain data suggests we may be in a late-cycle distribution phase with bear market risk in early 2026. However, Wall Street adoption is accelerating, which could provide a floor. Strategy: Trade the range - don't predict the breakout Buy $86,600-$87,200 support with stops below $85,000 Sell $89,000-$90,500 resistance Wait for confirmed breakout before directional bets Reduce position size given mixed signals Watch January 2026 for clarity The market is at a decision point. Let price action guide you, not predictions.