تحلیل تکنیکال vagada درباره نماد BTC : توصیه به فروش (۱۴۰۴/۸/۱۸)

vagada
الگو تکرار میشود؟ ریزش ۳۳ درصدی بیت کوین به کف قیمتی کجاست؟
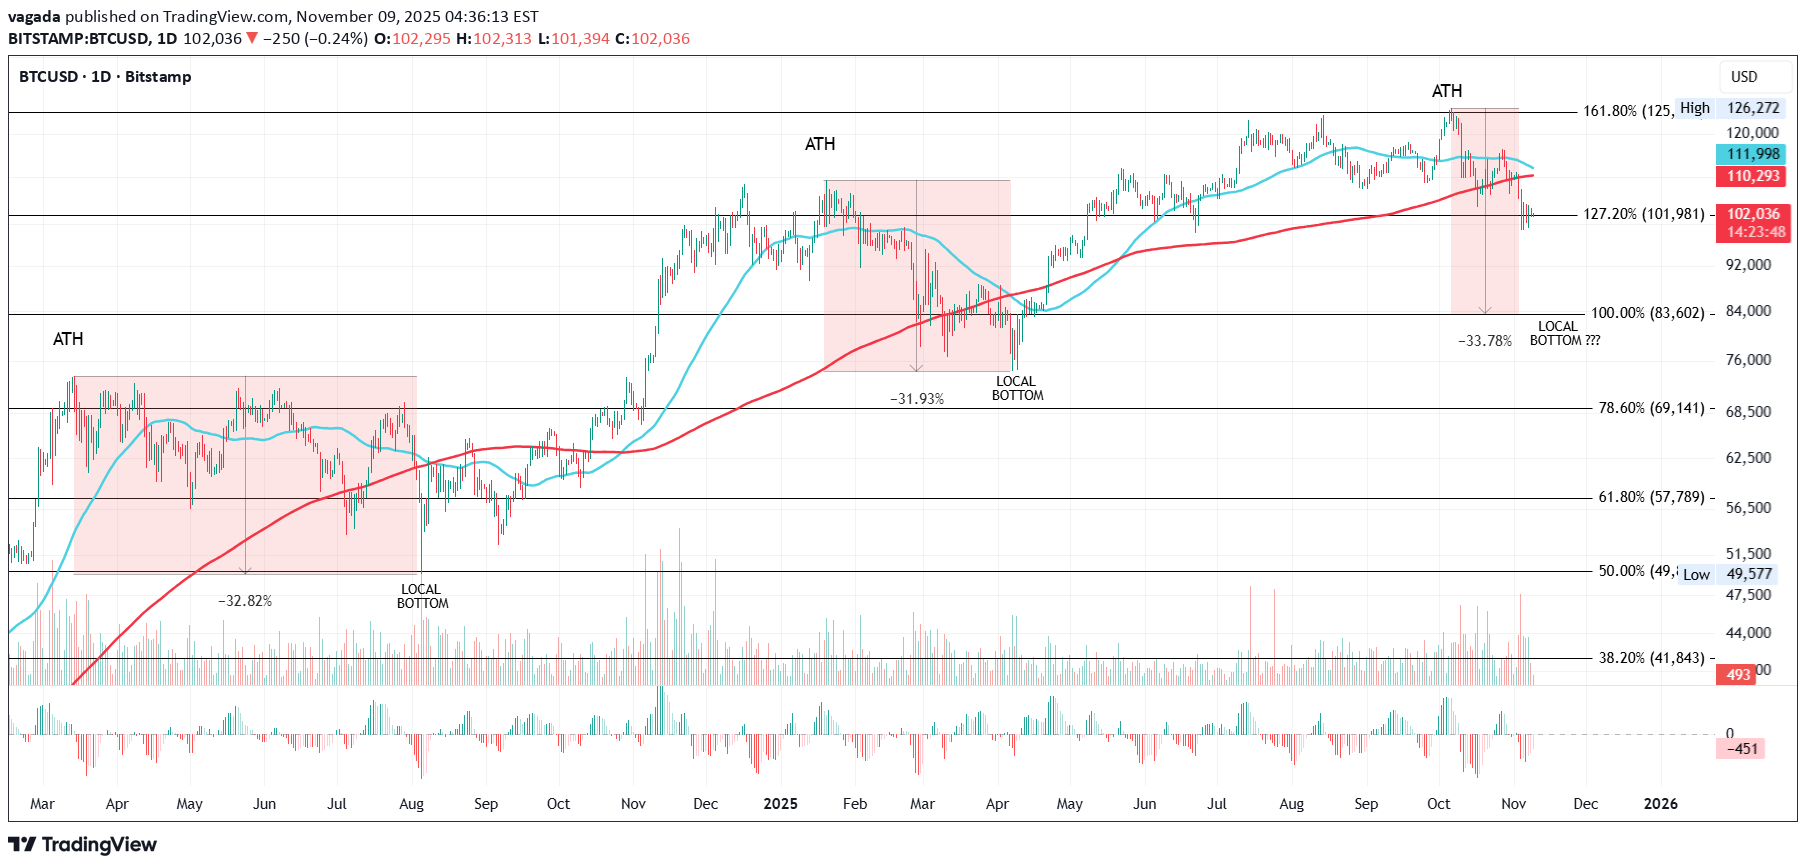
Potential Local Bottom Ahead? Overall Outlook: I'm tracking a recurring pattern in Bitcoin's price action following each all-time high (ATH), involving sharp drops, interactions with the 50-day and 200-day moving averages (MAs), and key Fibonacci levels. This has played out twice before in this cycle, and we're now in the midst of what could be the third iteration. The setup suggests a potential further drop of around 33.78% from the latest ATH, targeting the 100% Fib level for a local bottom, possibly timed near a death cross. If this holds true, it could signal a strong buying opportunity at the bottom, as price has historically reversed and rallied hard afterward. For now, the theory looks promising, but I'll update this idea as events unfold. Key Pattern and Historical Observations: This analysis focuses on a consistent post-ATH correction structure that's emerged in Bitcoin's daily chart over the past couple of years. It typically involves: A new ATH breaking above a key Fib extension level. A subsequent drop of 31-33%, crossing under the 50MA and 200MA. Bottoming near a lower Fib level (often 2 levels below the ATH breakout point), with timing influenced by the death cross (50MA crossing under 200MA). Post-bottom recovery: Choppy ups and downs, reclaiming MAs and Fib levels, leading to the next leg up. Let's break it down by each ATH in the series: First ATH (March 2024): Peaked at $73,794, right above the 78.60% Fib level. This was followed by a 32.82% drop to a local bottom at $49,577. Price action dropped 2 Fib levels to land at the 50% Fib, after crossing under both the 50MA and 200MA. Notably, the local bottom formed just days before the death cross occurred, suggesting the cross could help time reversals. From there, recovery wasn't immediate, price pushed up, hit resistance at the 200MA, dropped, rallied again, and repeated this process. Eventually, it found support at the 50MA and pushed over the 200MA. This consolidation phase lasted from March to August 2024 before the uptrend resumed. Second ATH (January 2025): Hit $109,356, breaking above the 127.20% Fib level. Similar to the first, it dropped 31.93% to a local bottom at $74,434 and again, 2 Fib levels lower, landing close to the 78.60% Fib (which was key in the prior ATH). This time, the bottom came shortly after the death cross, flipping the timing slightly from the previous instance (after vs. before). Post-bottom, price reclaimed the next Fib level and the 50MA, then crossed the 200MA and held strong without looking back, all the way until October 2025. Third ATH (Early October 2025): Reached $126,272, just above the 161.80% Fib level. Following the pattern, but accelerating faster this time, price has already dropped under the 200MA and found at least temporary support at the 127.20% Fib level. Current Setup and Open Questions: Based on the prior two ATHs, this third one raises two key questions that could define the next move: Will price drop to the next lower Fib level? That would mean targeting the 100% Fib, implying a total drop of around 33.78% from the $126,272 ATH (putting the local bottom somewhere near $83,600, give or take based on exact Fib anchoring). Will a death cross mark the bottom? In the first case, the bottom was days before the cross; in the second, shortly after. Watching for an impending death cross could help time the reversal in real time. If the pattern repeats, we're likely in the early stages of the correction, with more downside before the bottom forms. This setup has a good chance to play out given the historical parallels, offering a prime spot to buy the dip once the local bottom confirms. I'll keep this idea updated as price action develops, especially monitoring Fib interactions, MA crosses, and any signs of reversal. Potential Trade Considerations: Watch Zones: Resistance: 161.80% Fib ($126,272, prior ATH) and 200MA for any failed retests. Support Targets: 127.20% Fib (current temp support), then 100% Fib for the potential local bottom (~33.78% drop zone). Entry Idea: No aggressive positions yet, wait for signs of bottoming near the 100% Fib or around a death cross. If confirmed, long entry on reversal signals (e.g., bullish candle above 50MA). Risk Management: Set stops below key Fib supports. Target post-recovery upside to prior ATH or higher Fib extensions. Invalidation: A quick reclaim of the 200MA without further drop could break the pattern, shifting to bullish continuation. External Factors: While the technicals are strong, BTC in late 2025 is heavily influenced by US macros, which could amplify or disrupt this post-ATH drop pattern. For instance: Ongoing Government Shutdown: The US federal government has been shut down since October 1, 2025, making this the longest shutdown in history (now at 39+ days as of Nov 9). It's causing widespread disruptions, including halted SNAP benefits for millions, delays in airport operations due to air traffic controller shortages, increased reliance on food pantries by military families, and broader economic strain like reduced tourism and spending ahead of Thanksgiving. Negotiations are stalled, with Senate Republicans pushing for votes to reopen but Democrats holding out for extensions on ACA tax credits. This uncertainty could weigh on risk assets like BTC, potentially accelerating the expected 33.78% drop if it drags on and hurts consumer confidence or triggers a recessionary vibe. On the flip side, a quick resolution might spark a relief rally, shortening the correction phase. Fed's Stance on Rate Cuts: There's no FOMC meeting in November, so no rate cut then. For December, Fed Chair Powell emphasized after the October 29 quarter-point cut (bringing the fed funds rate to 3.75%-4%) that another reduction is "not a foregone conclusion" and depends on incoming data. Internal divisions are evident: some officials like Beth Hammack and Lorie Logan question further easing, citing a resilient economy and risks of reigniting inflation. The shutdown is complicating this by blocking key data releases (e.g., jobs reports), which Powell likened to "driving in the fog." If no cut happens in December, it could pressure BTC lower in the short term by signalling tighter policy, aligning with a deeper Fib target. But if data softens dramatically (e.g., due to shutdown effects), a surprise cut might catalyze the bottom and reversal. Ending QT and Potential QE Shift: The Fed announced it will end quantitative tightening (QT) on December 1, halting the balance sheet runoff and instead rolling over maturing Treasuries to hold holdings steady at around $6.6 trillion. This addresses tightening money markets and funding strains, but it's not yet quantitative easing (QE), it's more of a pause to maintain ample reserves rather than active expansion. Some analysts speculate this could pave the way for QE resumption if economic conditions worsen (e.g., prolonged shutdown or labour market cooling), potentially starting in December or early 2026. For BTC, ending QT removes a liquidity drain, which is bullish long-term and could support post-bottom rally. If QE kicks in sooner, it might act as rocket fuel, shortening the correction and pushing toward new ATHs faster, but watch for inflation risks that could prompt hawkish pushback. If you like this idea, feel free to leave a comment, boost, or share your thoughts. Remember, this is not financial advice; trade responsibly! Always take profits and manage risk! Interaction is welcome in the comments!BTCUSD – Death Cross in Motion, Watching the 0.5 Fib for a Local Bottom Update for November 17, 2025 Since last week, Bitcoin has been moving in the expected direction: down. Today, two important developments are happening that could pause or even reverse the move in the short term. 1. The 50MA is crossing below the 200MA, creating a death cross. 2. Price is approaching the 0.5 Fibonacci retracement level at 92,792 dollars, an area that acted as strong support in December 2024 and again in January and February 2025. Both events together create a potential zone of stabilization. From here, I am tracking two possible scenarios. Scenario 1 – Short Term Bounce Price bounces from the 0.5 Fib and moves toward the 127.20 percent extension at 101,981 dollars. This would be consistent with the past two cycles, where a death cross formed near a temporary bottom and produced a short-term rally before the next move. Scenario 2 – Deeper Pullback If the 0.5 Fib support breaks, price could move toward the 100 percent Fibonacci level near 83,602 dollars. This would complete a two-level Fib drop from the recent ATH, which is exactly what happened after the previous two ATHs in this cycle. Any fakeout at these levels can strengthen the opposite move, so this area requires extra caution. Death Cross Timing Observation In this cycle, each death cross has lasted roughly half as long as the previous one. After the March 2024 ATH: around 80 days. After the December 2024 ATH: around 46 days. If the pattern continues, this one could last around 23 days, which points to early December as a possible moment for a local bottom or stabilization. Weekly Structure On the weekly chart, BTC has lost the 50-week MA as support for the first time in this entire cycle. Historically, when this happened, price eventually tested the 200-week MA before resuming the macro uptrend. The 200-week MA is currently near 55,000 dollars and rising, and remains an important long-term level. Main Thesis Bitcoin continues to follow the same post-ATH correction structure that appeared after the previous two all-time highs in this cycle. Each time, price dropped around 31% to 33% moved below both the 50MA and 200MA, and bottomed two Fibonacci levels below the breakout. The death cross tended to occur just before or just after the local bottom. After reclaiming the MAs and Fib levels, price entered the next leg of the macro uptrend. If this structure repeats a third time, we could be approaching the early phase of a local bottom forming sometime into early December. Key Levels 127.20 percent Fib: 101,981 dollars 0.5 Fib: 92,792 dollars 100 percent Fib: 83,602 dollars 50-week MA: around 102,855 dollars Bias Neutral to bearish in the short term Cautiously bullish in the medium term Awaiting confirmation of a local bottom at the 0.5 Fib or the 100% Fib Final Note If the pattern repeats, we may be entering the final phase of the correction. This is usually the moment where fear peaks and opportunity begins to form. I will continue to update this idea as the death cross develops and as price approaches the major Fibonacci levels.