
trader_34586
@u_78328

What symbols does the trader recommend buying?
Purchase History
پیام های تریدر
Filter
trader_34586
It is possible that the price correction will continue up to 430 Tomans. 🔹 But if a strong monthly sales report is published, it can mark the end of the correction in the same range and the next wave of ascent (towards 480 and then 530 Tomans) will begin. 🔹 If the support of 430 is lost for any reason, a deeper correction to 400-385 Tomans is possible
trader_34586
#Technology #monthly_activity_report #period_of_1_month ending 06/31/1404 #Tosun_Fan_Fazar_Development Company ▪️ Tusan Technology Development Company has sold an amount equal to 3,066,042 million Rials during the performance of 1 month ending on 06/31/1404, which has grown by 23% compared to the same period last year. ▪️ Fanfare with a registered capital of 4,000,000 million Rials during the 9-month performance of the financial year ending on 09/30/1404 had a sales income of 31,300,605 million Rials, which has grown by 71% compared to the same period of the previous year. 07-07-1404 10:02:48
trader_34586
I shop from Tuesday to Wednesday The extremely heavy report of Mehr Fanfarz will come on Kodal on Wednesday evening
trader_34586
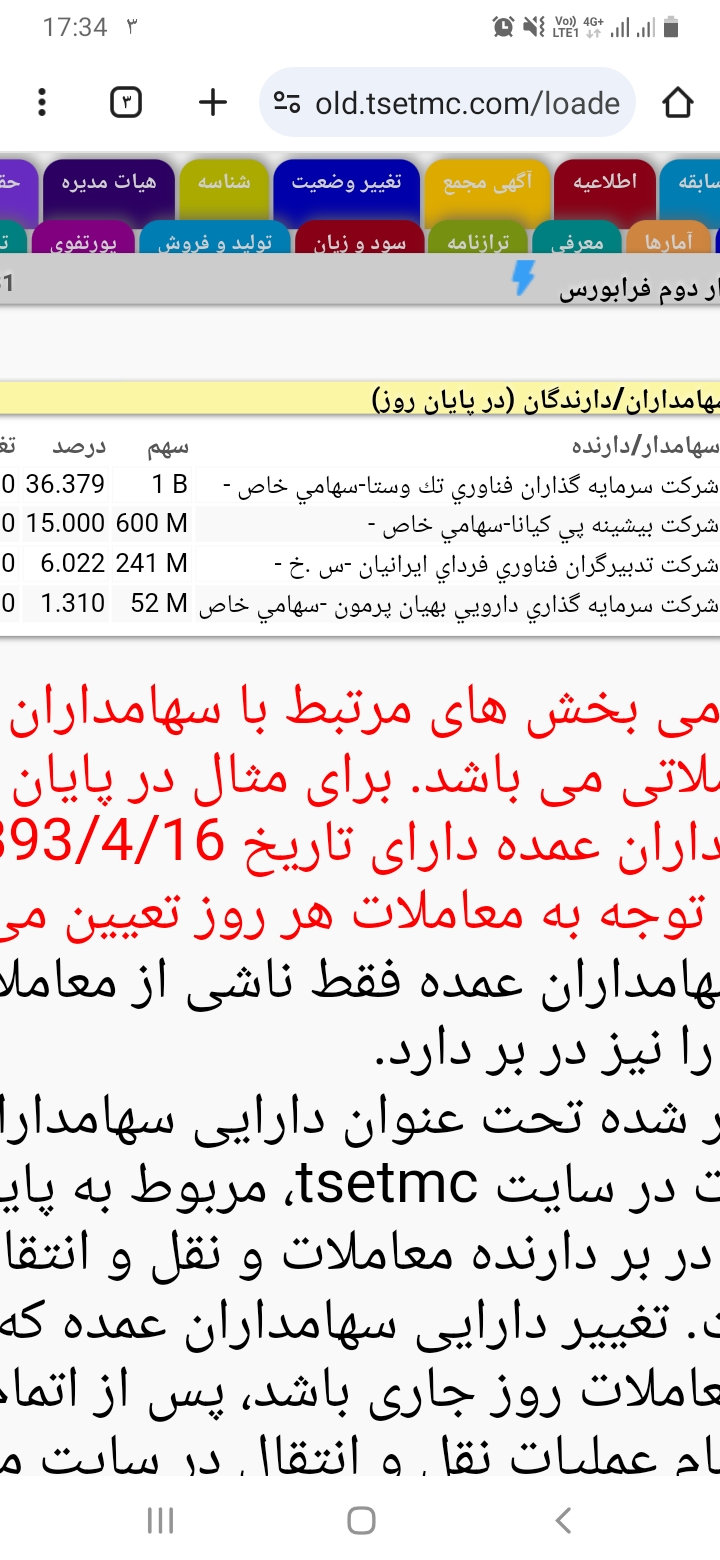
As long as Mazaheri does not increase his company's share of Pi Kiana to 20% of Fanfar, let alone this pressure to sell. be sure He is collecting the share in the shoes.
trader_34586
Based on the behavior of the board, the recent four-month transactions, the daily and weekly charts that you sent, and the basic data (increase in inventory and extension of the assembly), I prepared for you a three-stage accumulation map of the CEO and game maker of Fanfare. This model is a combination of table reading analysis + technical + psychology of the actor. 🧩 Three-stage accumulation map of Fanfarz CEO The first phase - hidden accumulation (June to August 1404) Specifications: High transaction volume in the range of 350 to 420 Tomans Strong selling pressure by the real codes, while the legal ones were the main buyers. MACD and RSI indicators are at the bottom and without growth reaction. 🔸 The actor's goal at this stage: Collecting stocks from desperate realtors and keeping the price low before issuing a capital increase license. 🔹 The current status of the maximum ownership of Pi Kiana at the end of this phase was probably about 5 to 8 percent of the company's total shares. The second phase - stabilization and control (September to November 1404) Specifications: The price fluctuates between 400 and 480 Tomans. The volume of transactions has increased in a targeted manner, but the buying and selling queues are artificial. Technical indicators show positive divergence (it is clearly visible in the charts you sent). The one-month extension of the assembly happened exactly in this phase. 🔸 The actor's goal at this stage: Increase ownership to full dominance (probably 10-12%). Prevent premature growth until assembly. Deceit the market with a queue of fake sales until the final collection at the floor of 435-440 Tomans. 🔹 Sign of the end of the second phase: A noticeable decrease in the volume in the sales queue, the arrival of a high volume of purchases in three consecutive days, and the price crossing 480 Tomans. The third phase - release and growth (from the second half of November to December 1404) Expected specifications: Exiting the Ichimoku cloud range in the weekly timeframe and stabilizing above 500 Tomans. A sharp increase in the volume of daily transactions and the arrival of new money. The beginning of an upward wave up to the ranges of 620 to 700 tomans (mid-term goal). Key event: Holding a capital increase meeting and publishing new financial reports (second half year profit with the effect of loan settlement). At this stage, the limited supply player grows to control, but the share is on the path of Sharpie's rise. 📈 Summary for your investment decision Suggested item, current position, end of the second phase (stabilization), appropriate action, no sale - step purchase below 440 Tomans, patience time frame, 4 to 6 weeks, next price target, 620 to 700 Tomans (mid-term range), risk to return ratio, about 1 to 3 (10% drop risk, +30% growth potential)
trader_34586
The result of behavioral analysis The current pattern is: "The CEO scoops up the stock on the cheap, delays the rally to stabilize ownership, then executes the capital increase, and the stock price jumps at the next open." This behavior has been seen many times in the Iranian stock market in similar shares (such as Ranfur and Madaran in the past).
trader_34586
For the past 4 months, under the constant pressure of selling the game maker Fanfar, the share has been transferred from the real shareholder to Bishine P. Kiana and the managing director has extended the date of the meeting by another month to collect more shares.
trader_34586
By extending the meeting, Fan_Fazar deliberately created a space to collect shares, and with sales pressure and a fictitious sales queue of 44 million, he is seeking to collect more shares from the real shareholders and transfer them to the legal shareholder Mr. Mazaheri.
trader_34586
Wait for the super heavy reports of the sale of the hardware. Until the 7th of November, the sales report of Mehr month sat on Kodal, and after that, the super heavy sales reports of November and Azar, the company's sales in the last quarter of the financial year reached more than 1500 billion tomans.
trader_34586
According to the order of the assembly, the total number of shares of the company increased from 60 billion shares to 180 billion shares soon with a 200% capital increase from the accumulated profit.
Disclaimer
Any content and materials included in Sahmeto's website and official communication channels are a compilation of personal opinions and analyses and are not binding. They do not constitute any recommendation for buying, selling, entering or exiting the stock market and cryptocurrency market. Also, all news and analyses included in the website and channels are merely republished information from official and unofficial domestic and foreign sources, and it is obvious that users of the said content are responsible for following up and ensuring the authenticity and accuracy of the materials. Therefore, while disclaiming responsibility, it is declared that the responsibility for any decision-making, action, and potential profit and loss in the capital market and cryptocurrency market lies with the trader.