zanefleming
@t_zanefleming
What symbols does the trader recommend buying?
Purchase History
پیام های تریدر
Filter
Signal Type

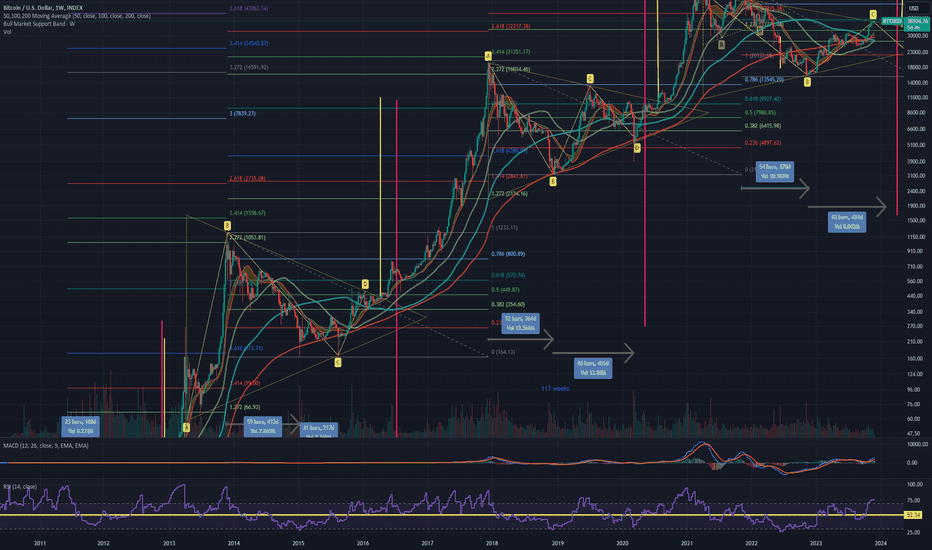
I've had this big picture Bitcoin look charted out for awhile, but today I noticed a pattern I hadn't seen before. First, let me run through the patterns I've noticed - 1. Every cycle seems to fit into its own symmetrical triangle patterns, starting back in 2011. From the previous cycle peaks, entering into the bear markets, the highs and lows contract until there is a breakout, signaling the next cycle. 2. The red line identifies the Bitcoin halving dates. The breakouts from the triangle patterns always seems to happen around the halving dates (slightly before or slightly after, keeping in mind that this is a weekly chart so "slightly" can mean multiple weeks). 3. Fibonacci extension targets. This is trickier, because as time goes on, and Bitcoin matures and reaches homeostasis in its price evaluation in dollar terms, targets will likely diminish. You'll notice that the first two cycles, with a fib level applied from the high to the low in the bear market, Bitcoin reached the 2.272 levels in 2013 and 2017. However, last cycle, Bitcoin only managed to touch the 1.618 golden ratio level (although it tapped it twice, in early 2021 and late 2021). Does that mean that this cycle, beginning after the 2024 halving, will diminish even further? The 1.618 fib level and triangle breakout target both peak just past the 1.618 fib level at $175,000. I would suggest that this either this is a likely target, or following fib level diminishing returns, perhaps the 1.414 ($129,000) or 1.272 ($104,000) levels are accurate for this next bull market. Time will tell. 4. For what's its worth, in every full cycle of Bitcoin (discounting the 2011 shortened cycle), there have been two bottoms before the next bull market kicked off. In 2015, there was a double bottom in January and in August. Before the 2020 bull market, there was a low in December of 2018, and a higher low in March of 2020. With that in mind, there is the possibility of another double bottom or higher low before we break out of the current triangle pattern. In 2015, there was a total of 90 weeks between the previous cycle high and the final low. In 2020, there was a total of 117 weeks between the previous cycle high and the final higher low. Currently, we are at week 107 from the previous cycle high (October 2021). 5. Finally, and this is the new pattern I noticed, is that every triangle breakout thus far has happened around the 0.618 golden ratio. With that in mind, I would anticipate the price of Bitcoin to be around $39,000 by next year's halving in April. Do with this information what you will. Personally, I am preparing for another Bitcoin drop (probably a higher low from $15k) because there are some indicators in the broader economy that do not look promising. However, there's also a chance we won't get it. Hope this analysis helps!
Disclaimer
Any content and materials included in Sahmeto's website and official communication channels are a compilation of personal opinions and analyses and are not binding. They do not constitute any recommendation for buying, selling, entering or exiting the stock market and cryptocurrency market. Also, all news and analyses included in the website and channels are merely republished information from official and unofficial domestic and foreign sources, and it is obvious that users of the said content are responsible for following up and ensuring the authenticity and accuracy of the materials. Therefore, while disclaiming responsibility, it is declared that the responsibility for any decision-making, action, and potential profit and loss in the capital market and cryptocurrency market lies with the trader.