
xugina78
@t_xugina78

What symbols does the trader recommend buying?
Purchase History
پیام های تریدر
Filter
Signal Type
xugina78
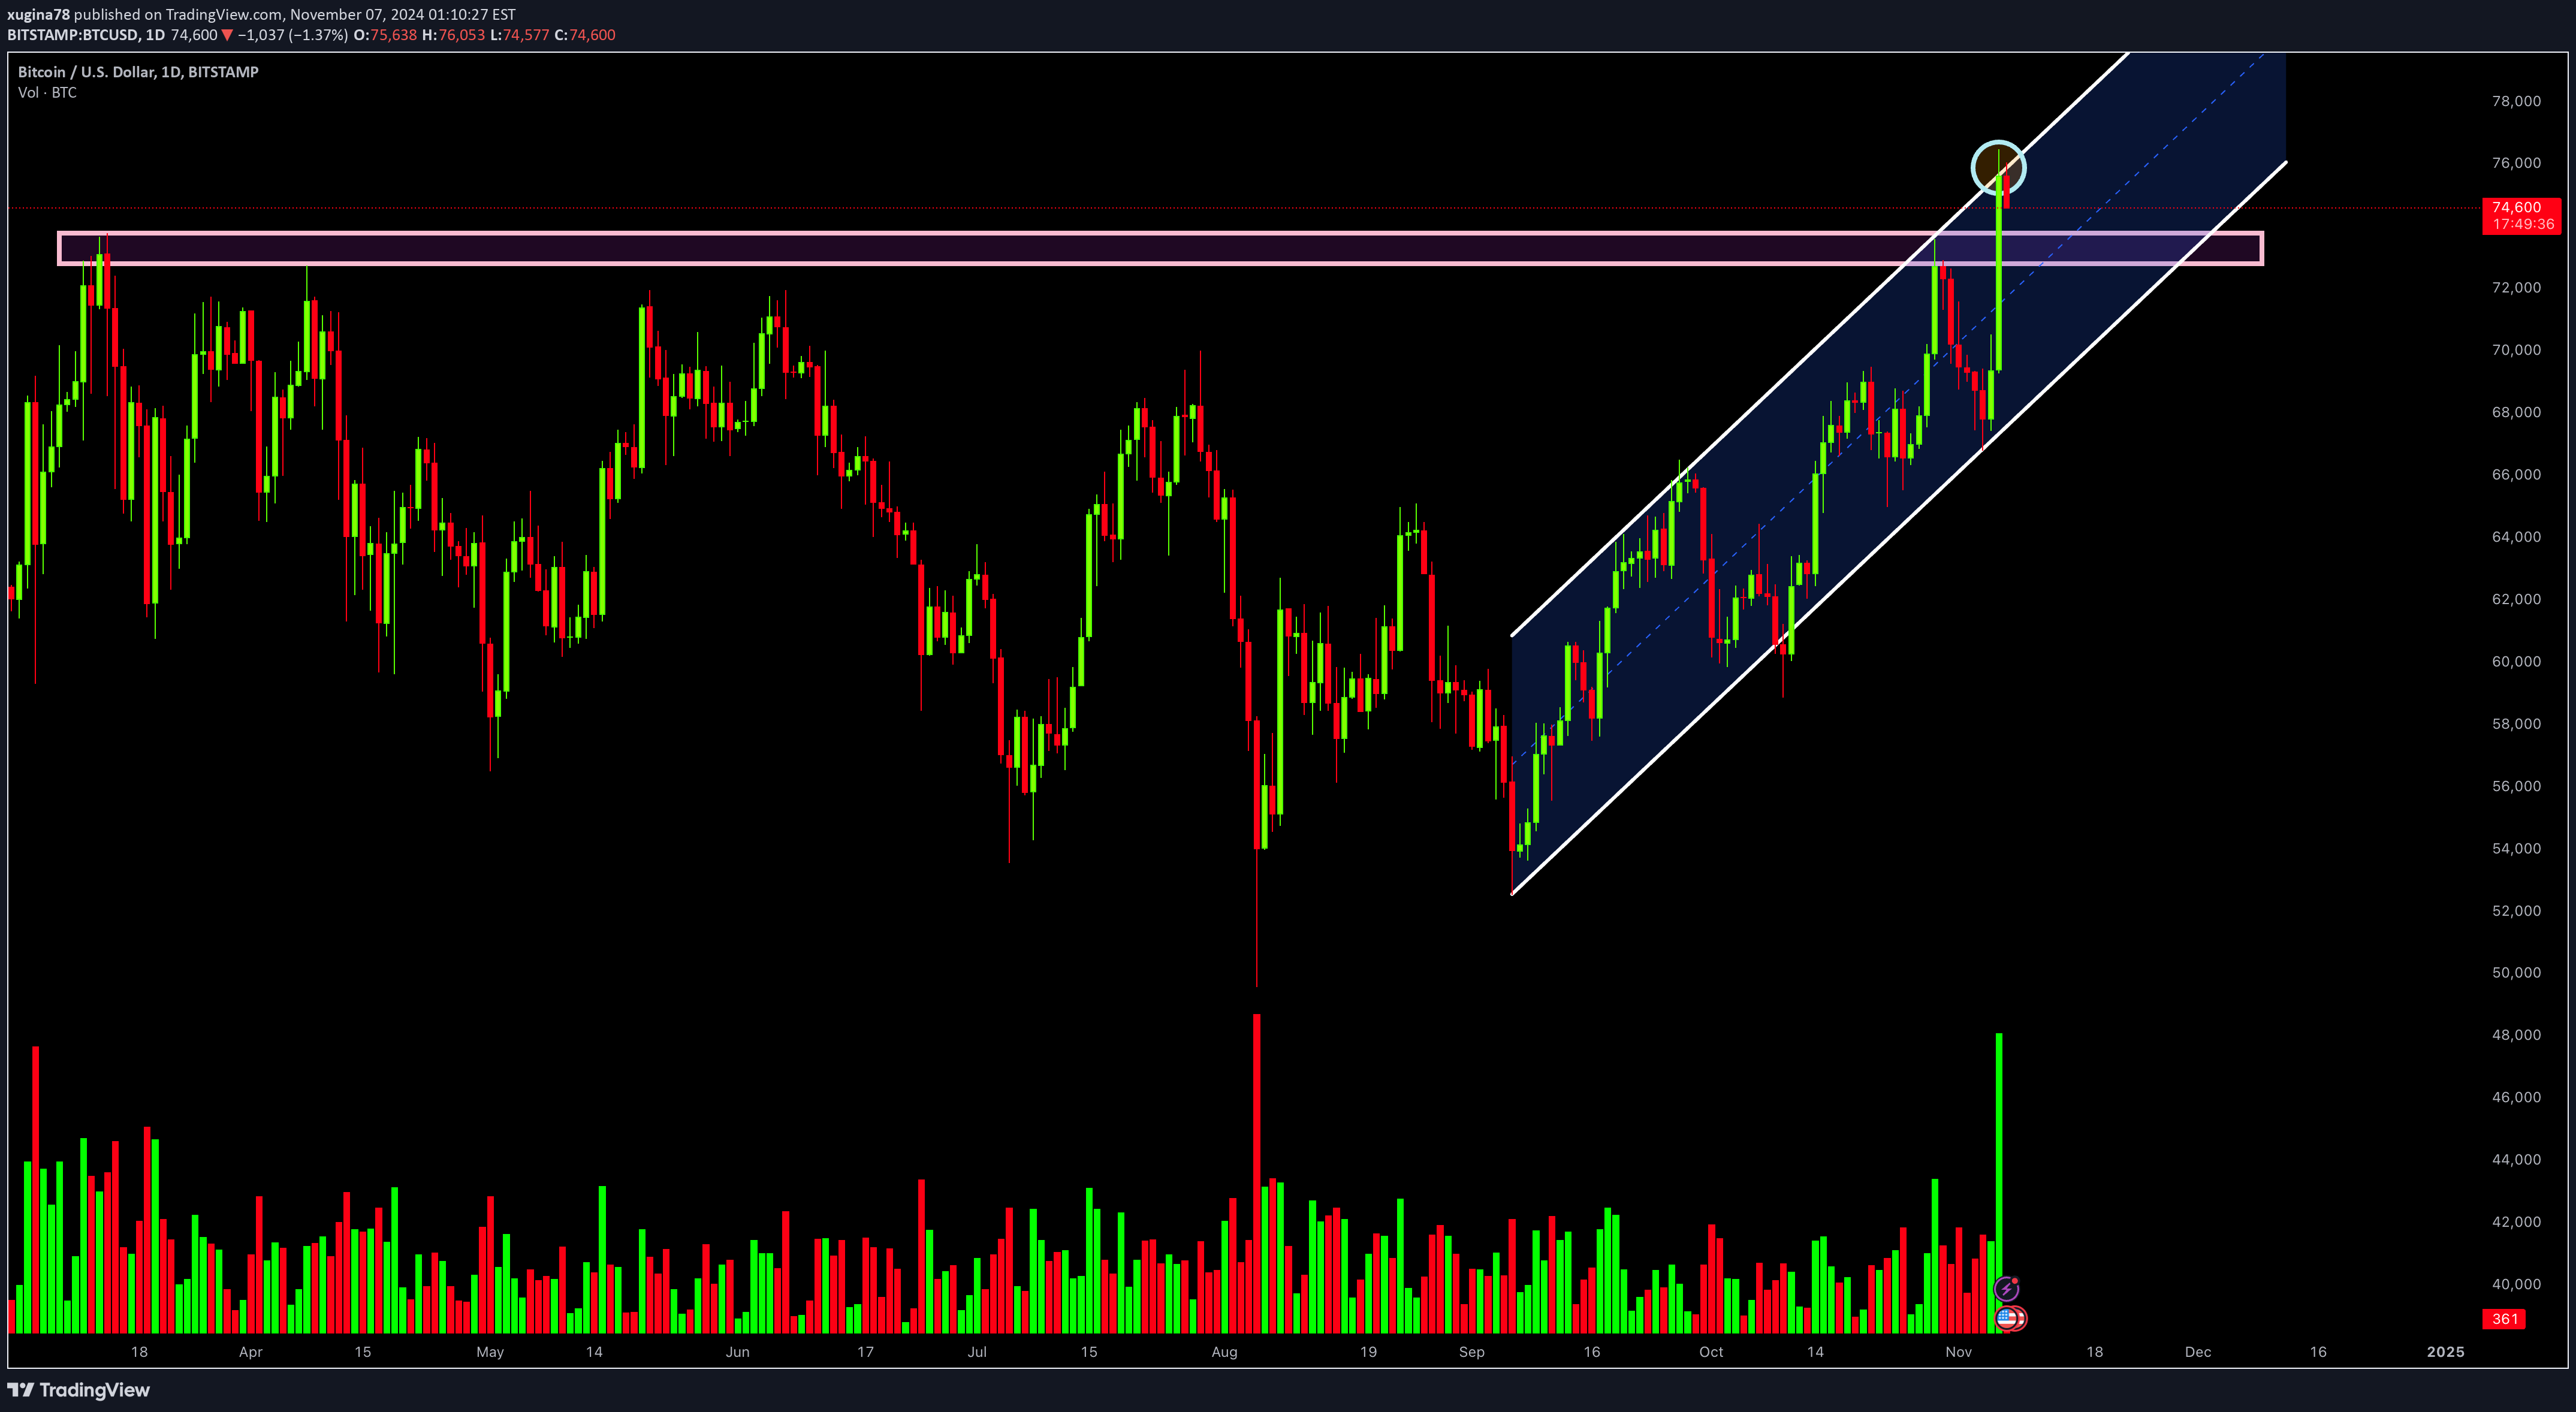
My answer to the topic is that BITCOIN might have a short-term pullback from technical analysis. BTCUSD soared 9% yesterday since Trump won the presidential election. And then, it be rejected by the resistance level of the bullish channel upper edge. Therefore, the price might continue to go up after a short-term pullback. And the support level for this pullback could be previous high area.
xugina78
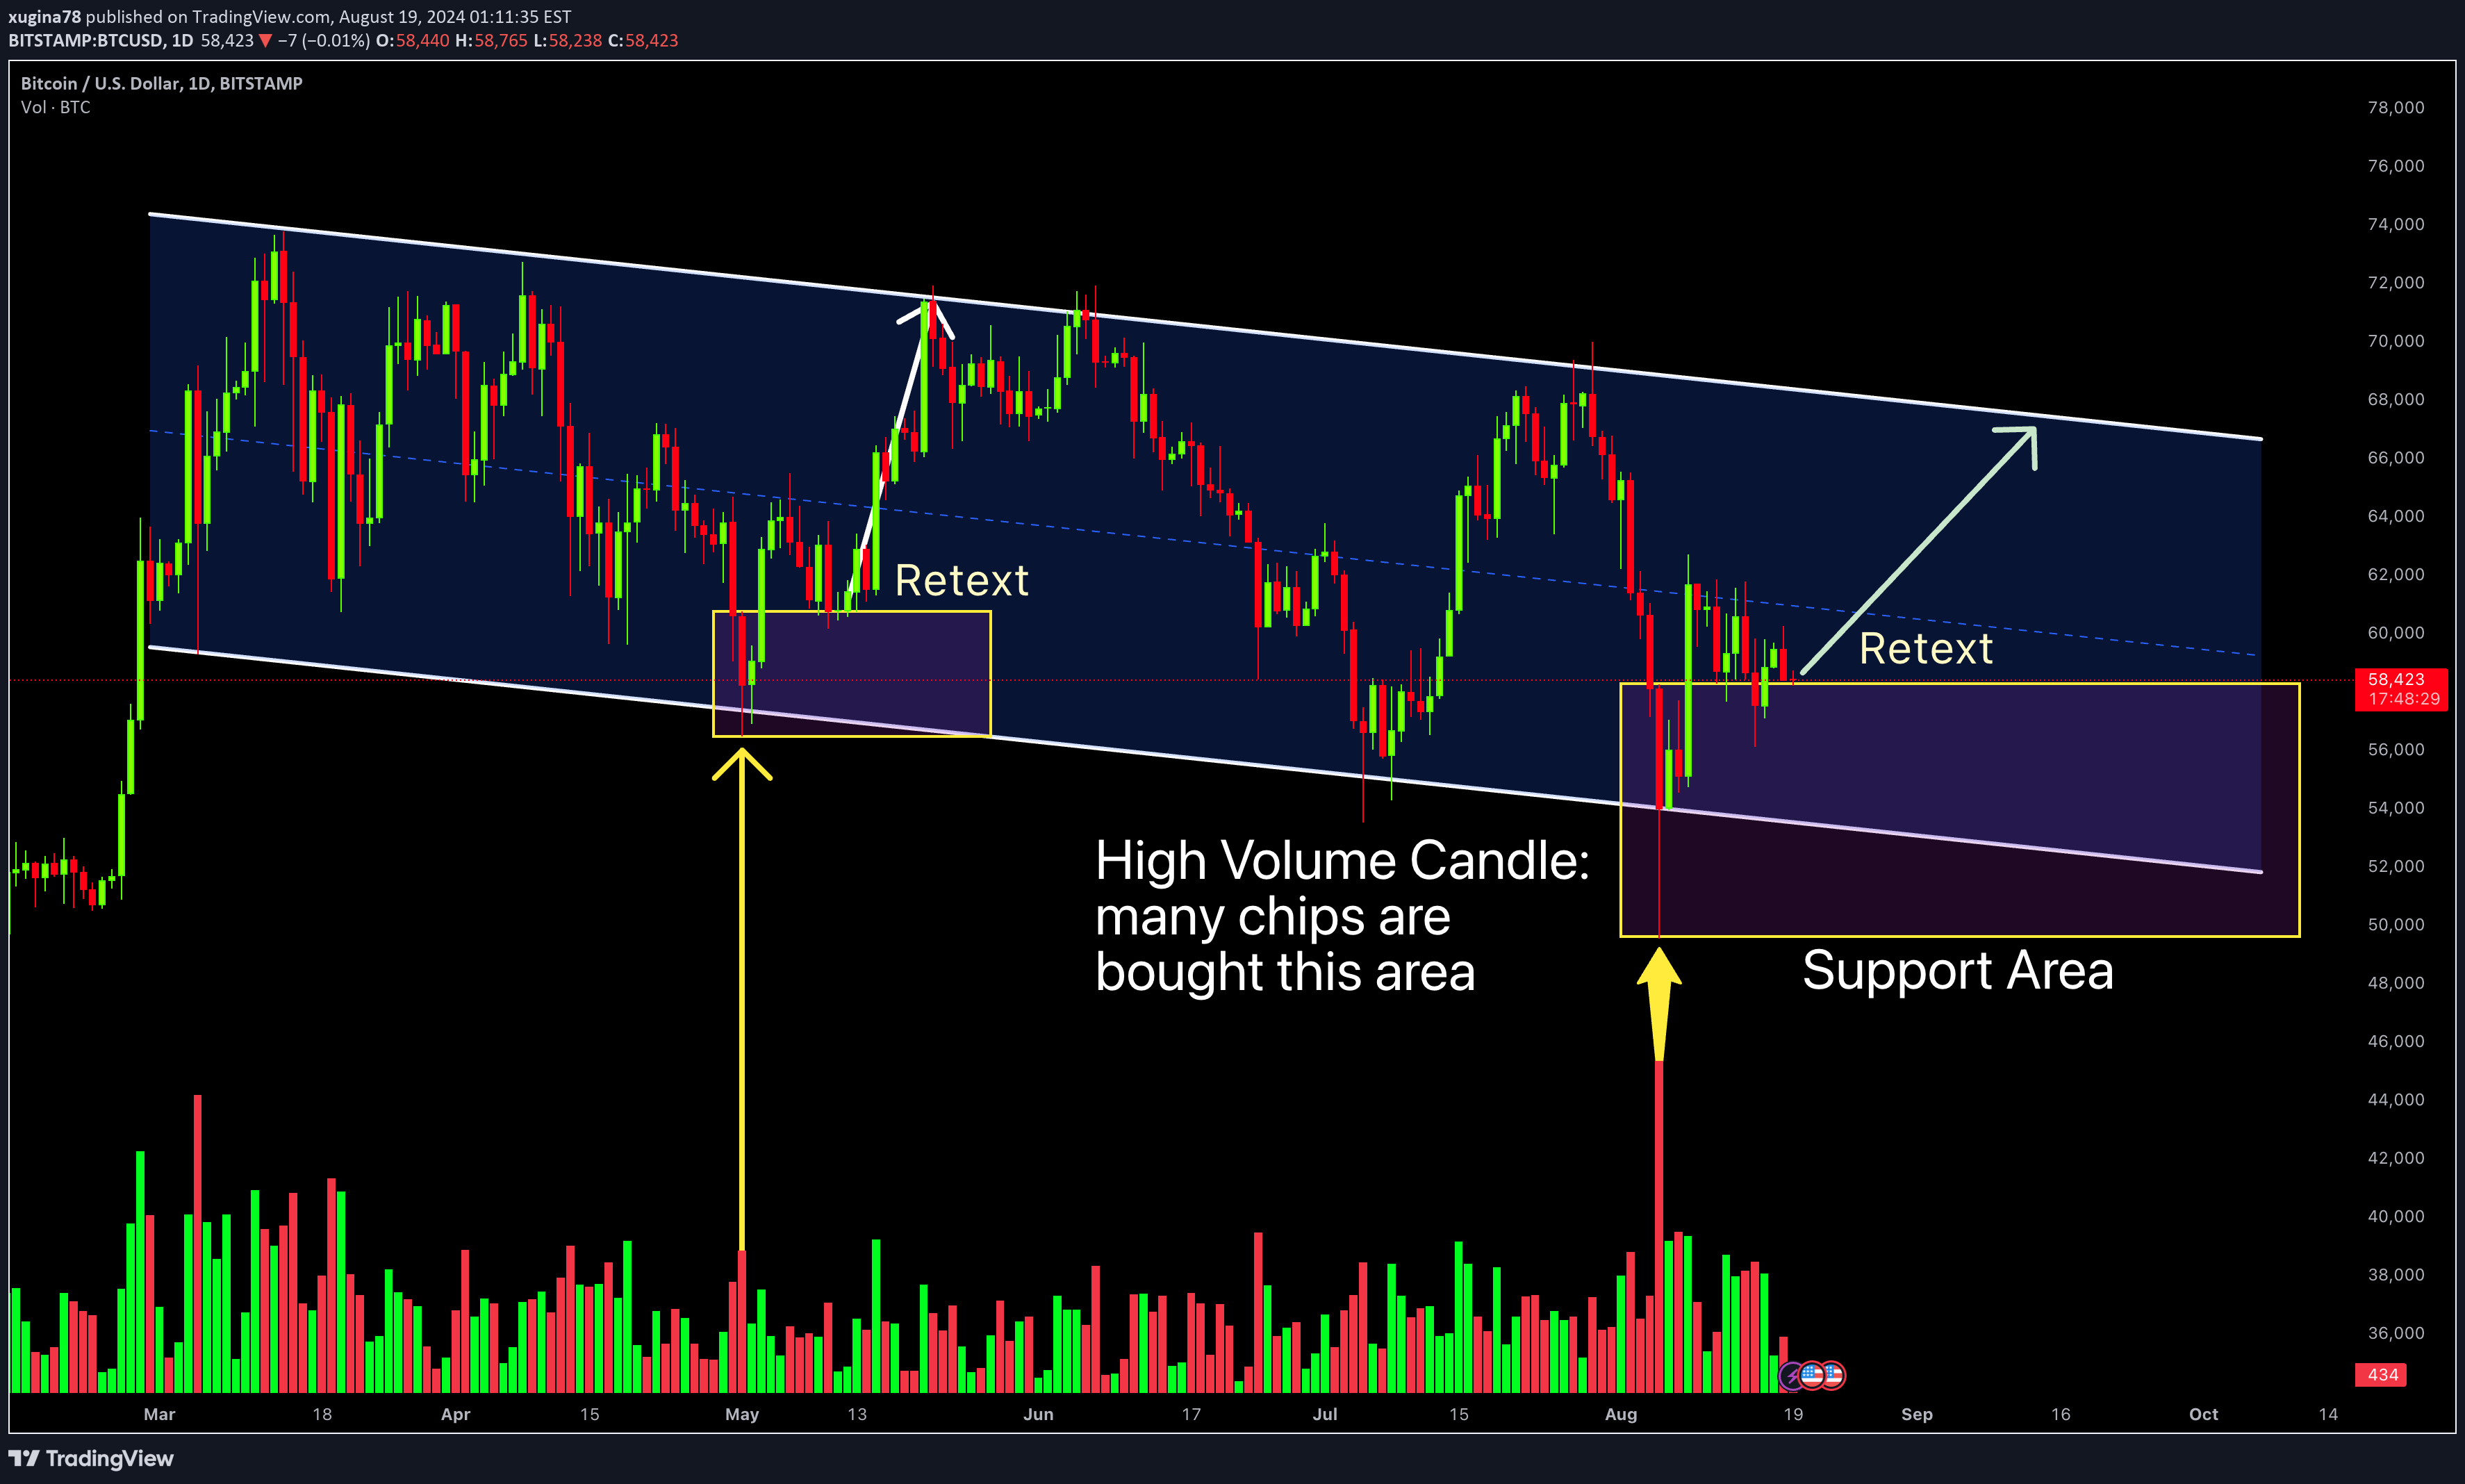
Bitcoin was supported by the lower band of the bearish channel, and moving to the upper band. The price now is retesting the support area from high volume candle, just like what happened on previous low. It might go bullish next if it could be supported.
xugina78
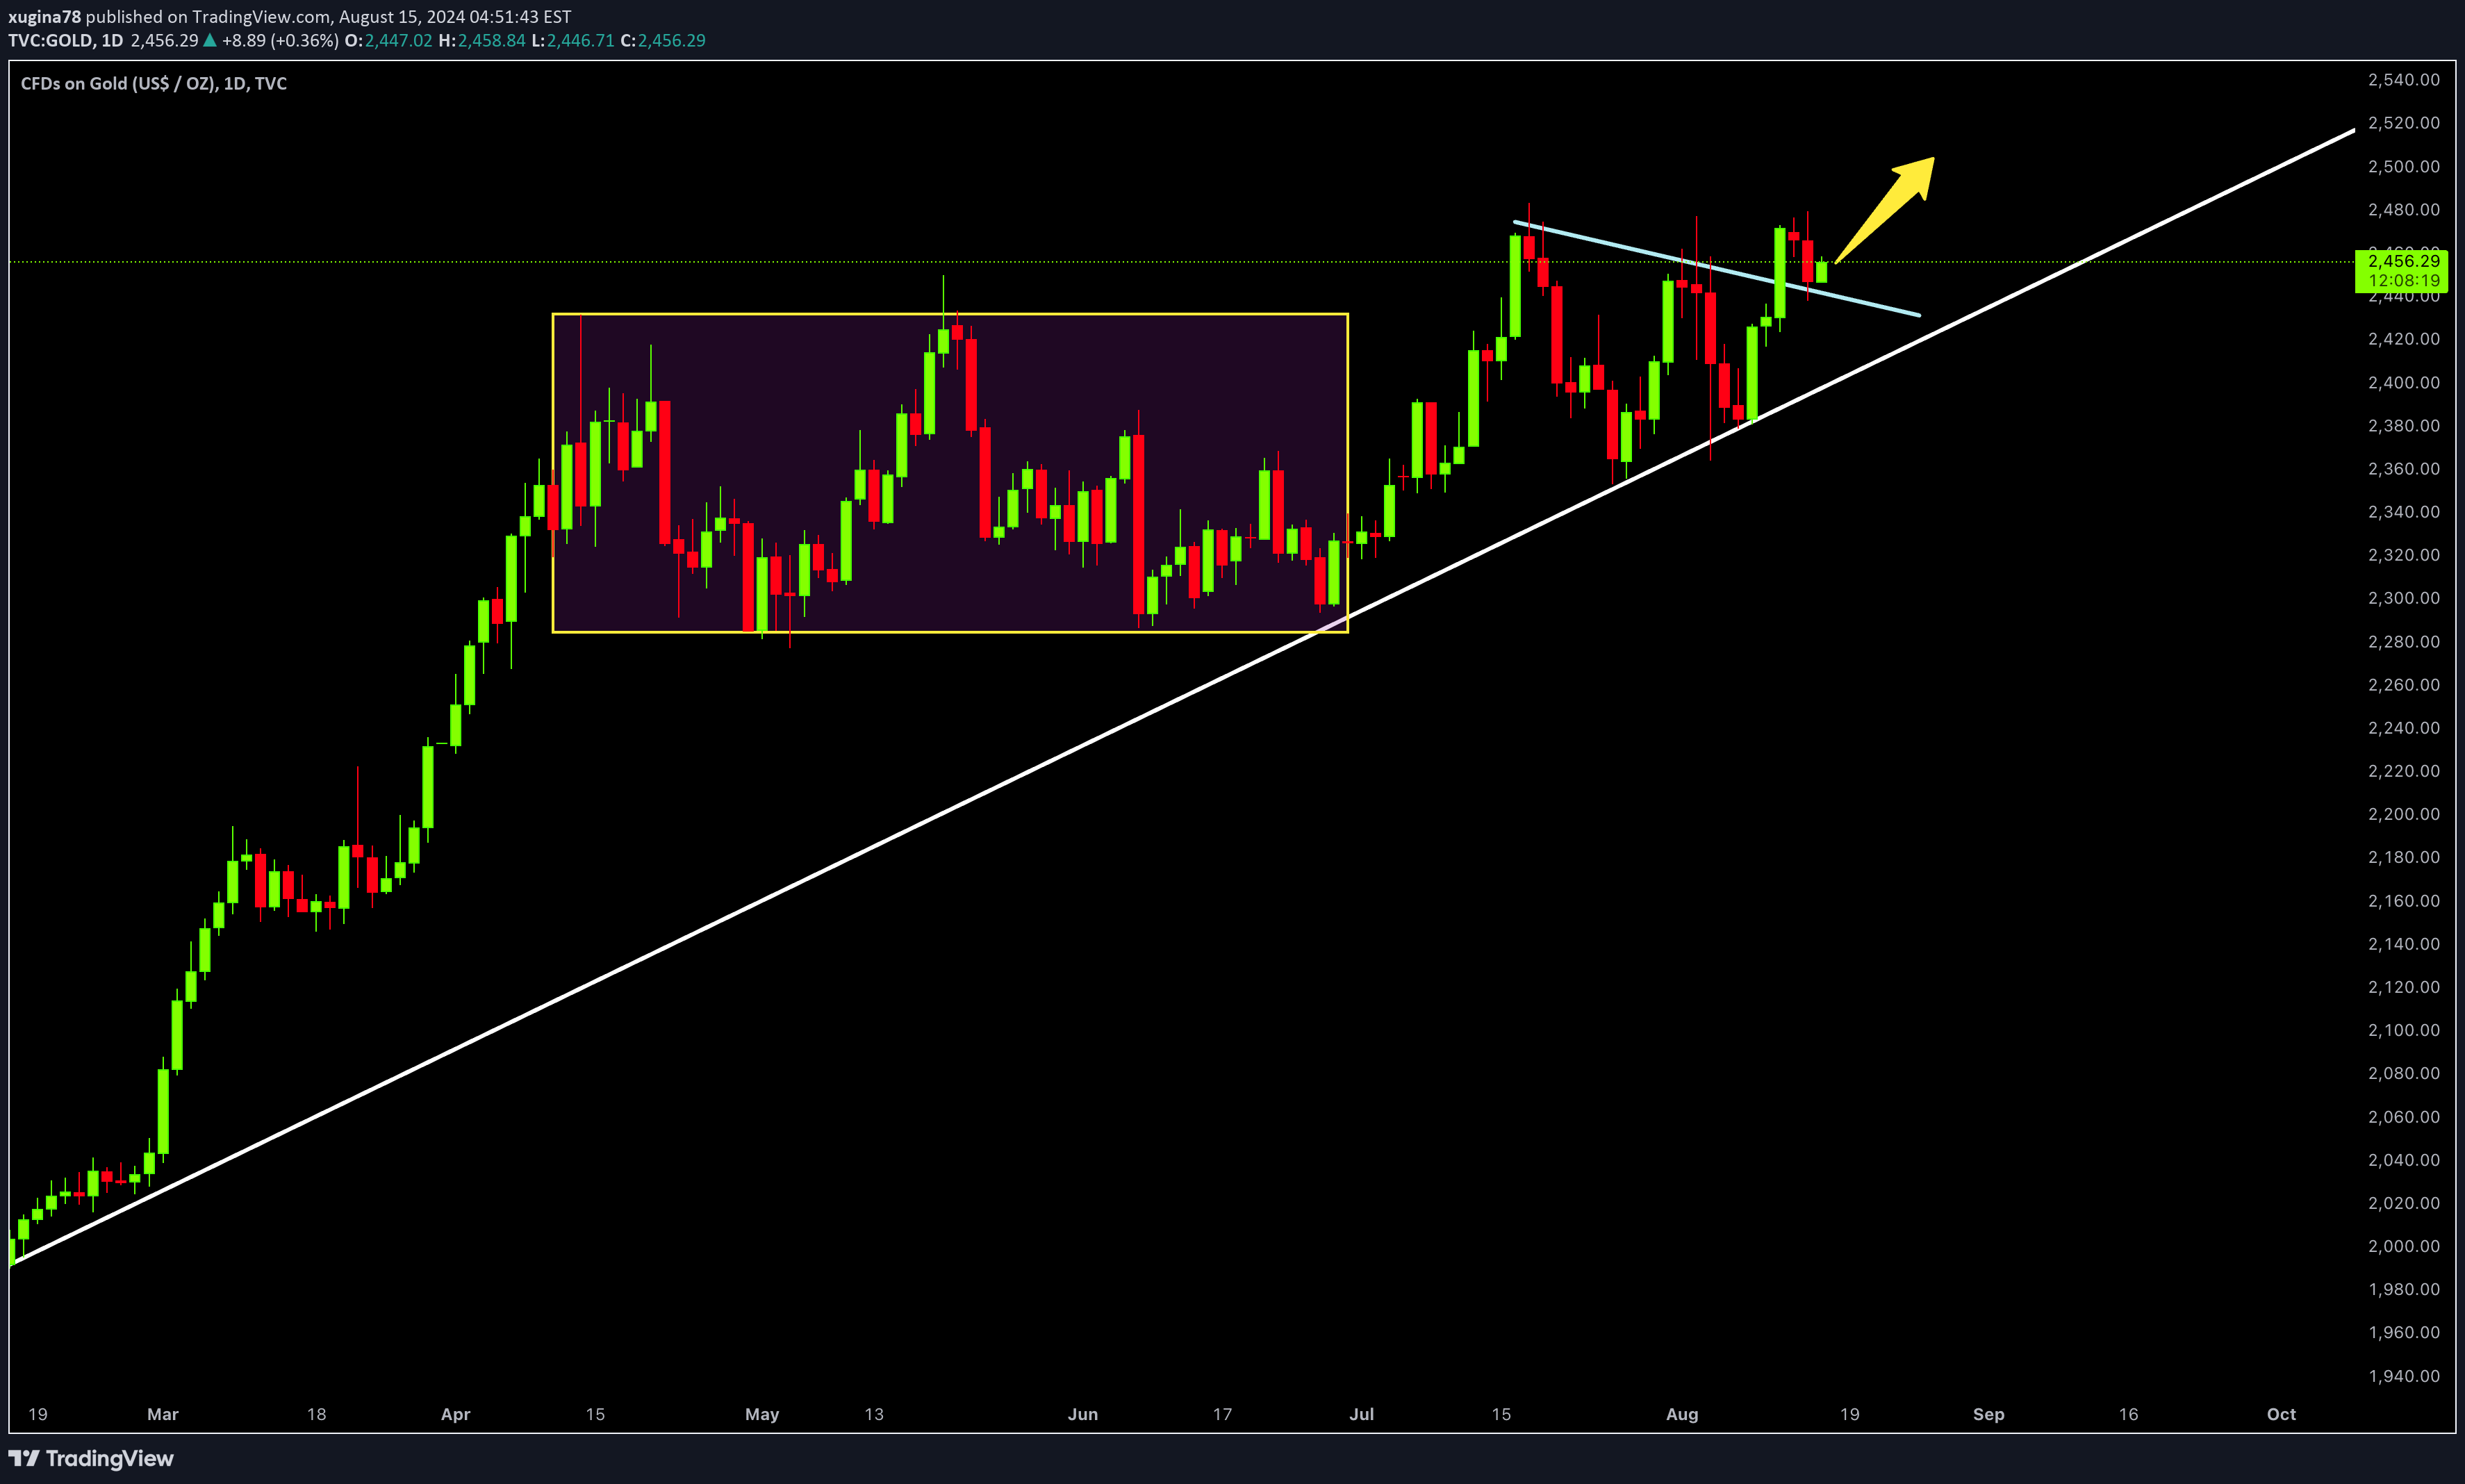
Keep it simple: Break. Backtest. ResumptionFirst of all, the price is moving in a bullish market.secondly, it just breaks above the bullish triangle pattern, and is retesting now.lastly, if it be supported, the price will continue to go bullish.
xugina78
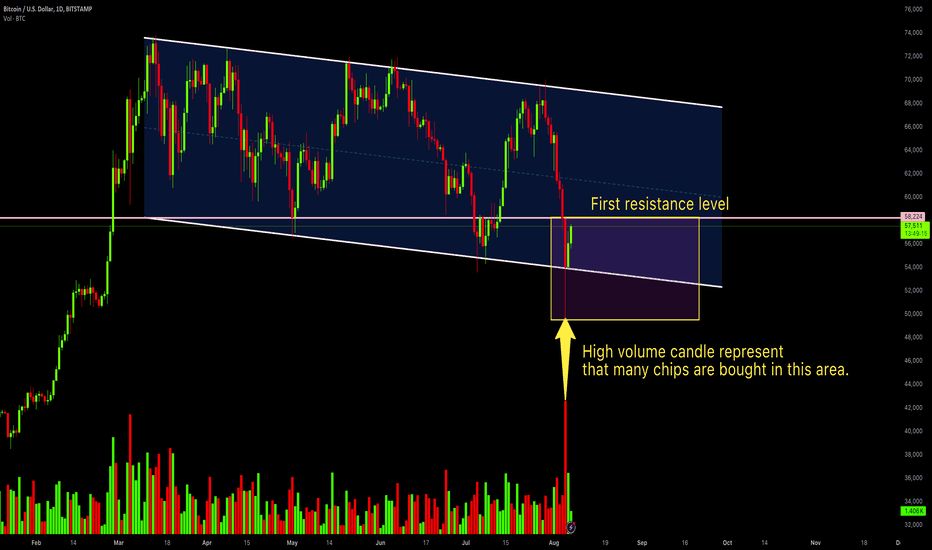
The price will start to rebound when it drops to the lower edge of bearish channel with long lower shadows candle.What's my target price for this rebound?i will take my first target at 58200 which shares the similar level with the high price of previous high volume candle, since high volume candle represent that many chips are bought in this area.do you agree with me?
xugina78
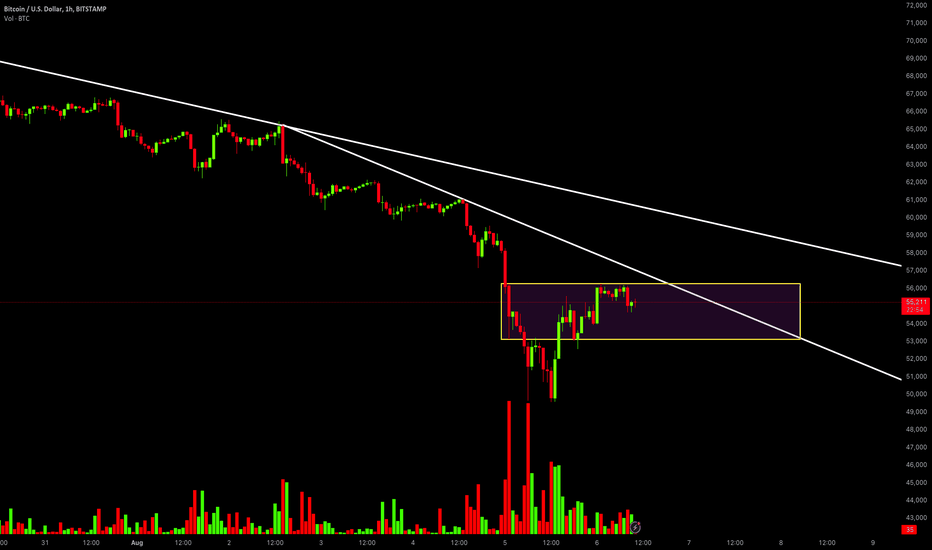
As we predicted yesterday, Bitcoin dropped to the support area of previous consolidation box, and be supported for a short-term callback.so it's a buy timing now?let's check 1h chart, we could see that the price is rebounding to the candlestick area with high volume, which represent strong resistance. Therefore, if the price can not break above this resistance area, and the trend cannot be reversed, it might continue to go bearish later. In this case we can pay attention to sell signal that the short-term callback is ended.Make sure to hit that follow and boost button so you won't miss any updates.
xugina78
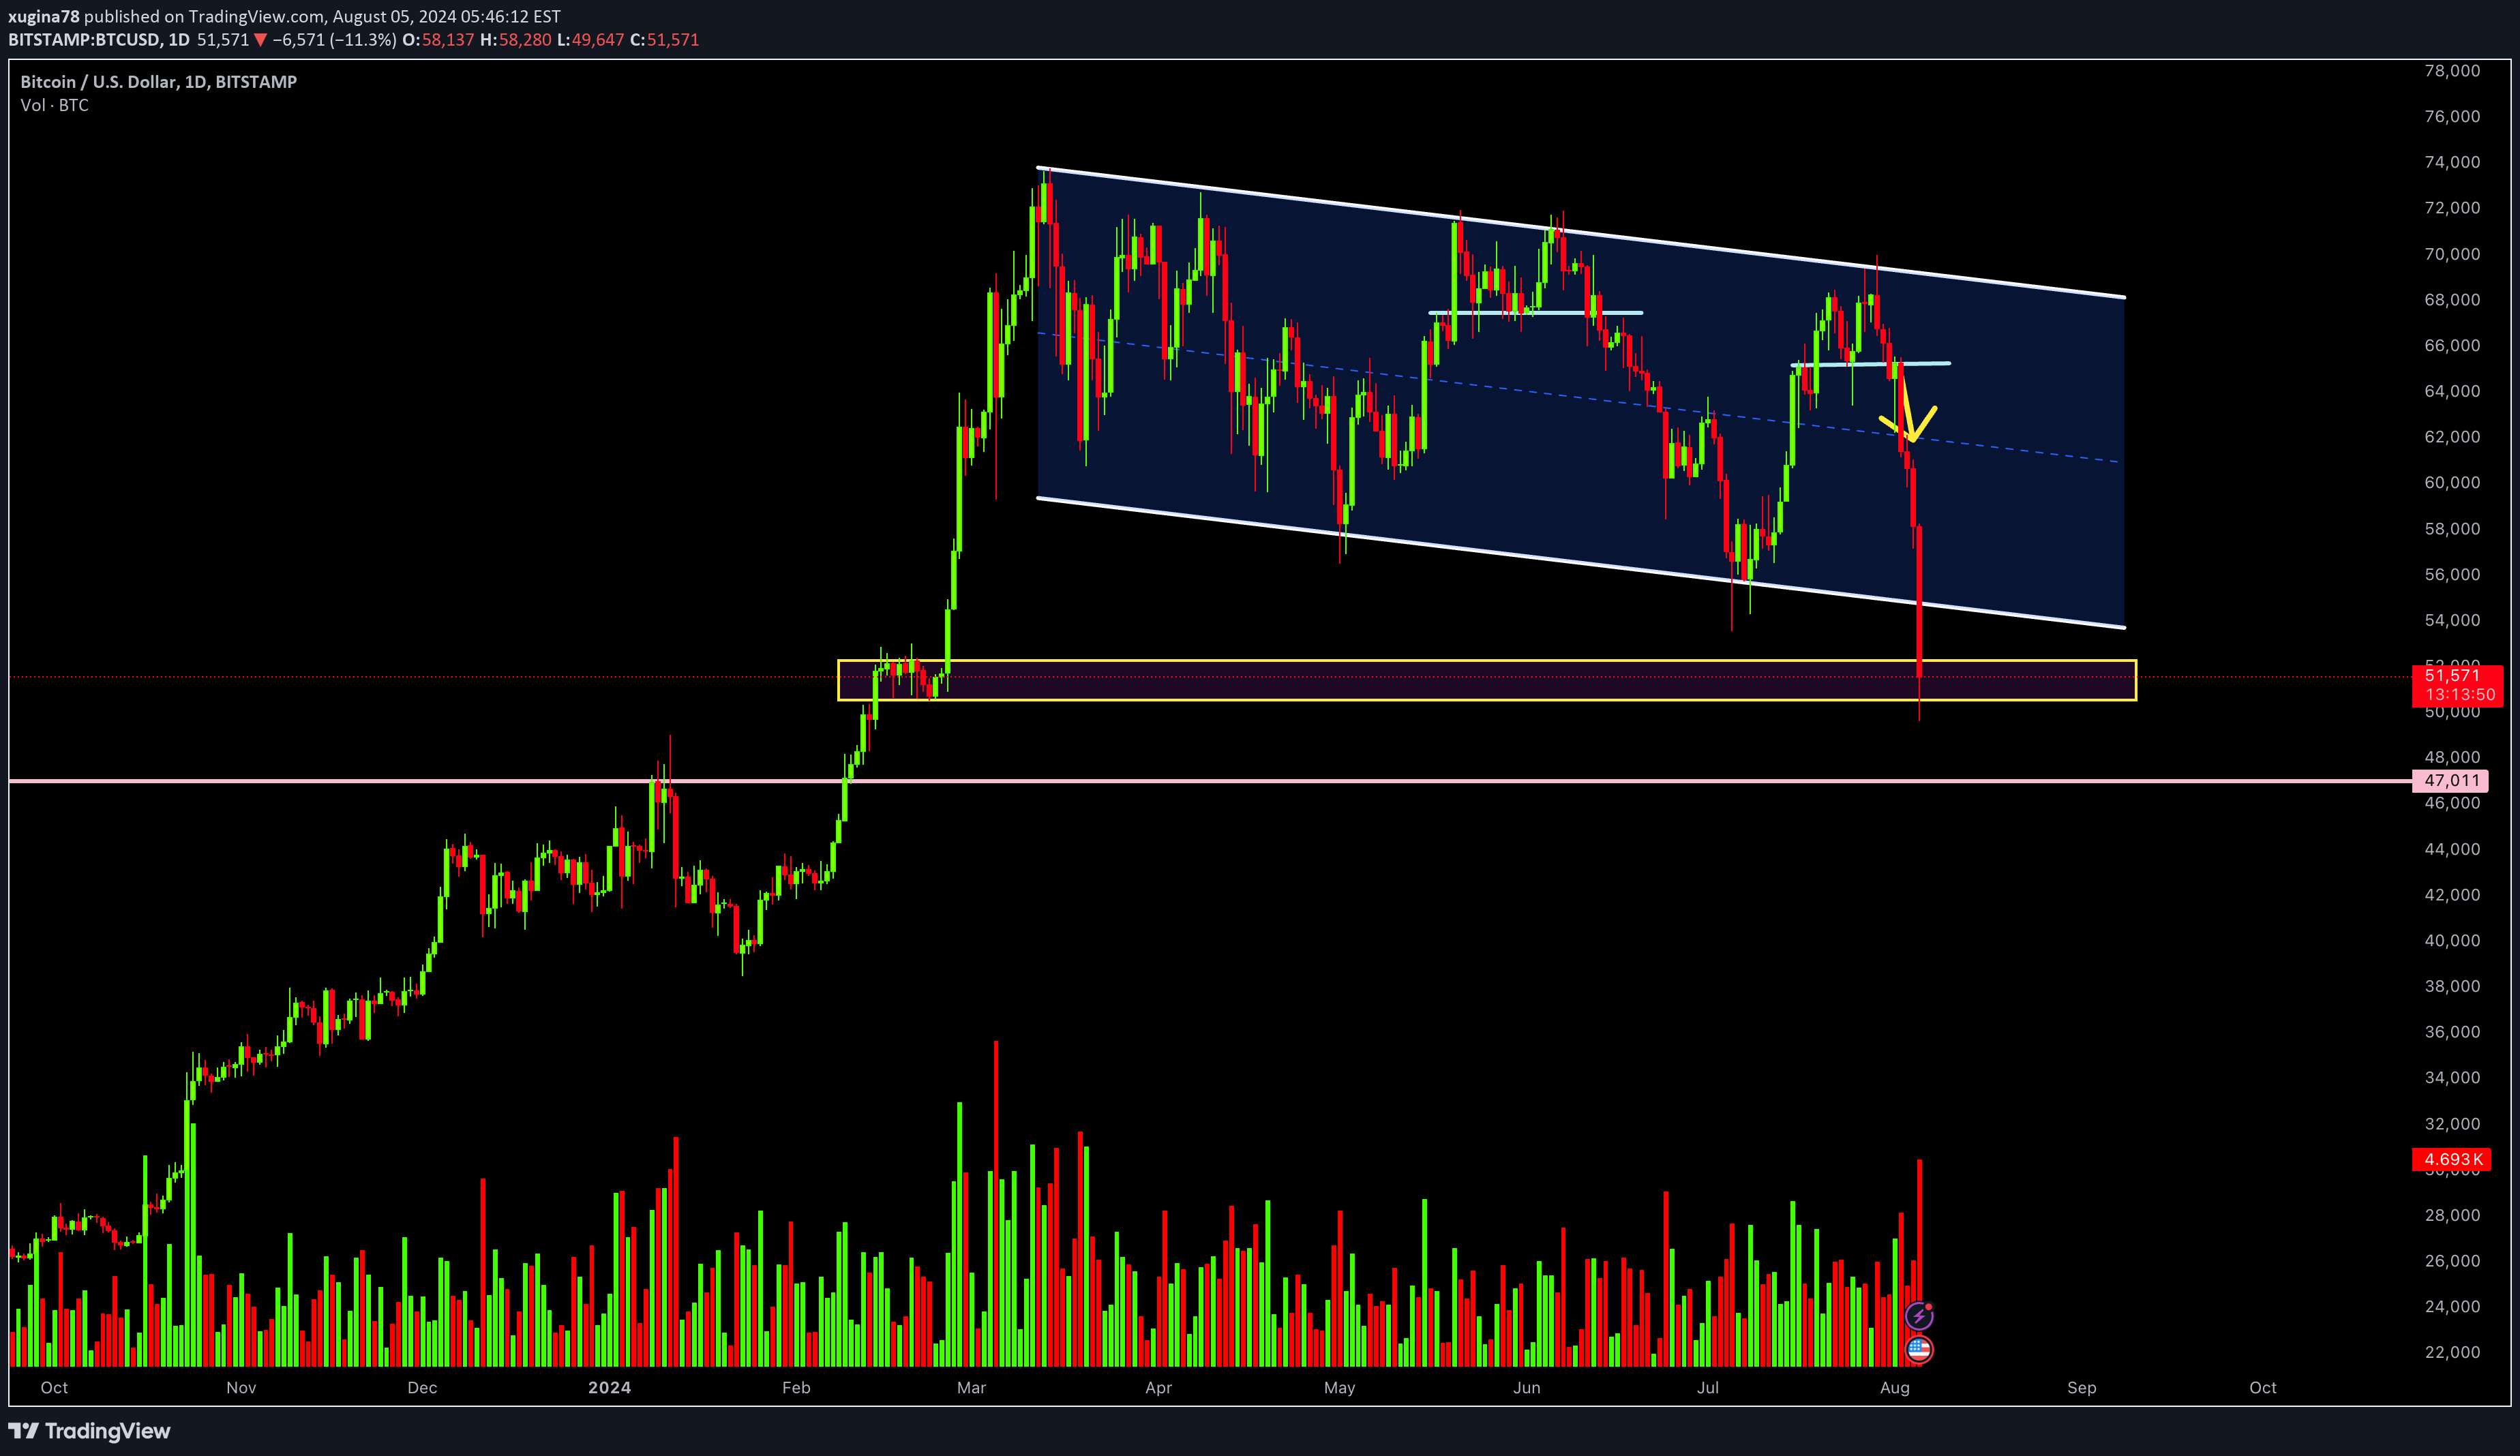
As our prediction last week, the price move in a bearish market after a double top pattern formed. And the price now is getting close with the support area from previous consolidation box. If it drop below this support area, it may drop to 47000 this week. Make sure to hit that follow and boost button so you won't miss any updates.
xugina78
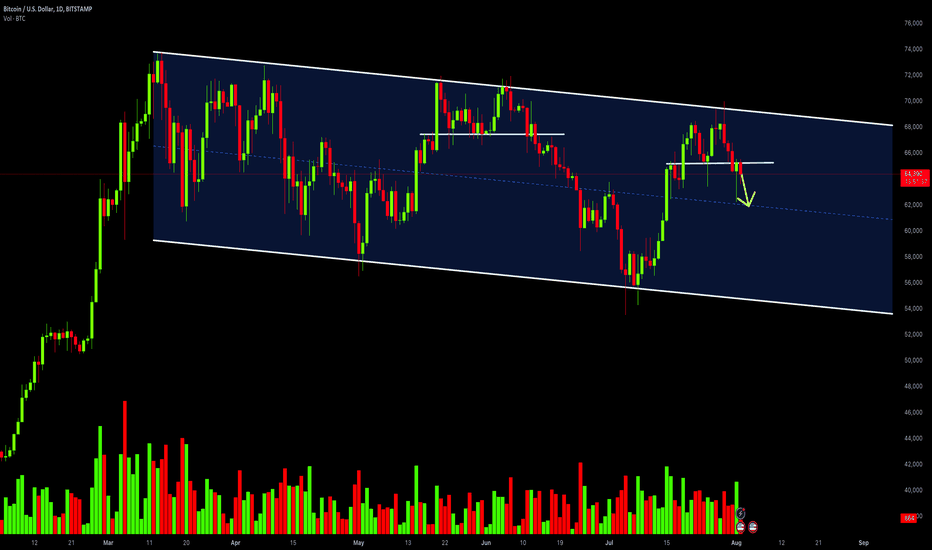
From the daily chart of bitcusd, the price formed a double top pattern around the top are of this bearish channel.Comparing with previous tops, more drop followed after a double top pattern.therefore, it might continue to go bearish for short-term.As our prediction last week, the price move in a bearish market after a double top pattern formed.And the price now is getting close with the support area from previous consolidation box.If it drop below this support area, it may drop to 47000 this week.
Disclaimer
Any content and materials included in Sahmeto's website and official communication channels are a compilation of personal opinions and analyses and are not binding. They do not constitute any recommendation for buying, selling, entering or exiting the stock market and cryptocurrency market. Also, all news and analyses included in the website and channels are merely republished information from official and unofficial domestic and foreign sources, and it is obvious that users of the said content are responsible for following up and ensuring the authenticity and accuracy of the materials. Therefore, while disclaiming responsibility, it is declared that the responsibility for any decision-making, action, and potential profit and loss in the capital market and cryptocurrency market lies with the trader.