
x4fcqmrdz5
@t_x4fcqmrdz5

What symbols does the trader recommend buying?
Purchase History
پیام های تریدر
Filter
Signal Type
x4fcqmrdz5
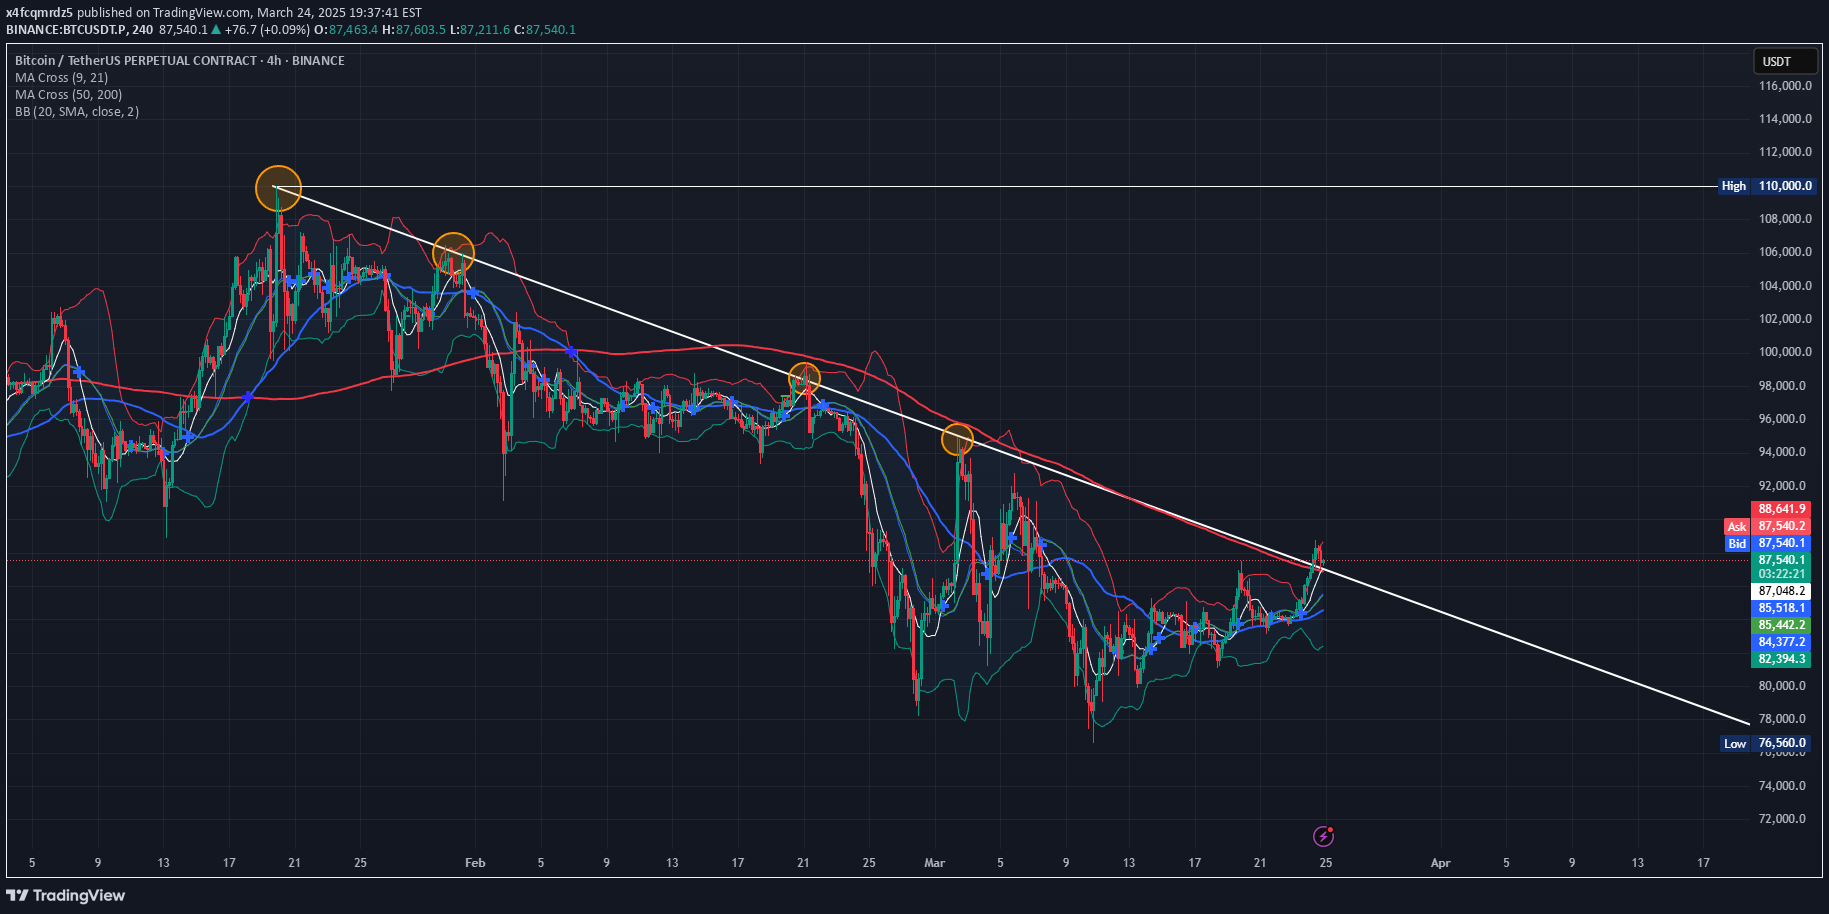
BTCUSDT.P is breaking a key trendline with more then 3 touches, signaling a potential strong move! The price is also trading above the 200 MA, adding bullish confirmation. 💡 What to watch for: ✅ Wait for the trendline to flip into support on the 4H or 1H timeframe before entering. ✅ Be cautious—big players can trigger quick reversals! ✅ ETF markets won’t open until 9:30 AM UTC-4 (New York time) tomorrow, so expect volatility.
x4fcqmrdz5
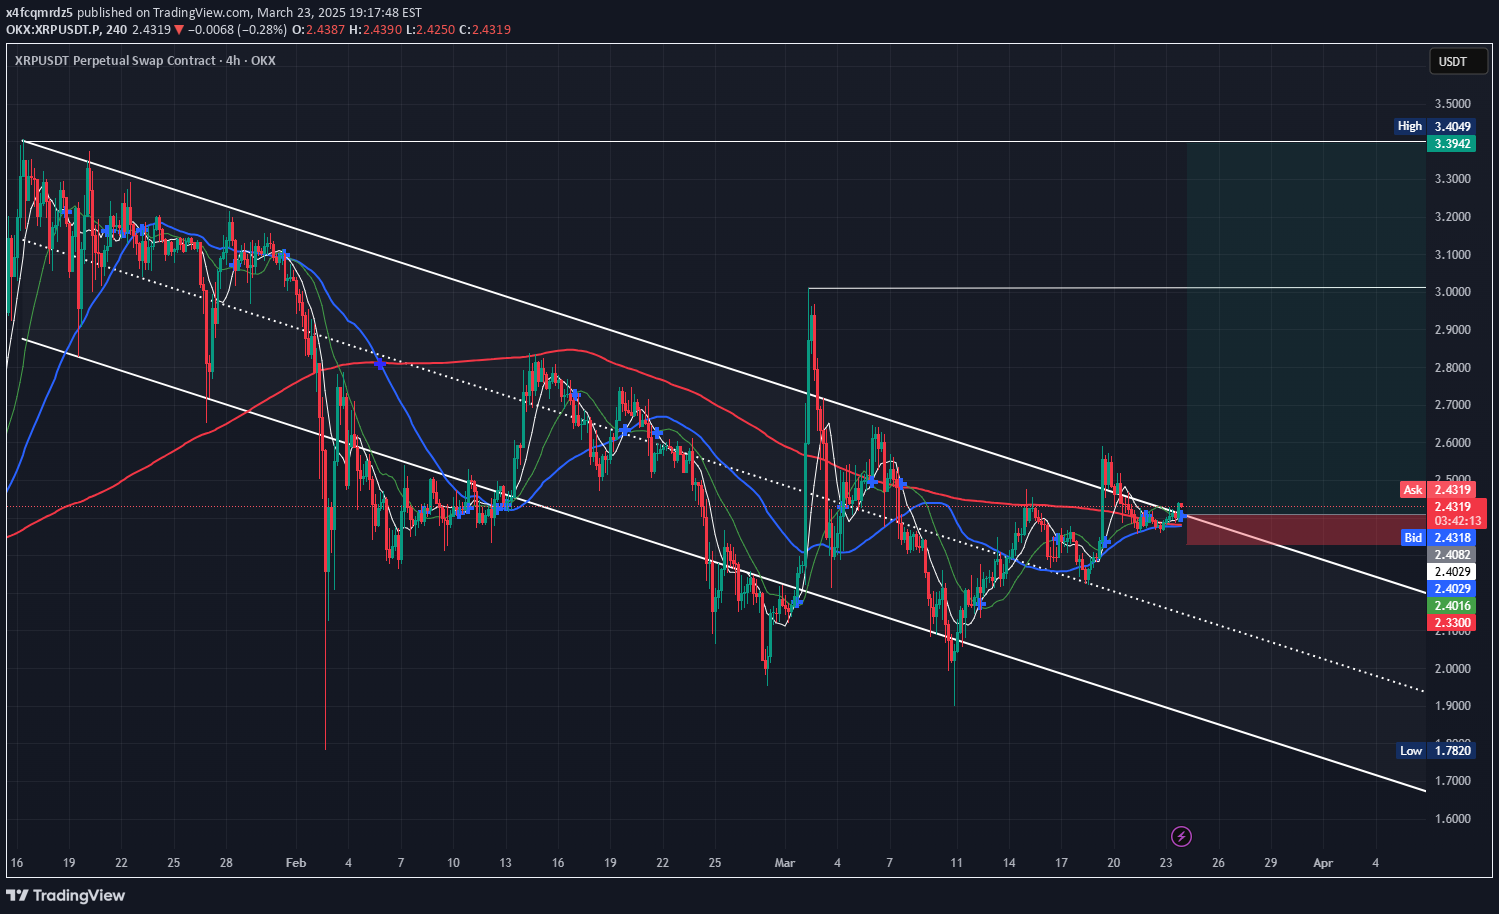
XRPUSDT.P has been trading inside a parallel channel for 66 days since January 16, 2025. Now, the price is breaking out to the upside! 💡 The key strategy here is waiting for a retest if the price successfully flips the channel into support, it could be the perfect entry for a strong upward move. 📈 Potential upside? 40%+ if the breakout holds and momentum kicks in! 🔍 Watch for: ✅ Retest & confirmation of support ✅ RSI & momentum indicators aligning ✅ Heatmap support ✅ Gold cross of MA 200-D/50-D Are you catching this move? Share your thoughts in the comments! 🚀🔥
x4fcqmrdz5
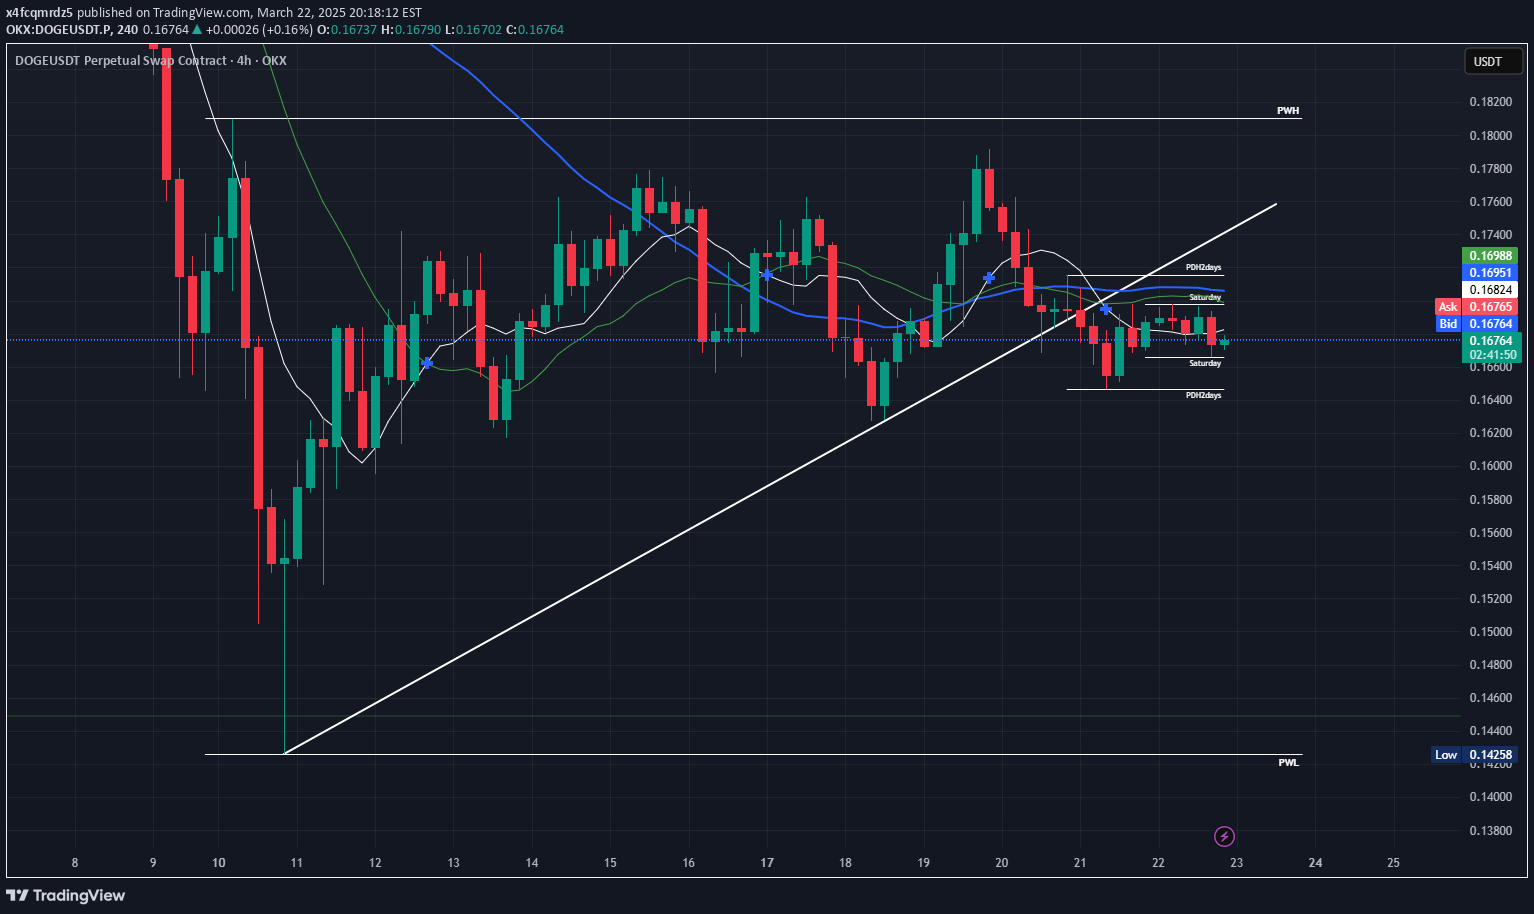
Took previous day's low, and closed bearish. Looking to take previous day's low again. Previous Day High at: 0.16978 Previous Day Low at: 0.16656
x4fcqmrdz5
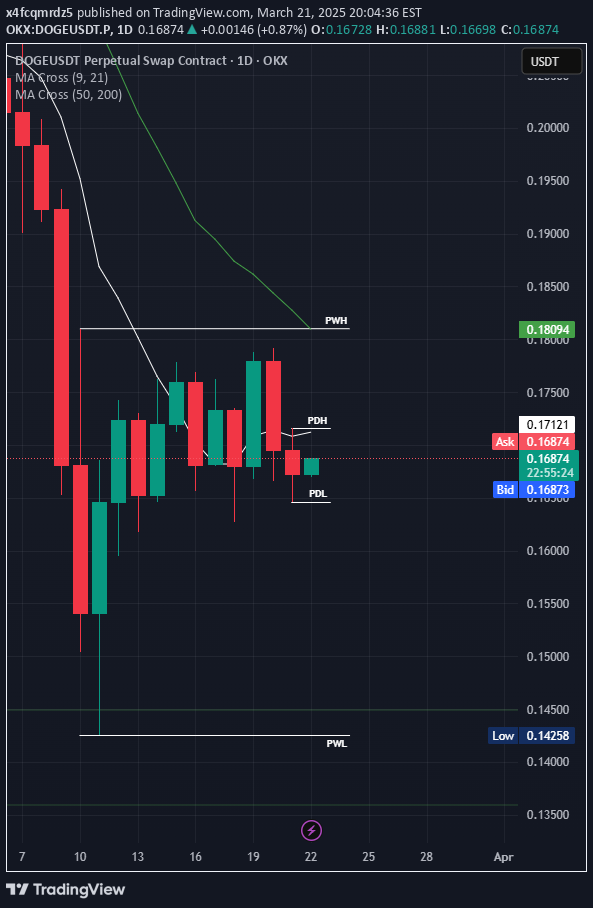
Took previous day's low, and closed bearish. Looking to take previous day's low again. Previous Day High at: 0.17156 Previous Day Low at: 0.16464 DOGEUSDT.P
x4fcqmrdz5
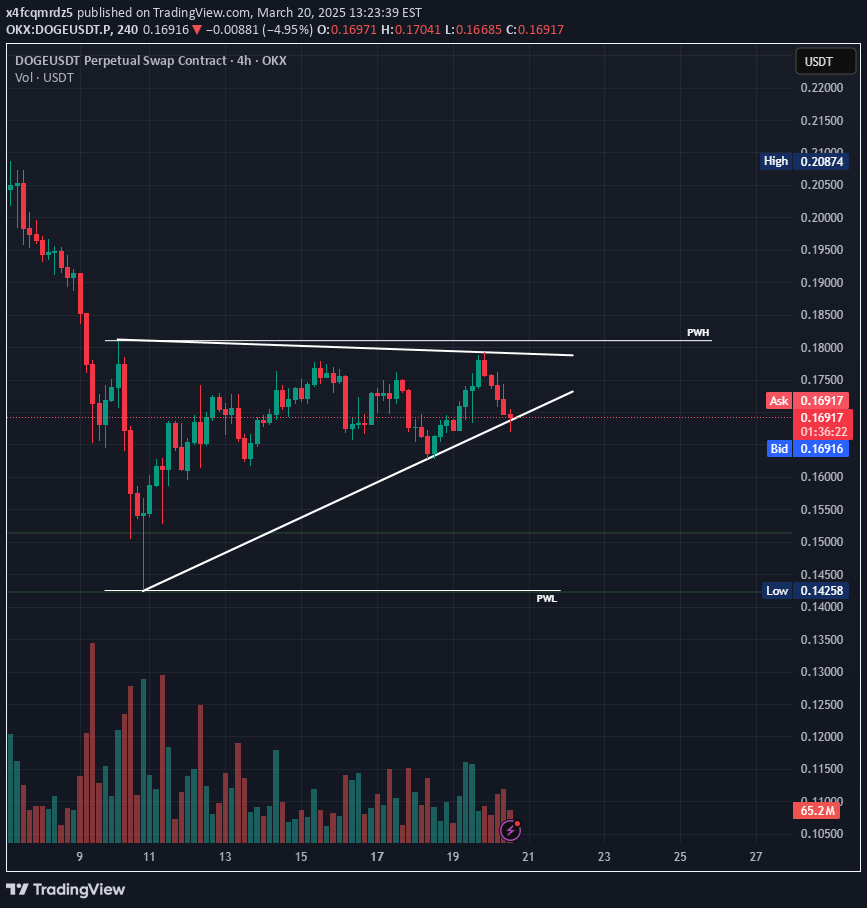
DOGEUSDT Analysis – Potential Downtrend Continuation The bulls initially pushed the price above the rising wedge but failed to hold it as support. As a result, the price retraced, breaking below the trendline once again. The bears not only successfully breached this level but also converted the upper trendline into resistance. Subsequently, within 2 to 3 hours, the price broke below the lower trendline, signaling further bearish momentum. Traders should be cautious of a potential downtrend continuation. At the $0.161694 level, a large-scale liquidation of approximately $3.01 million is present, making it a potential profit-taking zone if the bears manage to hold the lower trendline as resistance. This is just my perspective—trade wisely! 🤞⚡💰
x4fcqmrdz5
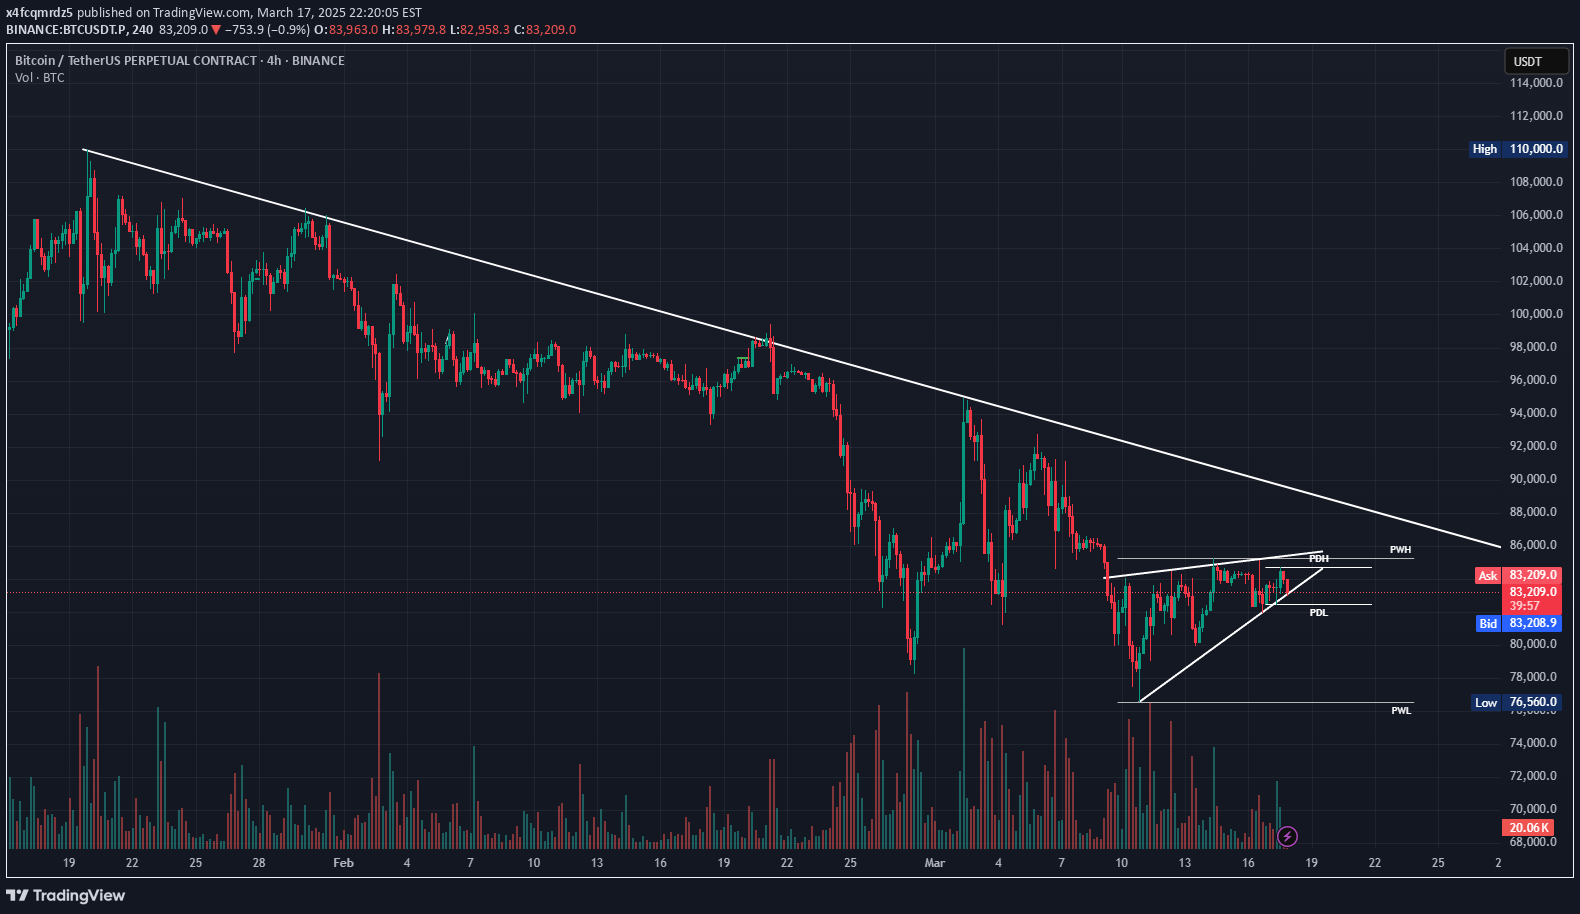
BTCUSDT BTC/USDT is currently "forming a rising wedge pattern" , which could indicate a continuation of the downtrend. Since the last peak at $110,000, Bitcoin has been experiencing a decline. At the moment, BTCUSDT BTC/USDT is highly volatile, with daily price swings of up to 10%. This volatility increases the likelihood of fake breakouts and rapid reversals, especially due to external factors like news.
x4fcqmrdz5
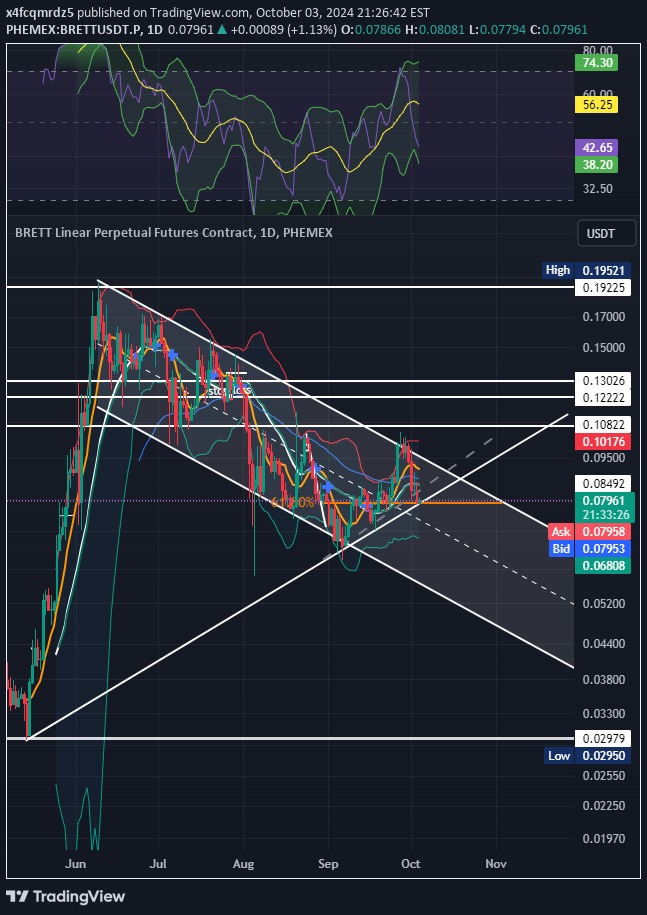
BRETTUSDT.P chart is showing a potentially bullish pattern on the daily timeframe, around the 61.8% Fibonacci retracement level and a long-term trendline originating from May 14, 2024. BTCUSDT.P has been retesting the 200-day EMA for three consecutive days, indicating a zone of high interest. Important Note: This analysis is based on a candle that has not yet closed. It’s crucial to wait for confirmation with a full daily candle close above the trendline and Fibonacci level before considering a trade and sometimes even wait for double retest. This idea adds clarity that the analysis is anticipatory, giving traders a heads-up on a potential setup.
x4fcqmrdz5
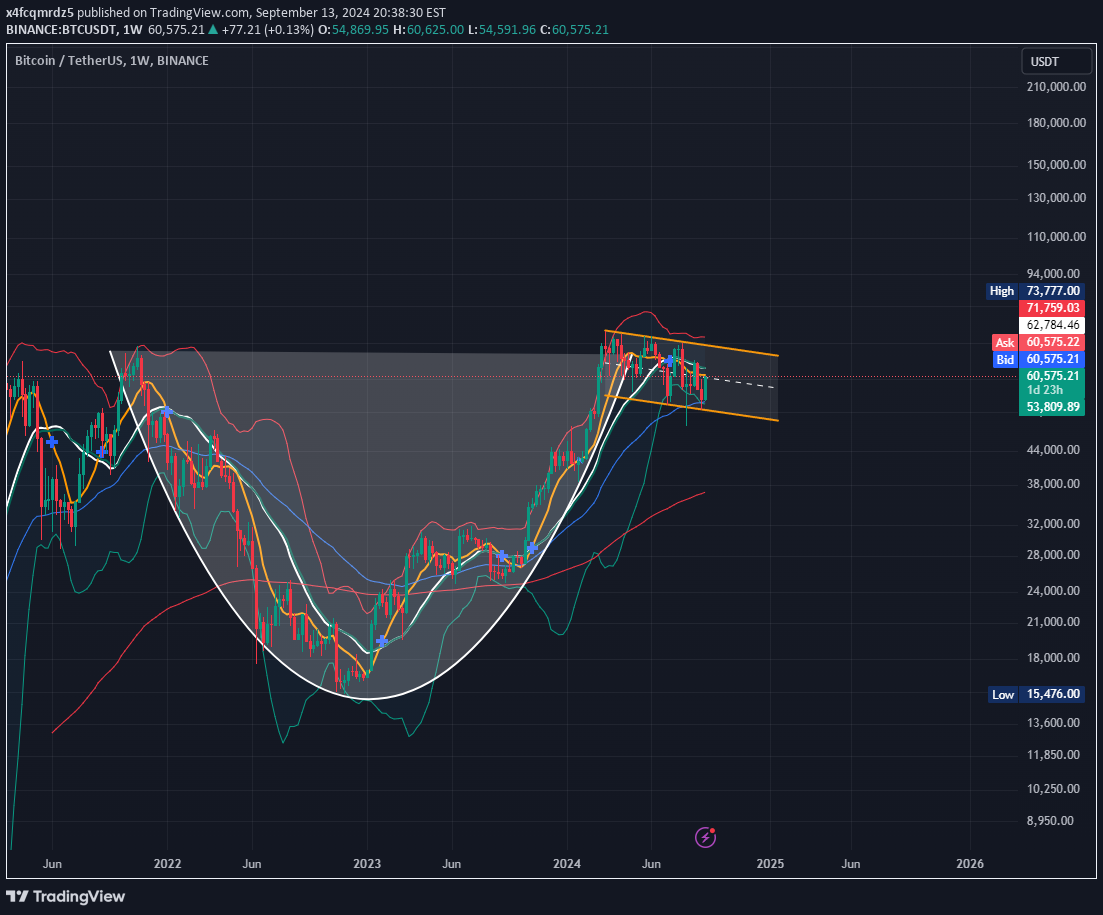
This technical study relies on weekly timeframe observations, highlighting key technical patterns and volume dynamics that suggest a bullish outlook. As of today’s date (9:26pmAST), the 24-hour long volume stands at $28.59B, underscoring significant long interest in the market. With precise data from the weekly chart, the confluence of multiple bullish indicators suggests the potential for a retest or breakout beyond the all-time high. Analysis: Cup and Handle Formation : The first significant observation is the development of a classic Cup and Handle pattern, widely regarded as a bullish continuation pattern. This pattern, forming over a prolonged period, indicates a consolidation phase followed by potential upward momentum. The handle represents a minor retracement, which often precedes a breakout to the upside. Parallel Channel and Key Levels : Starting from the previous peak at 73,777, a parallel channel has been drawn down to the recent bottom at 52,550. This channel defines the current price action, showing a well-respected range within which the price has oscillated. The recent price action has been bouncing within the lower bounds of this channel, signaling that the market may be gearing up for a decisive move. The current trajectory suggests that if momentum continues, we could see a breakout of this channel, potentially pushing the price back toward the all-time high. EMA Support and Price Action : Another critical factor is the price's bounce off the 50-day Exponential Moving Average (EMA), which serves as a key support level. Historically, the 50-day EMA is a strong indicator of trend direction, and the recent bounce suggests renewed buying pressure. This move reinforces the bullish outlook and could indicate a sustained push toward breaking or retesting the all-time high. With the formation of the Cup and Handle pattern, the support from the 50-day EMA, and the market respecting the parallel channel, all signals point to a potential bullish breakout. The current long volume of $28.59B adds further confirmation of buying interest, aligning with the technical patterns that favor upside potential.
x4fcqmrdz5
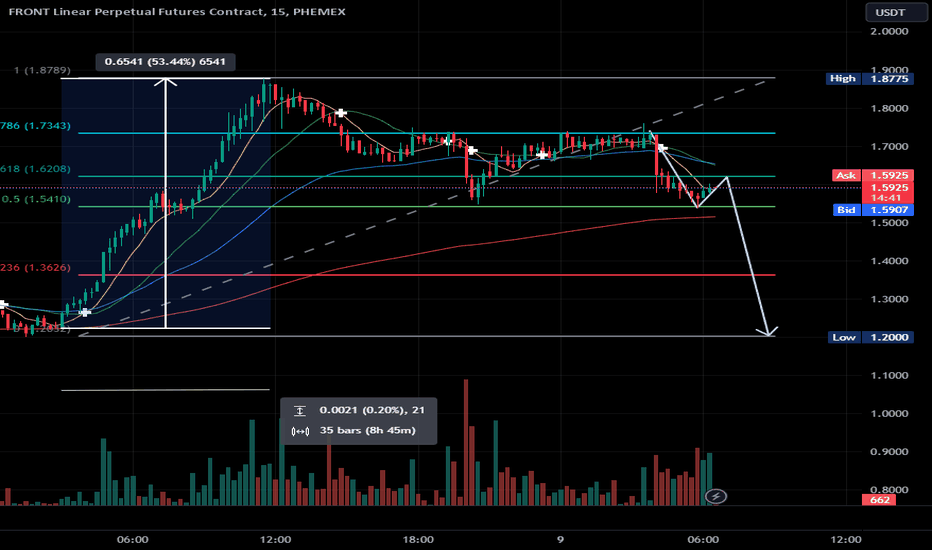
Trading Analysis Report: This trading analysis report provides insights into the recent price action of FRONTUSDT.P, focusing on key technical indicators and patterns observed on the 15-min timeframe. Following the bounce from the EMA 200-day (Wed 08 May), the asset surged by an impressive 53%, marked by a series of 5 red candles out of 34 candles in 8h 30m. However, the inability to breach previous peaks signaled weakness. On May 24th at 4:00 am, where a big red candle cross both the 50 EMA and the 61.8% Fibonacci retracement level. This event suggests a potential shift. The technical analysis indicates the possibility of a decline, estimated at approximately -23.73%, with a potential downside target around the 1.20 level. The price still on top of 200 EMA so just be aware of that. $PHEMEX:FRONTUSDT.P May 9, 2024, 6:30am
x4fcqmrdz5
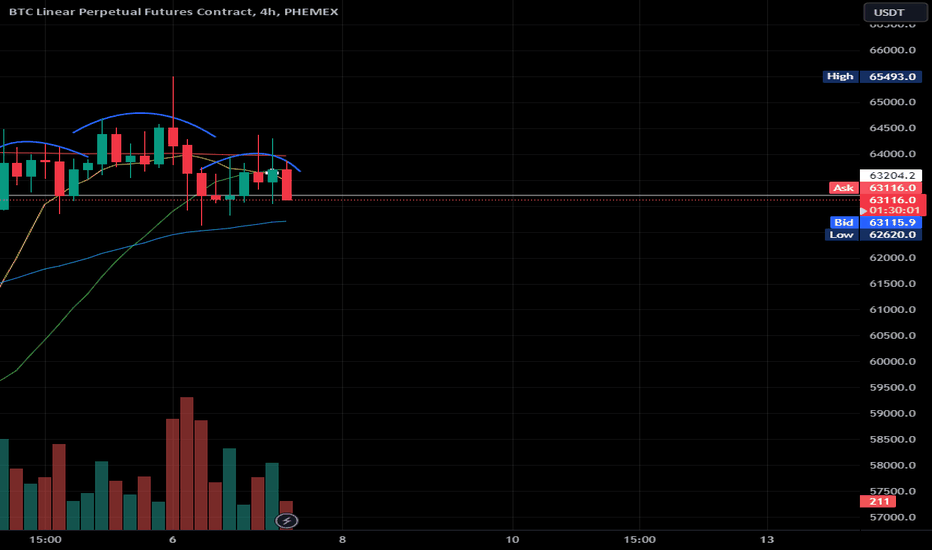
The closing price of the second shoulder is observed to be lower than the first shoulder, indicating a potential reversal pattern. Furthermore, the price action is positioned below the 200-day Moving Average (EMA), reinforcing the bearish sentiment. Additionally, I noticed seven candles on the first shoulder and head. BTCUSDT.P May 7, 2024, 2:25pm
Disclaimer
Any content and materials included in Sahmeto's website and official communication channels are a compilation of personal opinions and analyses and are not binding. They do not constitute any recommendation for buying, selling, entering or exiting the stock market and cryptocurrency market. Also, all news and analyses included in the website and channels are merely republished information from official and unofficial domestic and foreign sources, and it is obvious that users of the said content are responsible for following up and ensuring the authenticity and accuracy of the materials. Therefore, while disclaiming responsibility, it is declared that the responsibility for any decision-making, action, and potential profit and loss in the capital market and cryptocurrency market lies with the trader.