
wolftradx
@t_wolftradx

What symbols does the trader recommend buying?
Purchase History
پیام های تریدر
Filter
ZENUSDT: ریزش در راه است؟ سطح حمایت حیاتی برای ادامه صعود کجاست؟
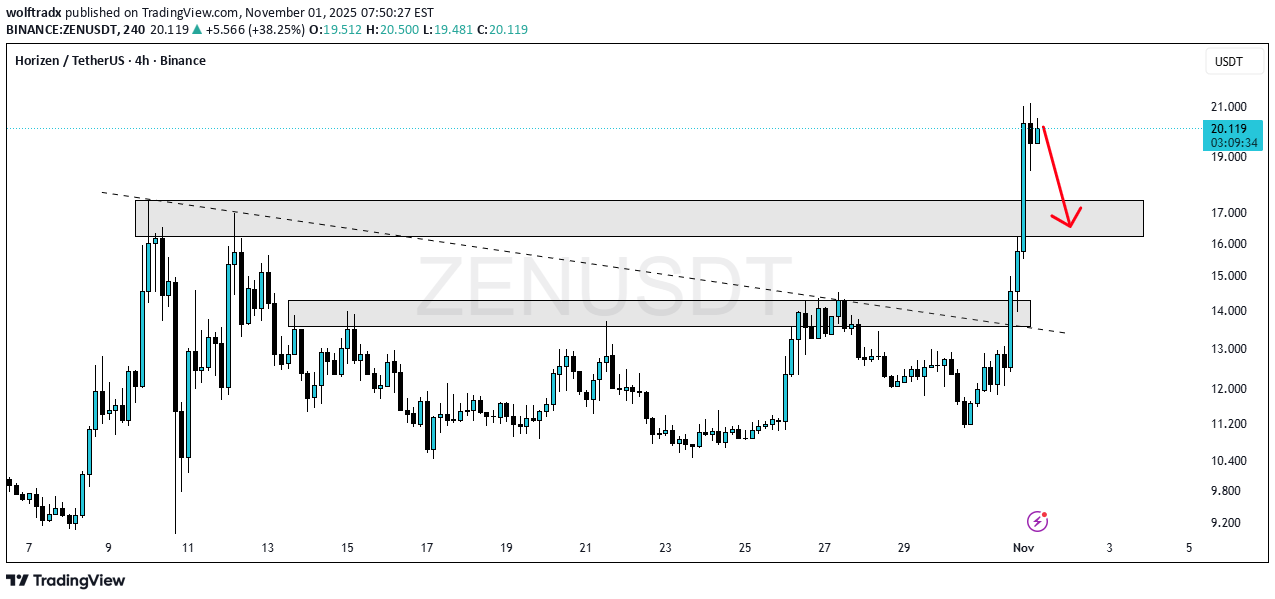
The chart displays a strong breakout from a prolonged period of consolidation, marked by a descending trendline and several horizontal resistance zones. Prior to the breakout on November 1st, the price had been trading within a range, frequently challenging and failing to sustain a move above the roughly $14.00 - $14.50 resistance area. This level represented a significant hurdle, which was finally breached with notable momentum. The current price action is characterized by a large, impulsive green candle, driving the price well above the previous highs near $17.00. This suggests strong bullish sentiment and a significant influx of buying pressure. The move has cleared all immediately visible overhead resistance, moving into a price territory not seen in the visible history of this chart section. Price Projection Given the sharp, parabolic nature of the recent surge, a pullback or retracement is highly probable as traders take profit and the market digests the strong move. The most immediate and significant potential support zone, previously a major resistance area, is located between approximately $16.00 and $17.00. This zone is crucial as it represents the last major swing high/resistance before the current move. The analysis projects a correction back toward this support zone. The red arrow on the chart specifically suggests a move down to test the $16.00 - $17.00 area. A successful test and bounce from this range would confirm the former resistance as new, strong support, solidifying the recent breakout and paving the way for a continuation of the uptrend toward higher price targets. Failure to hold this support, however, could indicate a false breakout or a deeper correction, potentially back to the $14.00-$14.50 breakout level. In summary, the immediate outlook is for a short-term pullback to confirm the breakout, followed by a potential continuation of the strong bullish trend.
بیت کوین در دام فرسایشی؛ آیا حمایت حیاتی ۱۰۶ هزار دلاری فرو میریزد؟
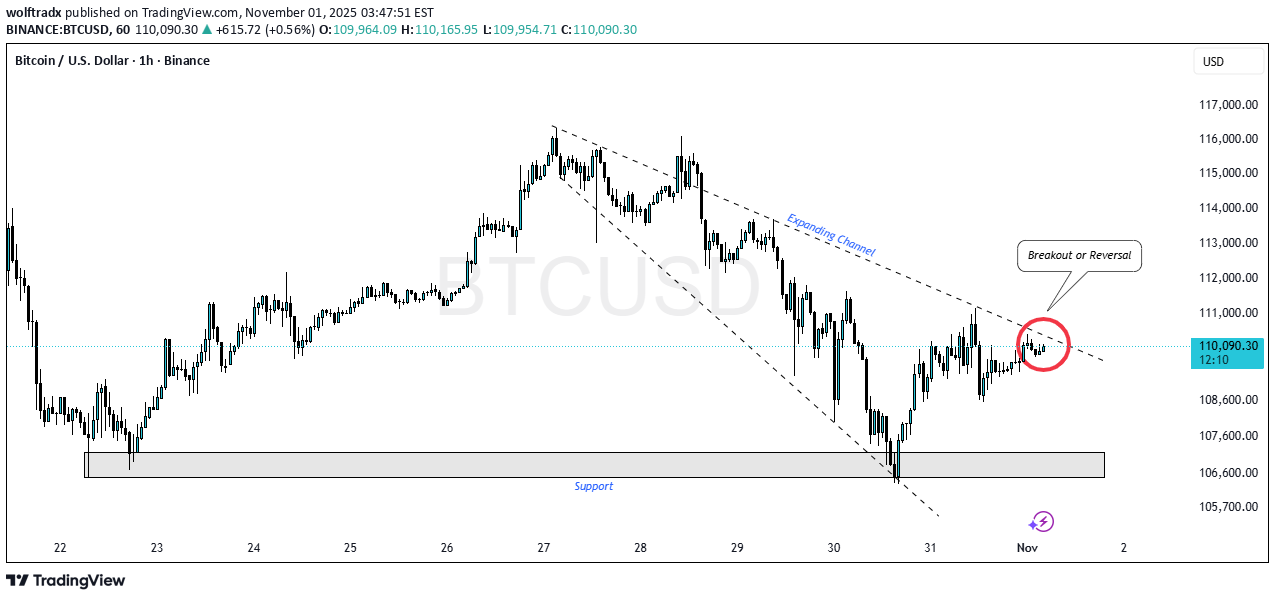
The chart highlights Bitcoin's recent price action within a significant, long-term pattern known as a Broadening/Expanding Wedge or Channel, which often signals increasing volatility and indecision between buyers and sellers. 1. Broadening Formation (Expanding Channel) Structure: The price is contained within two divergent trendlines (one resistance, one support) that are moving away from each other. This is a pattern of increasing highs (Resistance) and decreasing lows (Support). Significance: This pattern suggests high volatility and a lack of conviction, where large moves are fading out as they hit the trendline boundaries, only for the price to reverse and test the opposite boundary. Pattern Goal: Broadening patterns typically resolve with a decisive breakout above the resistance or below the support, which then initiates the next major trend. 2. Key Price Action and Rejection Recent High: The price recently tested the upper boundary of the broadening channel (Resistance) around the $126,000 - $127,000 area and was sharply rejected. Current Move: Following the rejection, the price is now in a strong downtrend, characterized by large red candles, moving towards the lower boundary (Support) of the channel. Breakdown Warning: The chart features a small horizontal box/range that was recently broken to the downside, acting as a minor level of resistance in the current move. 3. Key Support and Targets Immediate Dynamic Support: The next major target for the current bearish move is the lower trendline of the Broadening Wedge, which currently sits around the $108,000 - $109,000 area. Strong Horizontal Support: Confluence exists with a strong horizontal support zone just below the dynamic support, around $106,000 - $107,000. This level has acted as a critical floor previously (as evidenced by the large green candle wick around October 10th). Critical Confluence Zone: The area where the dynamic trendline support meets the horizontal support ($106,000 - $109,000) is the most critical zone for a potential bounce. 4. Momentum (RSI) RSI Reading: The Relative Strength Index (RSI) is currently in a strong downtrend, moving towards the Oversold (30) territory. Bearish Momentum: This confirms the current bearish momentum and suggests that a strong bounce or reversal is unlikely until the RSI either hits oversold or the price reaches the major support confluence. 💡 Trading Implication The technical structure suggests that the price is likely heading to test the bottom of the long-term pattern. Bearish Continuation (Most Likely Scenario): The price is expected to continue its slide to test the $108,000 - $109,000 dynamic support, where buyers are likely to step in for a reaction bounce. Critical Support Zone: The $106,000 - $109,000 zone is the "make-or-break" area. A decisive break and close below $106,000 would be a major bearish signal, likely resulting in a large downward move (a break of the entire long-term broadening pattern).
Disclaimer
Any content and materials included in Sahmeto's website and official communication channels are a compilation of personal opinions and analyses and are not binding. They do not constitute any recommendation for buying, selling, entering or exiting the stock market and cryptocurrency market. Also, all news and analyses included in the website and channels are merely republished information from official and unofficial domestic and foreign sources, and it is obvious that users of the said content are responsible for following up and ensuring the authenticity and accuracy of the materials. Therefore, while disclaiming responsibility, it is declared that the responsibility for any decision-making, action, and potential profit and loss in the capital market and cryptocurrency market lies with the trader.