Technical analysis by wolftradx about Symbol BTC on 11/1/2025

بیت کوین در دام فرسایشی؛ آیا حمایت حیاتی ۱۰۶ هزار دلاری فرو میریزد؟
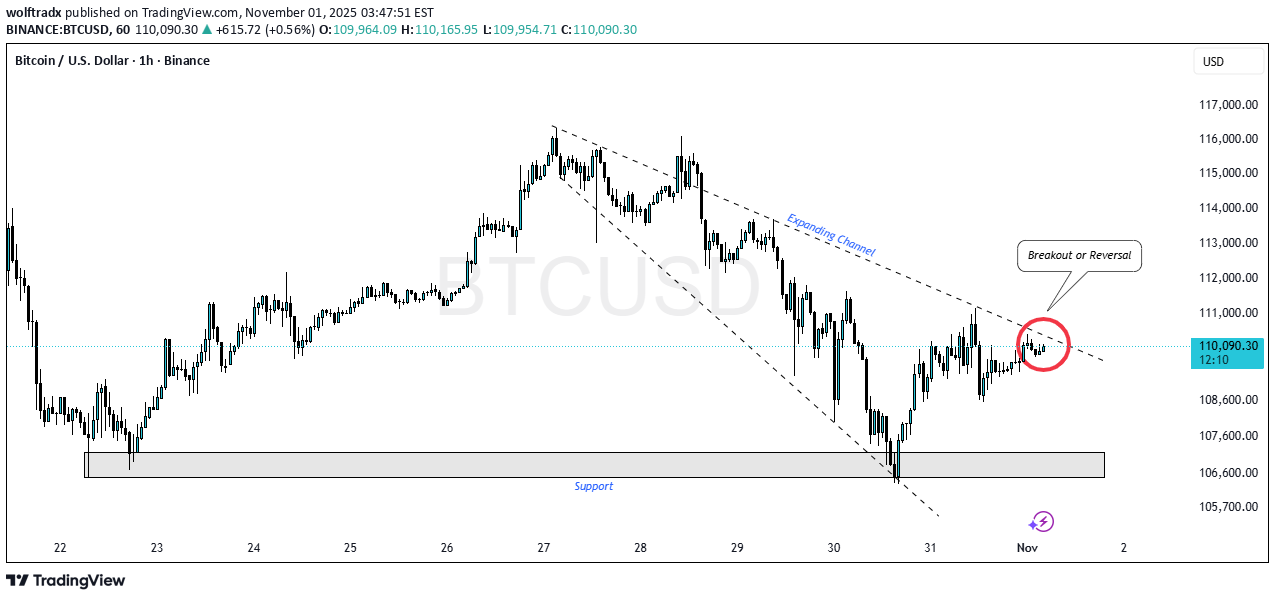
The chart highlights Bitcoin's recent price action within a significant, long-term pattern known as a Broadening/Expanding Wedge or Channel, which often signals increasing volatility and indecision between buyers and sellers. 1. Broadening Formation (Expanding Channel) Structure: The price is contained within two divergent trendlines (one resistance, one support) that are moving away from each other. This is a pattern of increasing highs (Resistance) and decreasing lows (Support). Significance: This pattern suggests high volatility and a lack of conviction, where large moves are fading out as they hit the trendline boundaries, only for the price to reverse and test the opposite boundary. Pattern Goal: Broadening patterns typically resolve with a decisive breakout above the resistance or below the support, which then initiates the next major trend. 2. Key Price Action and Rejection Recent High: The price recently tested the upper boundary of the broadening channel (Resistance) around the $126,000 - $127,000 area and was sharply rejected. Current Move: Following the rejection, the price is now in a strong downtrend, characterized by large red candles, moving towards the lower boundary (Support) of the channel. Breakdown Warning: The chart features a small horizontal box/range that was recently broken to the downside, acting as a minor level of resistance in the current move. 3. Key Support and Targets Immediate Dynamic Support: The next major target for the current bearish move is the lower trendline of the Broadening Wedge, which currently sits around the $108,000 - $109,000 area. Strong Horizontal Support: Confluence exists with a strong horizontal support zone just below the dynamic support, around $106,000 - $107,000. This level has acted as a critical floor previously (as evidenced by the large green candle wick around October 10th). Critical Confluence Zone: The area where the dynamic trendline support meets the horizontal support ($106,000 - $109,000) is the most critical zone for a potential bounce. 4. Momentum (RSI) RSI Reading: The Relative Strength Index (RSI) is currently in a strong downtrend, moving towards the Oversold (30) territory. Bearish Momentum: This confirms the current bearish momentum and suggests that a strong bounce or reversal is unlikely until the RSI either hits oversold or the price reaches the major support confluence. 💡 Trading Implication The technical structure suggests that the price is likely heading to test the bottom of the long-term pattern. Bearish Continuation (Most Likely Scenario): The price is expected to continue its slide to test the $108,000 - $109,000 dynamic support, where buyers are likely to step in for a reaction bounce. Critical Support Zone: The $106,000 - $109,000 zone is the "make-or-break" area. A decisive break and close below $106,000 would be a major bearish signal, likely resulting in a large downward move (a break of the entire long-term broadening pattern).