
witowskiantoni
@t_witowskiantoni

What symbols does the trader recommend buying?
Purchase History
پیام های تریدر
Filter
Signal Type
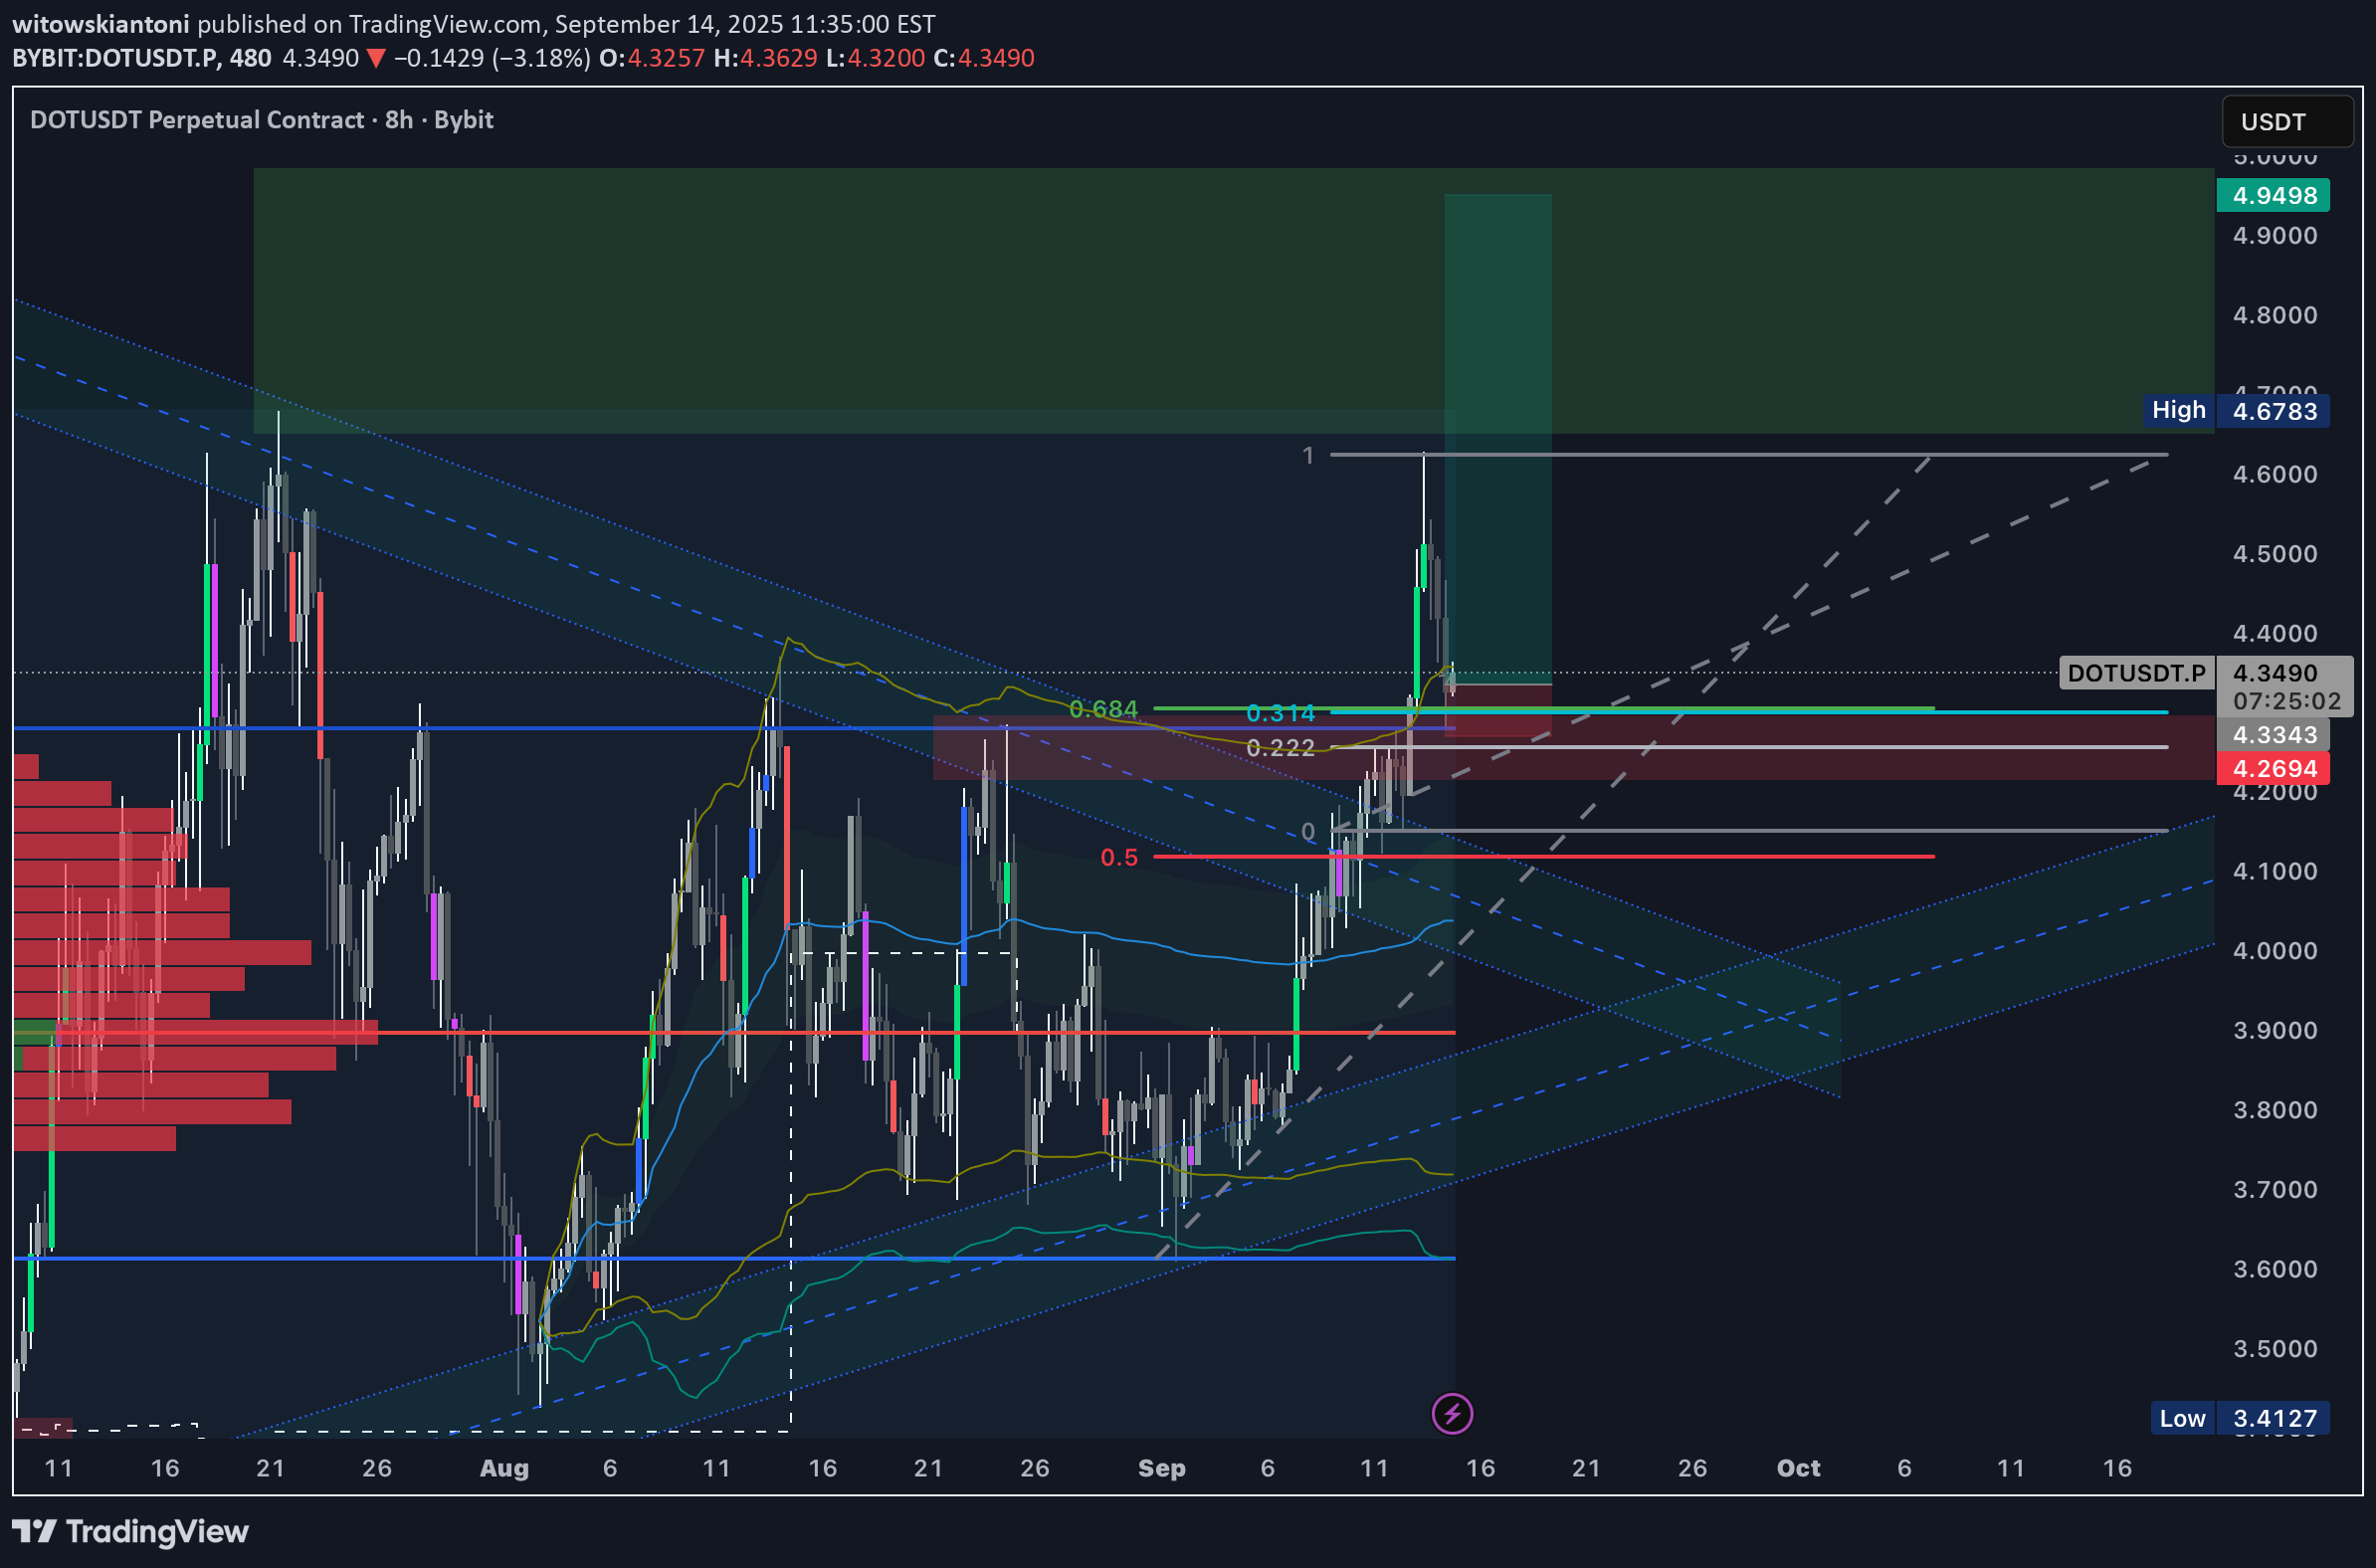
DOT is currently attacking a new high, but the question is whether this move is a true breakout or just a liquidity grab. This time I’m looking for a quick long setup. My main zone of interest is 4.25–4.31. This area lines up with multiple previous highs, which I now consider potential new support. It also includes: •the 0.314–0.222 retracement from the latest pump, •the 0.684 level (inverse of 0.314 from the bottom), •the highest anchored VWAP line. On top of that, divergences on RSI (14) and MACD (12:26) suggest price could push higher. We’ve already tested the triangle breakout, so I believe that phase of interest is over. From here, price may dip slightly lower, but it doesn’t have to. A ~3% move against the position is acceptable. I’m already in the trade. If DOT retests the 4.25–4.31 zone, I see it as a strong buying opportunity. Target: At least a new local high around 4.70, where I’ll take my first partial profit.
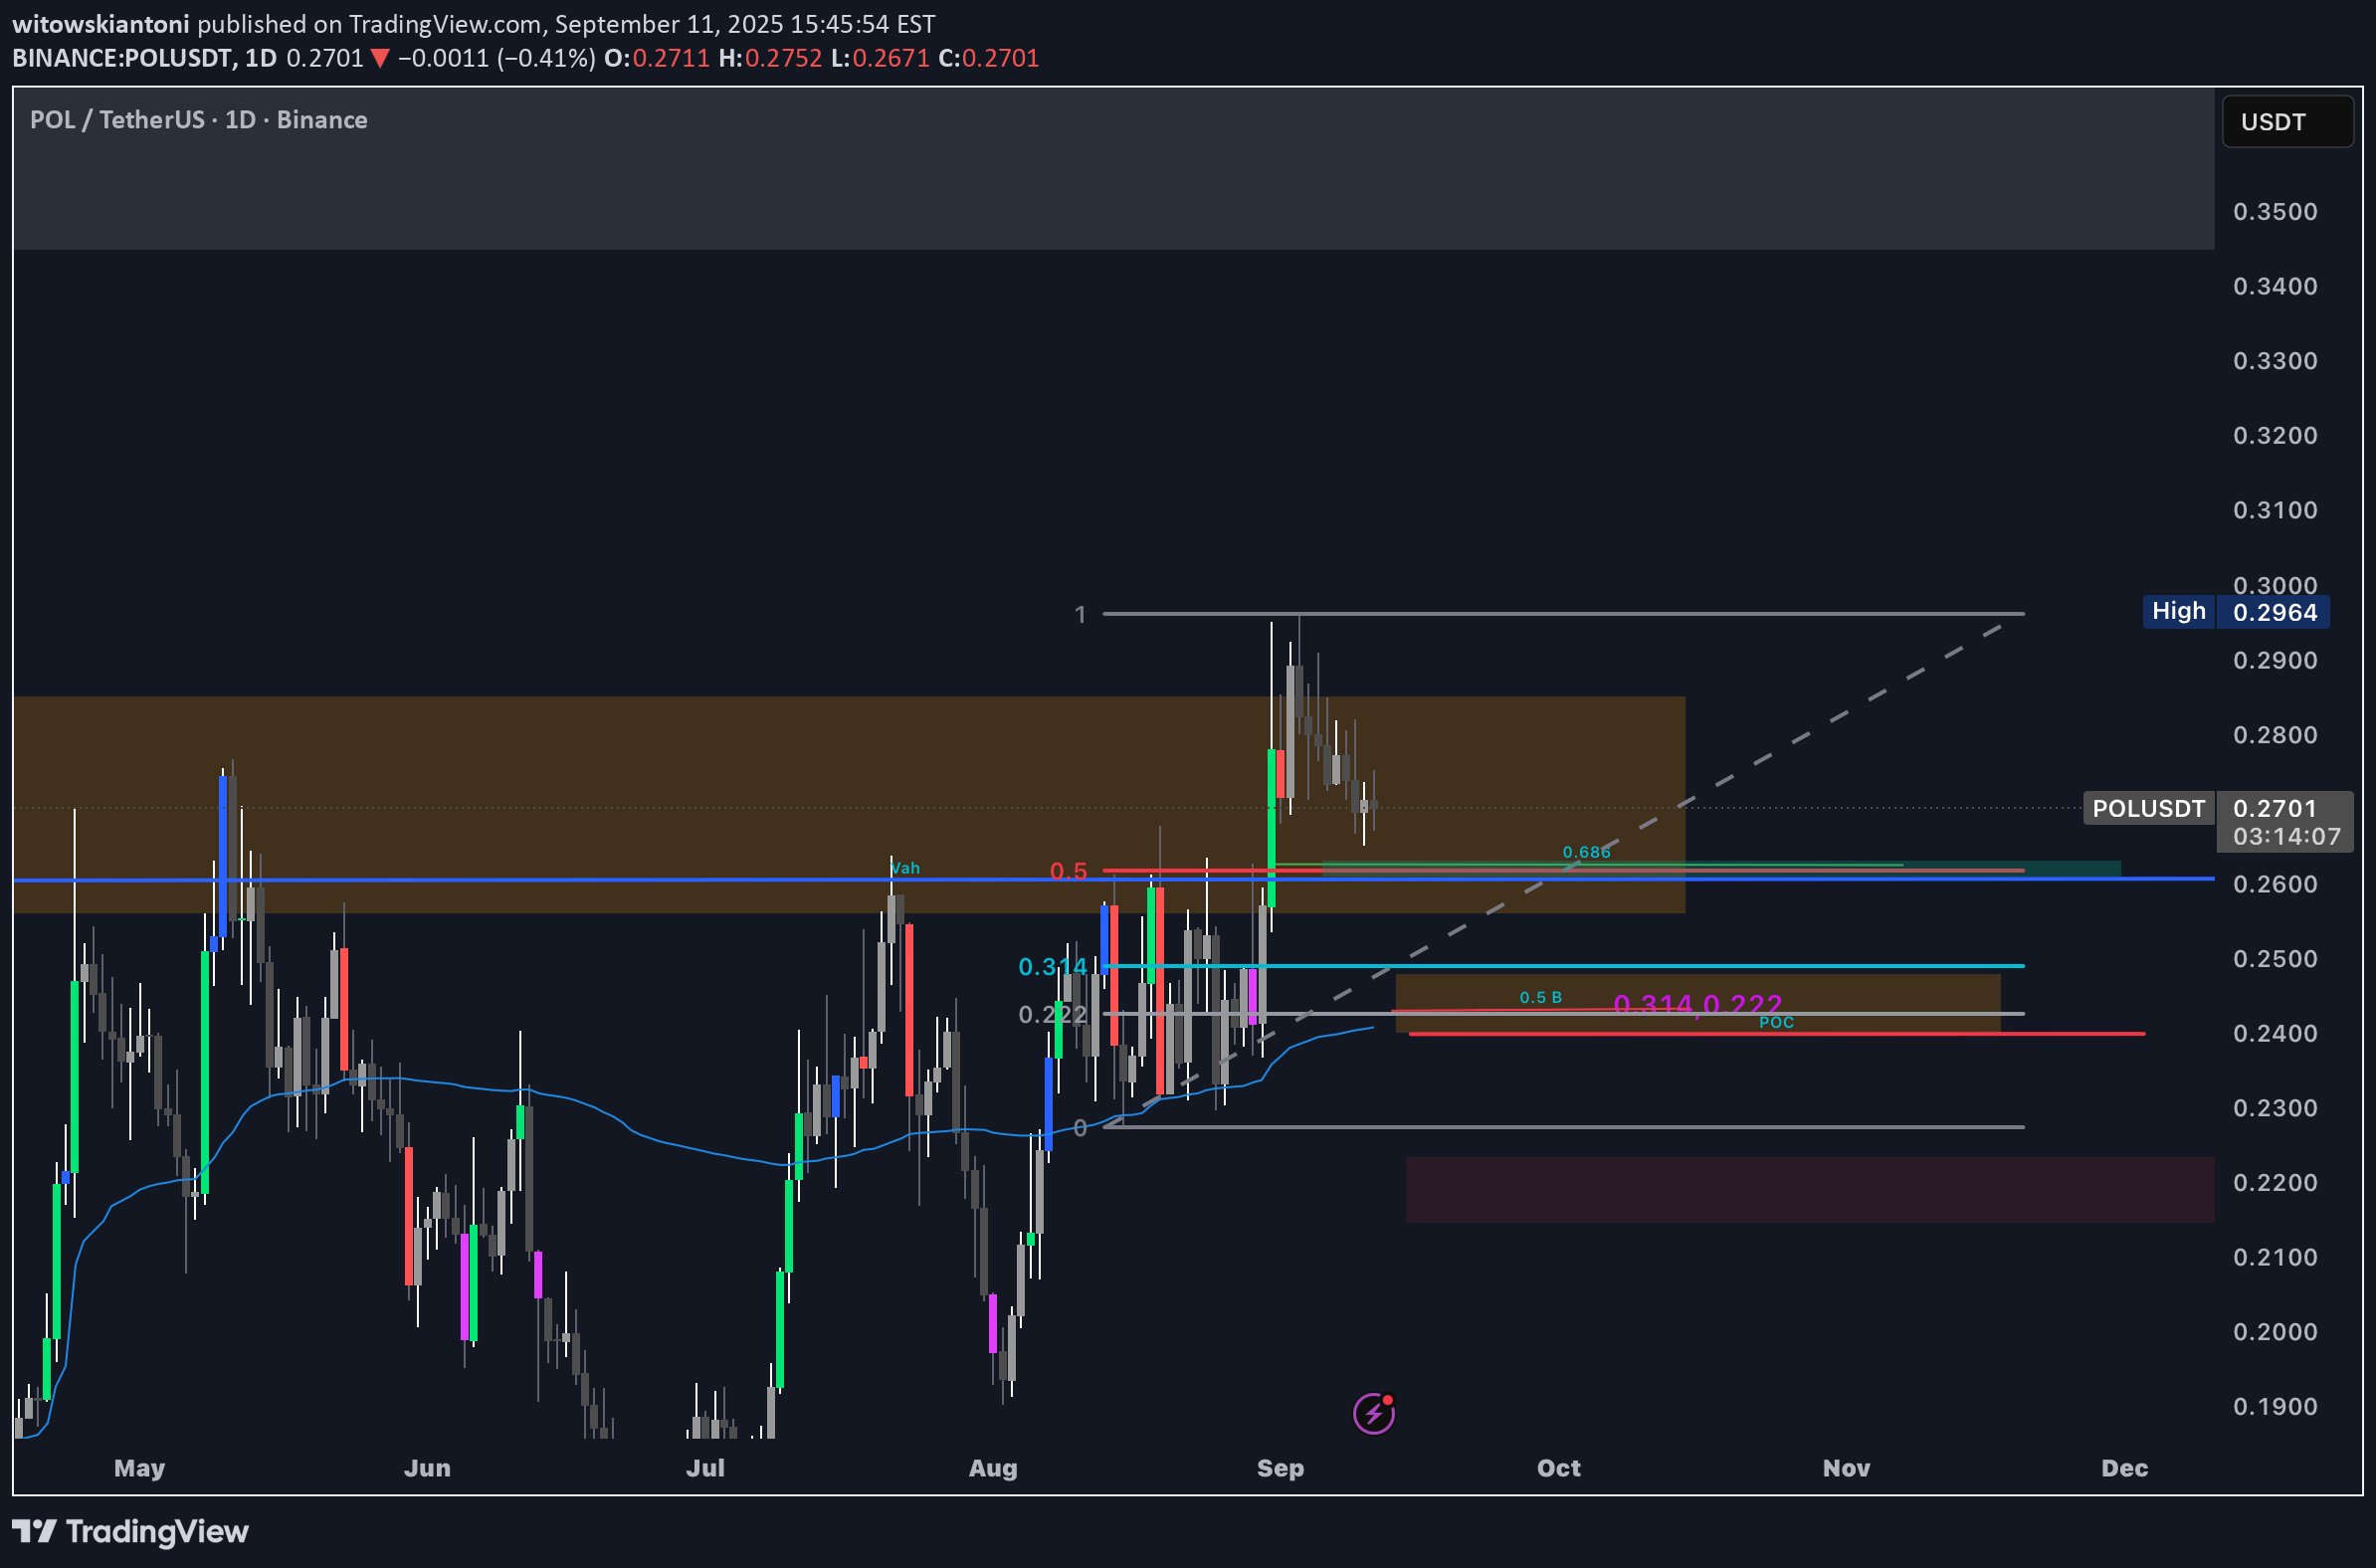
Let’s take a look at POL. After a long period of sideways movement, the coin finally broke out to the upside. This gives a high probability that, after a small retest, the price will continue upward. What makes me think this way is the strong daily (1D) candle with large volume that broke resistance by itself. To me, the chart looks very positive. Firstly, a lot of volume has gathered around 0.261, which is now acting as a resistance-turned-support zone. At this exact level, we also have the VAH (Value Area High), shown as the long blue line. Fibonacci retracement levels also support this zone, since we have the 0.5 and 0.686 levels from two different measurements lining up there. Of course, there’s also a volume gap on the daily candle, and the 0.5 retracement of the large green weekly (1W) candle hasn’t been tested yet. I also assume that bullish divergences will eventually add momentum and help fill this move. Another possible scenario is if we see a deeper retracement before the pump. In that case, one more zone to look for long opportunities is 0.239–0.248. Here we have: •the 0.5 and 0.314,0.222 zone from another measurement •the POC (Point of Control), which aligns with the VAH I mentioned above •confluence with VWAP, which should meet price exactly at the orange zone In my opinion, both ranges are strong, and where price eventually finds support depends on how much volume sellers put into the move down. The last possible support is 0.223–0.215, but I’m not really considering it for now since it’s quite far below the current price. My plan: •First entry around 0.26, with stop loss at 0.253 •If that level fails, I’ll look for another entry somewhere in the middle of the zone below, with stop loss placed under it •Current target: 0.36, but I’ll be watching price action closely Thanks for taking your time and reading it hope i helped a little. https://www.tradingview.com/x/3l7A1BFB
Wanted to put this earlier but didn’t have time. The place I believe the correction move is about to end is in the range between 0.286–0.2905. That’s because this level holds a lot of liquidity — firstly, it’s under wicks, so it’s obvious that stop losses are placed slightly below. Another point is that we have several important Fibonacci levels there, including 0.222, which closes the 0.314–0.222 area. There’s also an FVG on the 1D timeframe marking the upper side of the range. At the bottom, we can see the 0.5 level from the 1W wick, and the same case with the 1M wick, which makes this zone a strong confluence. We should also keep in mind the triangle formation, which gives strong hope that this could be the last touch of the bottom before a huge pump. Last but not least, the lower VWAP is holding right in the middle of the red zone I drew. P.S. Divergences are working in our favor if we stop there. So the plan is to place 3 orders: •one at the top, •one in the middle, •and the last one slightly below, around 0.284. Stop-loss somewhere around 0.28. If we break this area, I’ll be looking for shorts targeting a new ATL — from the SONIC chart, not FTM of course. Let’s cross our fingers. I wouldn’t like to see SONIC drop below 0.25, but everything is possible, I guess. https://www.tradingview.com/x/FiYYofLU
We see this bullish novel on the 1D timeframe, which is a strong formation in this kind of trend. Next, one of the most important Fibonacci levels in my opinion is 0.314, which is closing our volume gap (visible more clearly on the 1W timeframe). These two confluences, plus the divergence seen from the 1D TF downward, make me think of a possible slight downtrend from the 223–229 area, with potential liquidity grabs up to 232. In that case, we could be back at 193 and then continue the ride toward a new ATH. One thing we need to keep in mind (but just as a possibility) is the Head & Shoulders formation from March 2024, with the head at the ATH and a potential right shoulder forming right now. It’s a darker scenario, but we shouldn’t forget about it. So, I remain bearish until we break above $240. Let’s see what the market gives us.
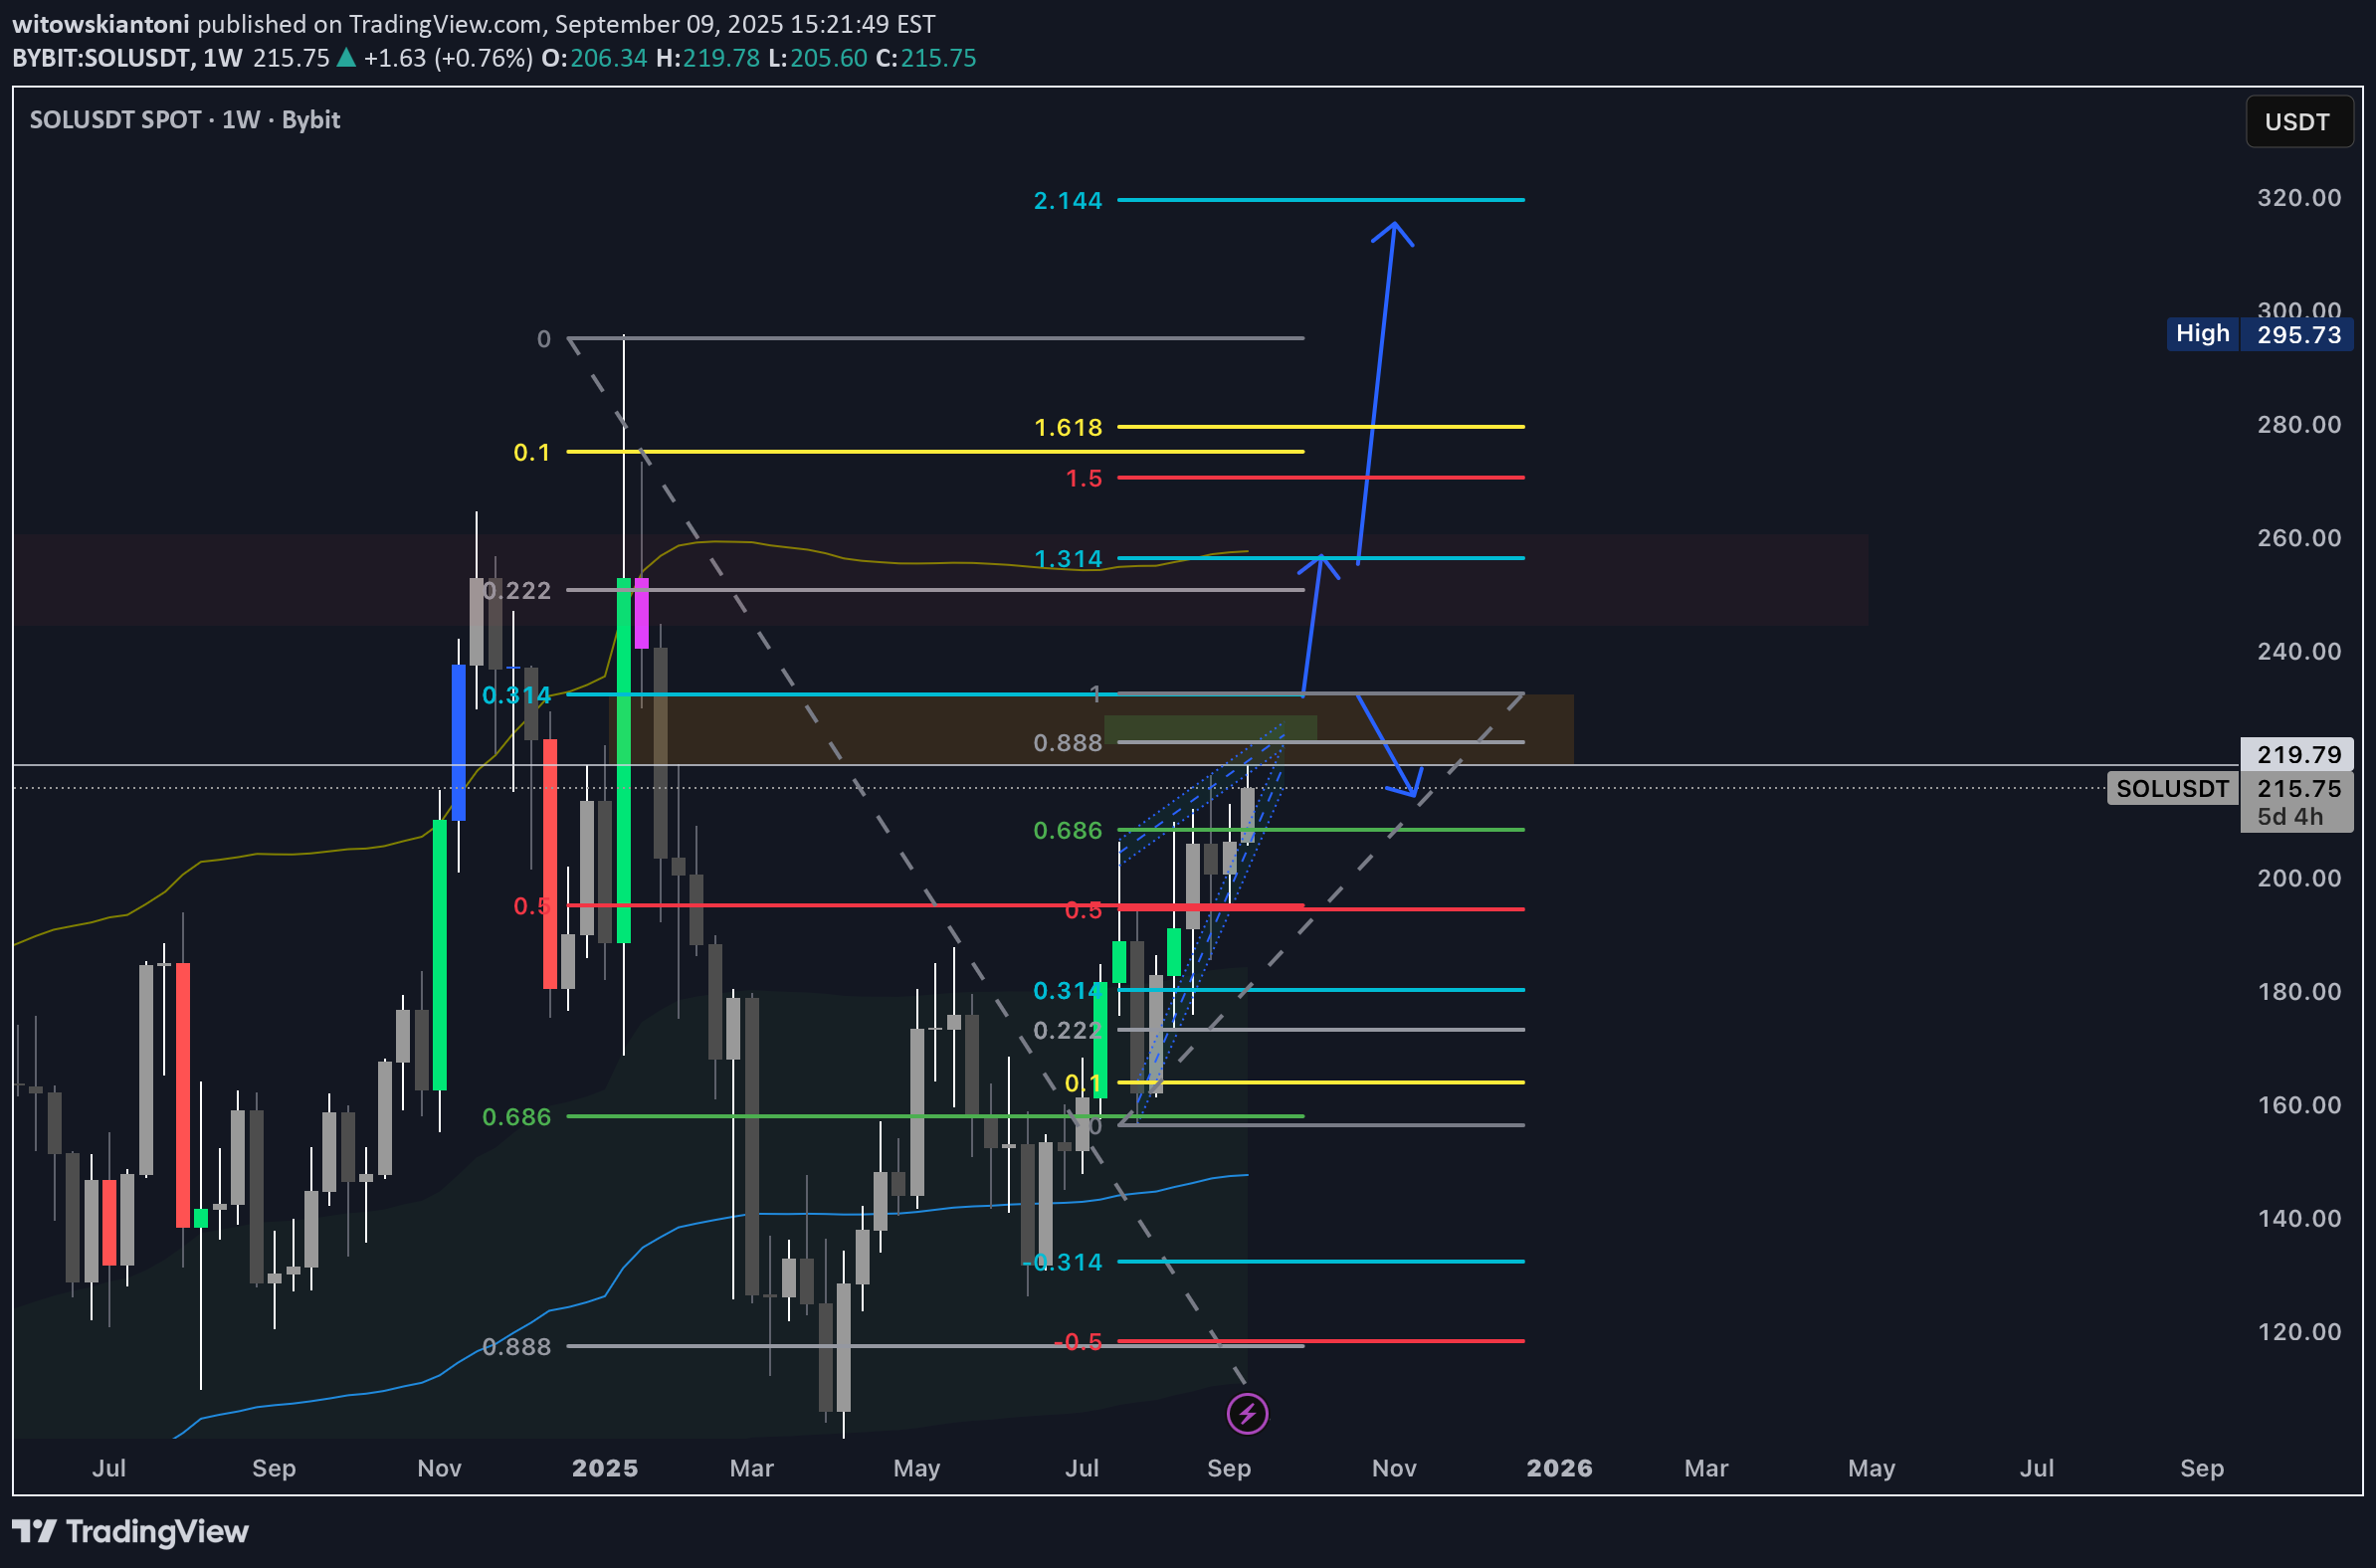
We see this bullish novel on 1d timeframe which is strong formation in that kind of trend. Next one of the most important levels of fibonacci imo ofc 0.314 which is closing our volume gap seeable better at 1w timeframe. So this 2 confluences plus divergence seeable from 1d TF down makes me thinking of possible slight downtrend from area 223-229. Possible lq till 232. In that case we could be back at 193 and then continue ride for ATH Thing we need to concentrate our attention but just a little lets keep it possible is head n shoulders formation from march 2024 with head on ATH and possible right shoulder forming right now. Its dark scenario but lets not forget about it. So im bearish until we break 240 $ Lets see what market will give us
Disclaimer
Any content and materials included in Sahmeto's website and official communication channels are a compilation of personal opinions and analyses and are not binding. They do not constitute any recommendation for buying, selling, entering or exiting the stock market and cryptocurrency market. Also, all news and analyses included in the website and channels are merely republished information from official and unofficial domestic and foreign sources, and it is obvious that users of the said content are responsible for following up and ensuring the authenticity and accuracy of the materials. Therefore, while disclaiming responsibility, it is declared that the responsibility for any decision-making, action, and potential profit and loss in the capital market and cryptocurrency market lies with the trader.