
wesheets
@t_wesheets

What symbols does the trader recommend buying?
Purchase History
پیام های تریدر
Filter
wesheets
INVERSE HS MACRO
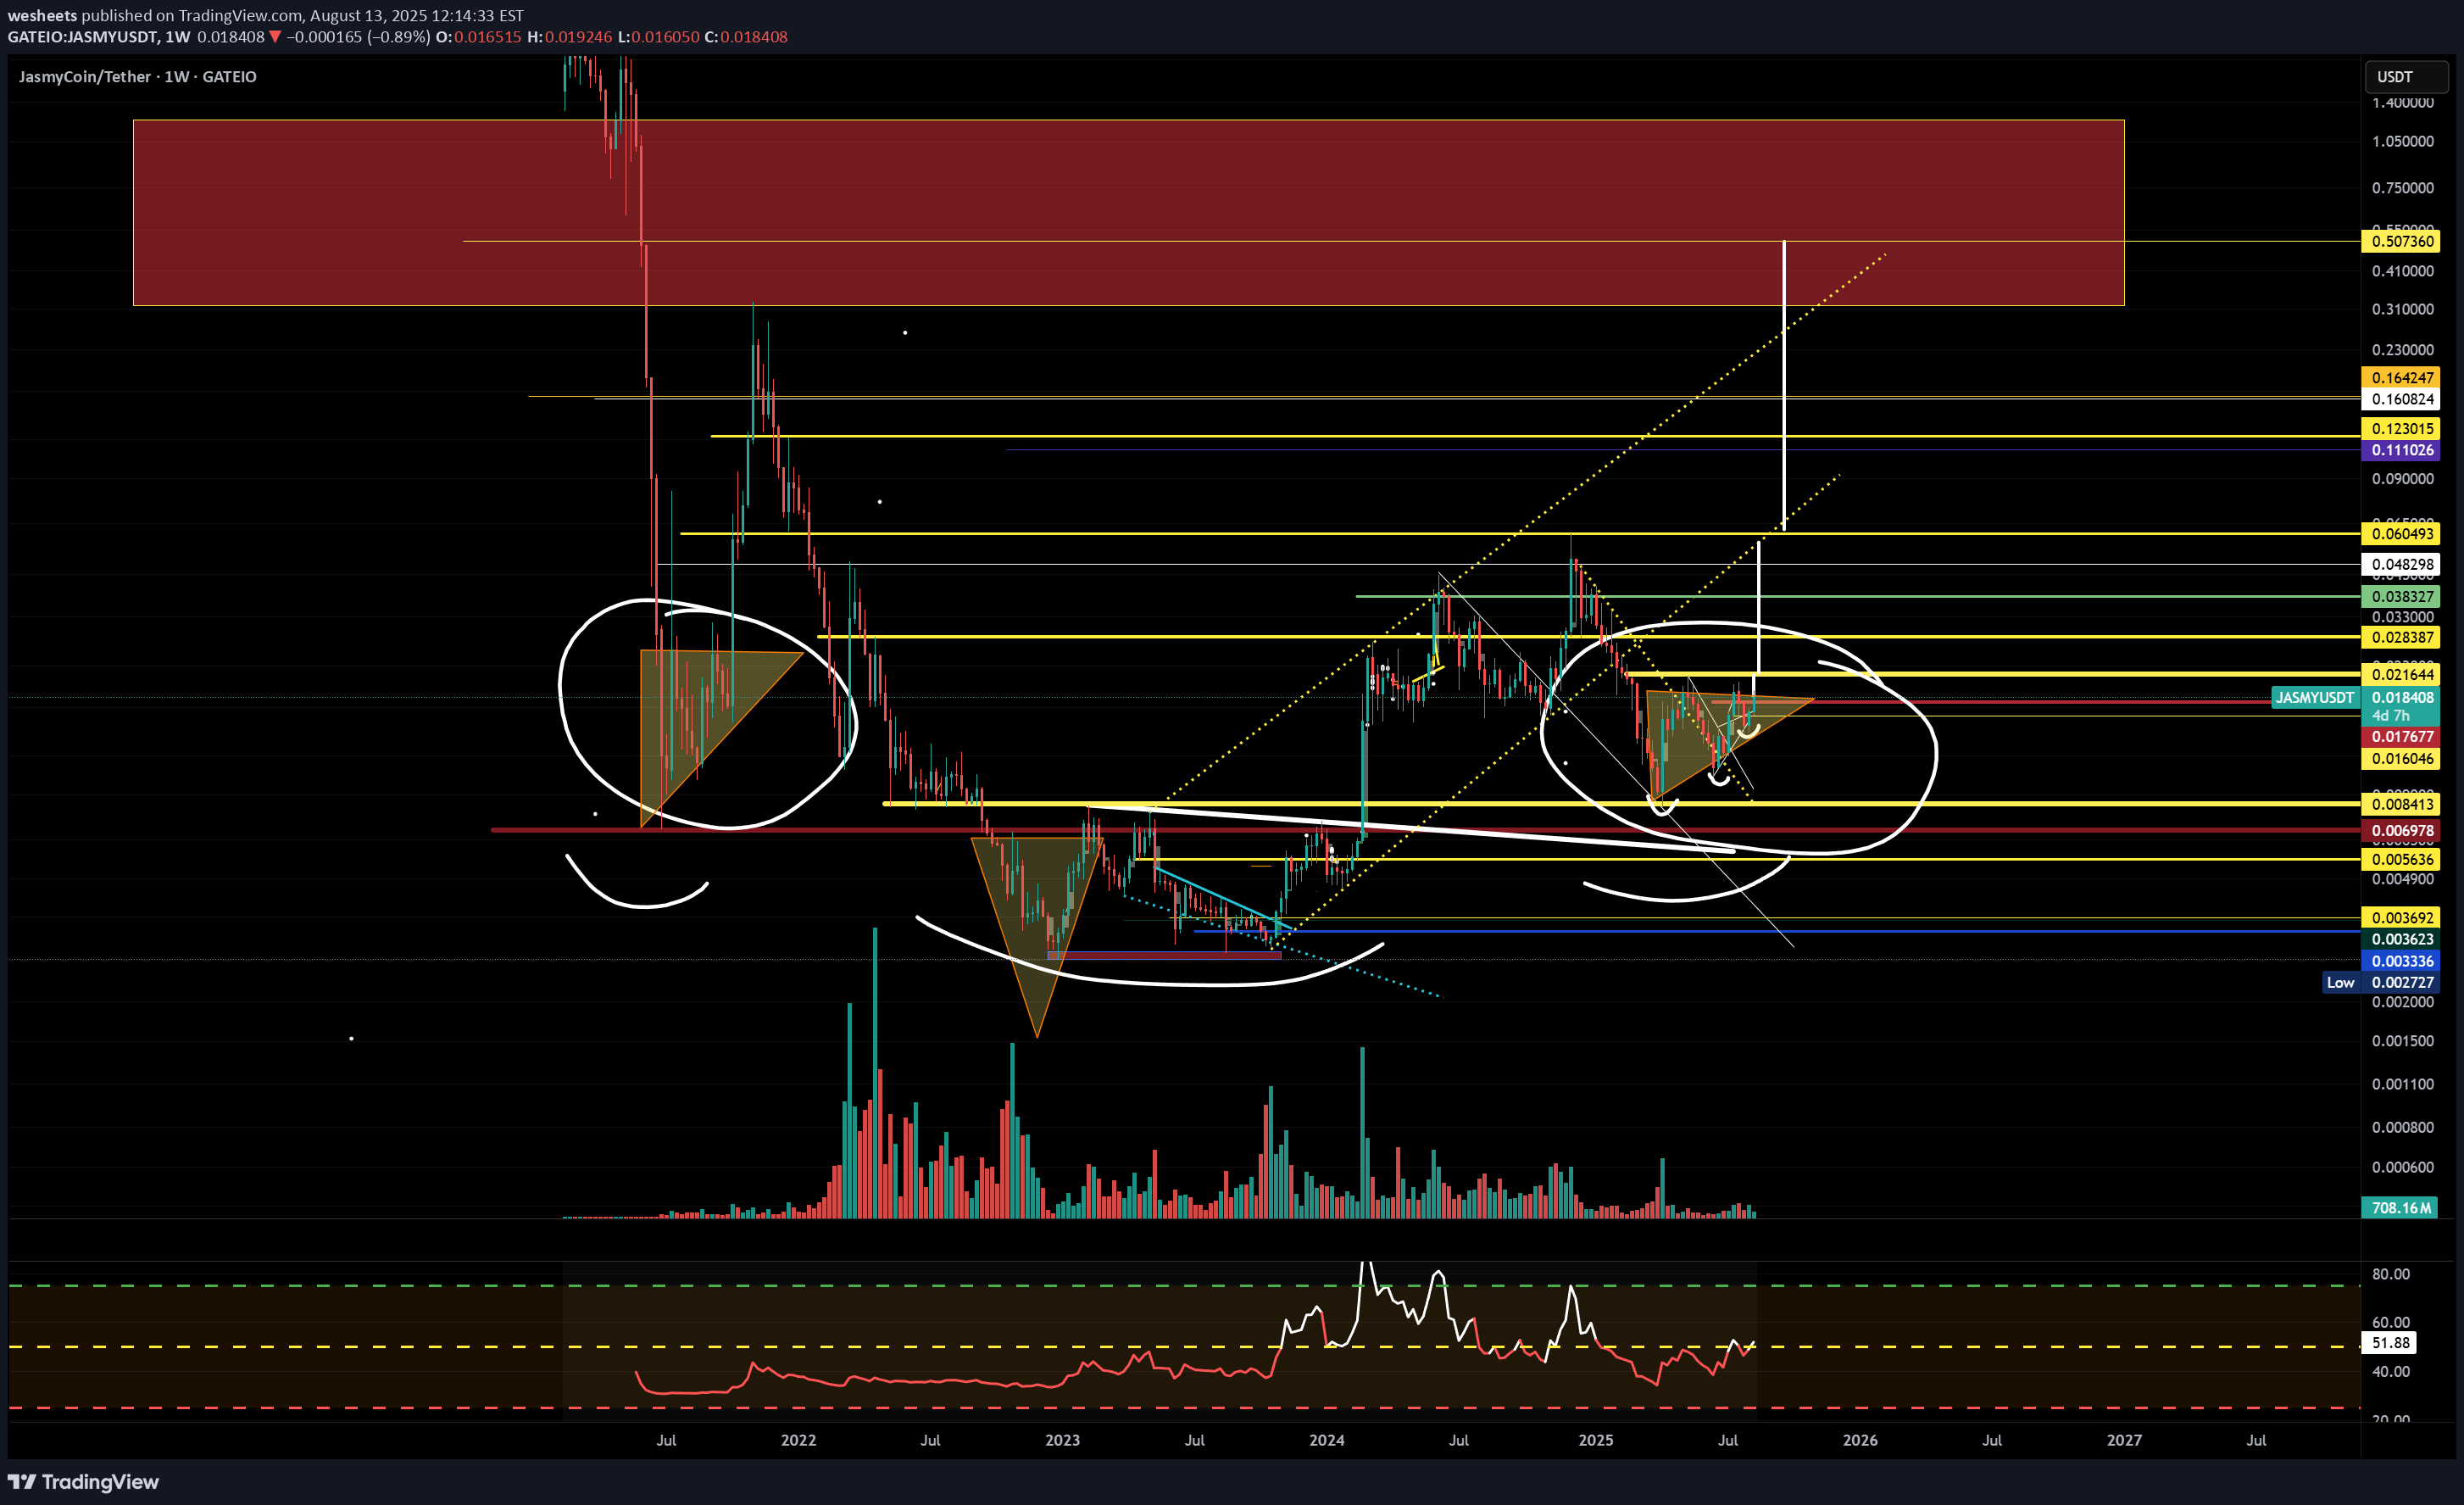
Been following JASMY for a couple years now...took it from the lows and sold waiting for the macro right shoulder to form. No coincidence that it is putting in the same macro weekly ascending triangle on the right shoulder that it did on the left shoulder from 2021. It held the other day while the market dumped and it now in a LTF bull flag formation. If it runs back to neckline of the ascending triangle it could be a cascade breakout the likes of 2021. Good luck
wesheets
MUST LONG JASMY AT .007

Here we have one of the typical JASMY charts that DO NOT give historical price data. GATEIO is the only chart I have found with historical price data. I have this chart and the GATEIO chart up side by side on JASMY constantly. You can see in this weekly chart, the cloud dips all the way down to .006-.007 for one week only (next week). On the GATEIO chart, it is similar but with the historical data, we can see that the level lines up perfectly with a much older wick and is the macro support level of the adam and eve structure it broke out of. I have been eyeing this macro inverse HS setup since 2023 while I was accumulating JASMY in the lows. There is a possibility with BTC losing monthly support for a nice big dump and JASMY has lost monthly support as well. Bottom of the weekly cloud is a must long for me and will put me in HODL mentality on this coin. Good luck. I will post the gateio chart below for reference. Edge
wesheets
Last Chance for Matic?

Possible inverse HS on the daily. We have the uprade taking place on September 4th. Macro double bottom in the .33 range. If this is an inverse HS pattern, it takes it back to 1.07 and I think the buying pressure and FOMO would be too great and might force it to break out of the consolidation for new highs
wesheets
SHORT IDEA HEAD AND SHOULDERS

Floki has already broken down from a HS pattern and is now back for the retest. The daily 200ma is a good invalidation entry on the short and is testing the lower time frame bearish HS structure it originally broke down from. Daily closes over the 200ma invalidate. Could be a good bearish trend trade.
wesheets
Time to get LONGS ready on CRV

First test of the 4H fvg here and 2D and weekly resistance turned support. If it loses the 4H fvg, would be looking for .26 for the next long entry. Happy trading.
wesheets
Testing macro support

RVN has a pretty clean chart. We can see that price broke out of the macro falling wedge and is now back testing it and holding as support which is bullish. Note that the wick low was equal to an old wick low. The saying goes that equal lows and highs are meant to be taken. However, if RVN holds this support and the bull run continues with BTC, I could see this rather being a macro W formation and price could rise back to the most recent high and begin the breakout back to the ATH. Note the volume on the candle with the recent high...the most buying volume RVN ever had in a week.Broke out of the falling wedge.
wesheets
If there was ever a time to buy..

Here we are on STARL coming to the last weekly fvg and retesting the lows. If you were buying the very top but are not buying the bottom, why? Very clear invalidation and so far holding while the market dumps. Bought spot bag and crossing fingers the whales are accumulating.
wesheets
Daily Inverse HS Setup---6 Month support looks tested

I was charting 6 month supports and VET caught my eye. Here we are seeing the lower time frame daily structure that has formed with inverse head and shoulders. But the 6 month chart is very impressive and the head of this daily inverse HS tested deeper into the 6 month support. This is an easy invalidation daily trade with the 6 month thesis. This could very well be bottomed and ready for the bull run. We'll see.
wesheets

wesheets
MATIC LONG OPP

The USD chart is a complicated chart. We have now taken liquidity from the old low but only to test the previous low OB. I think a bounce to .70 is a pretty easy trade here BUT the BTC chart is testing a major low OB and a big bounce on the BTC chart is highly likely. If it gets that bounce, we could see the USD attempt to take out the previous macro high. I could see a short squeeze take place with short expecting the LH. This is really dependent on BTC breaking out here. So, tp some at .70 but maybe hold some for serious bull run gains.
Disclaimer
Any content and materials included in Sahmeto's website and official communication channels are a compilation of personal opinions and analyses and are not binding. They do not constitute any recommendation for buying, selling, entering or exiting the stock market and cryptocurrency market. Also, all news and analyses included in the website and channels are merely republished information from official and unofficial domestic and foreign sources, and it is obvious that users of the said content are responsible for following up and ensuring the authenticity and accuracy of the materials. Therefore, while disclaiming responsibility, it is declared that the responsibility for any decision-making, action, and potential profit and loss in the capital market and cryptocurrency market lies with the trader.