
wealthsmith23
@t_wealthsmith23

What symbols does the trader recommend buying?
Purchase History
پیام های تریدر
Filter
wealthsmith23
خرید بیت کوین: فرصت خرید در محدوده حمایتی کلیدی با هدف سود بالا!
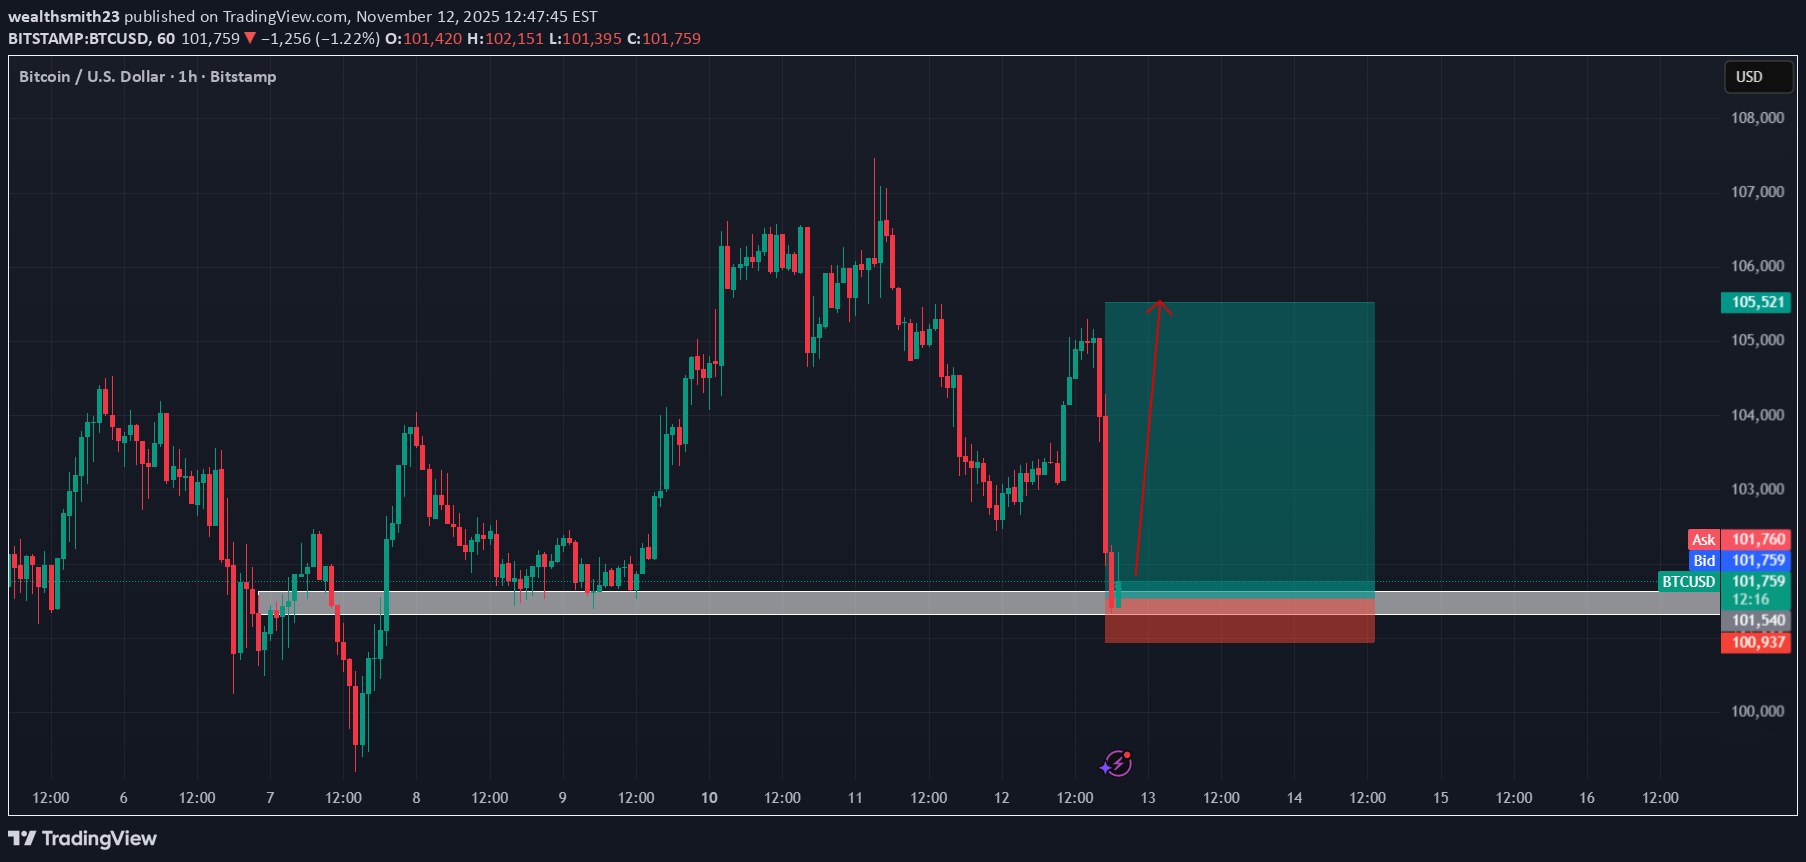
This is a long (buy) setup off a key support zone with a tight stop and a higher target. The trade works if buyers continue defending the grey zone. A break below it would invalidate the bullish bias.
wealthsmith23
پیشبینی سقوط بیت کوین: آیا ریزش تا ۱۰۰ هزار دلار قطعی است؟
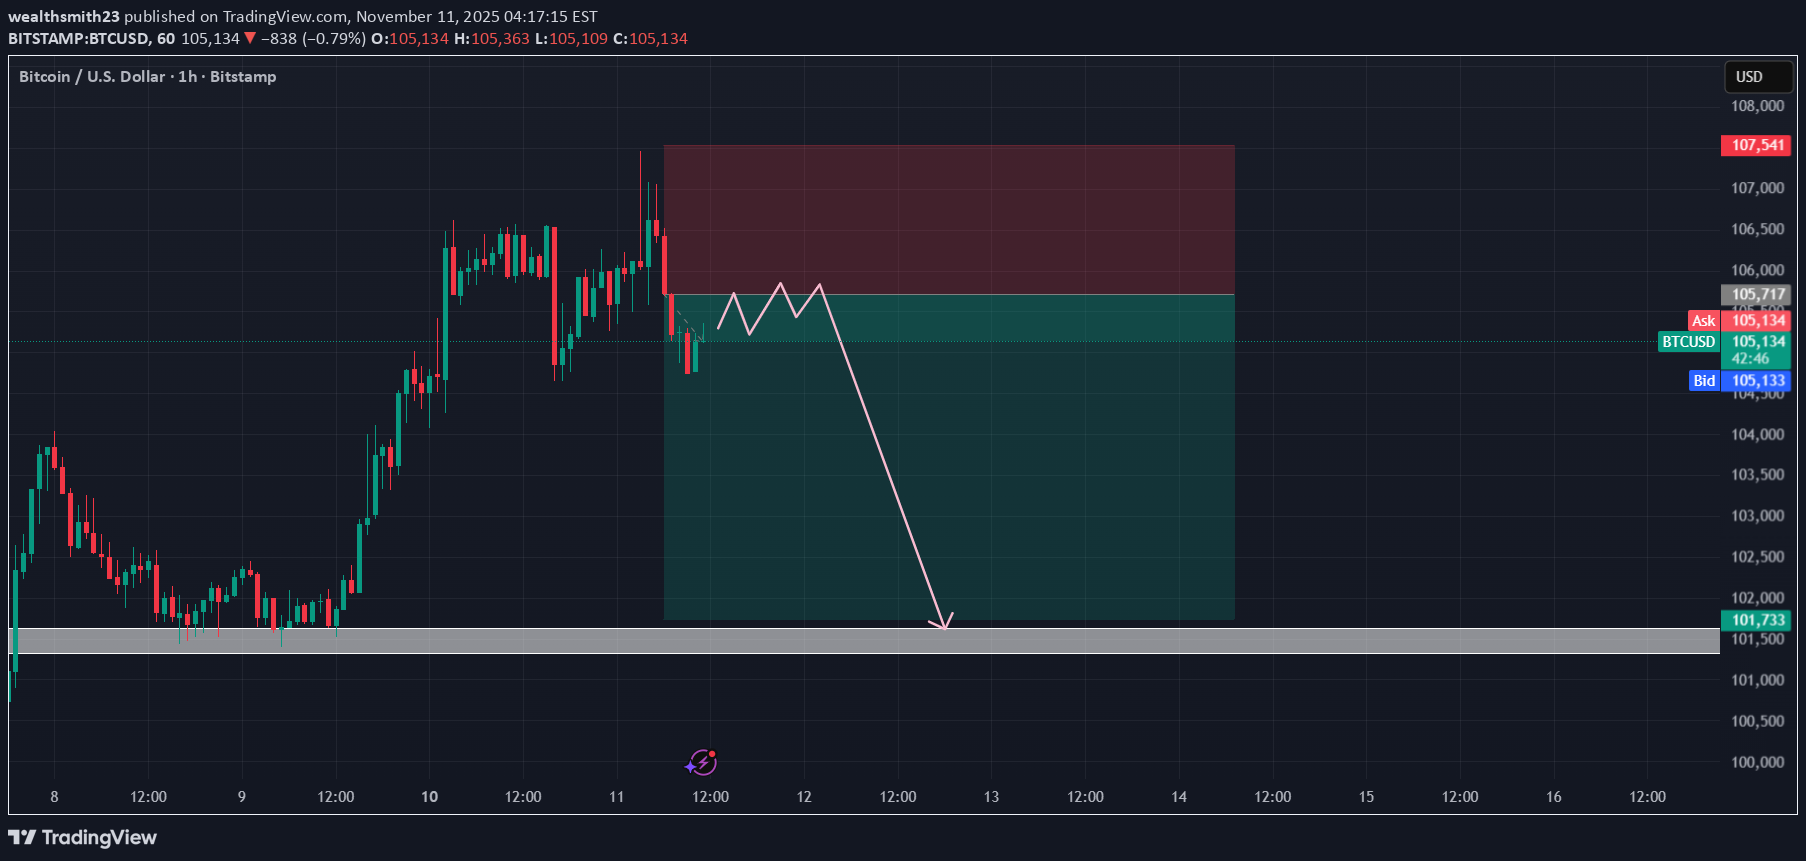
Primary bias: Bearish retracement expected. Next move: Short-term fake-out or range compression → drop to $101,700 support. Risk note: This structure is a pullback within a larger bullish trend; short may be counter-trend if higher timeframe remains bullish.
wealthsmith23
پیشنهاد فروش بیت کوین: فرصت فروش طلا در محدوده مقاومت کلیدی!
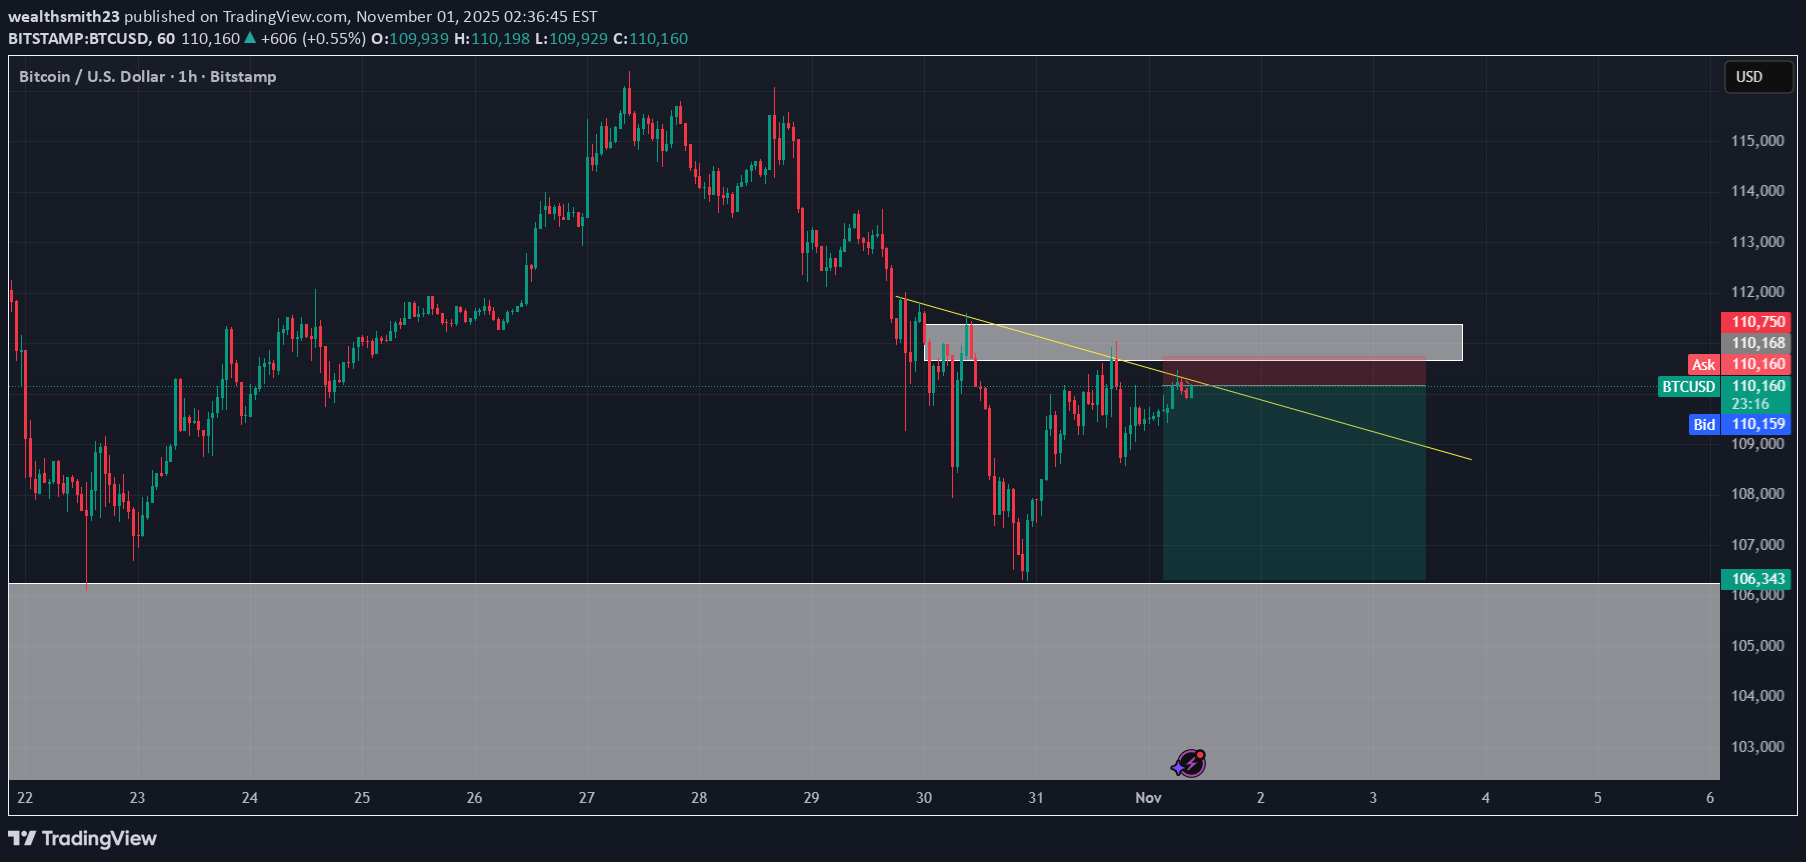
Price is currently retesting a descending trendline after a short-term pullback. The setup indicates bearish momentum as price approaches the supply zone (resistance area) between 110,100 – 110,750. A rejection from this zone could trigger a downward continuation toward the 106,300 region, aligning with previous liquidity levels. Bias remains bearish unless price breaks and holds above 110,800 with strong momentum.
wealthsmith23
wealthsmith23
SELL US500
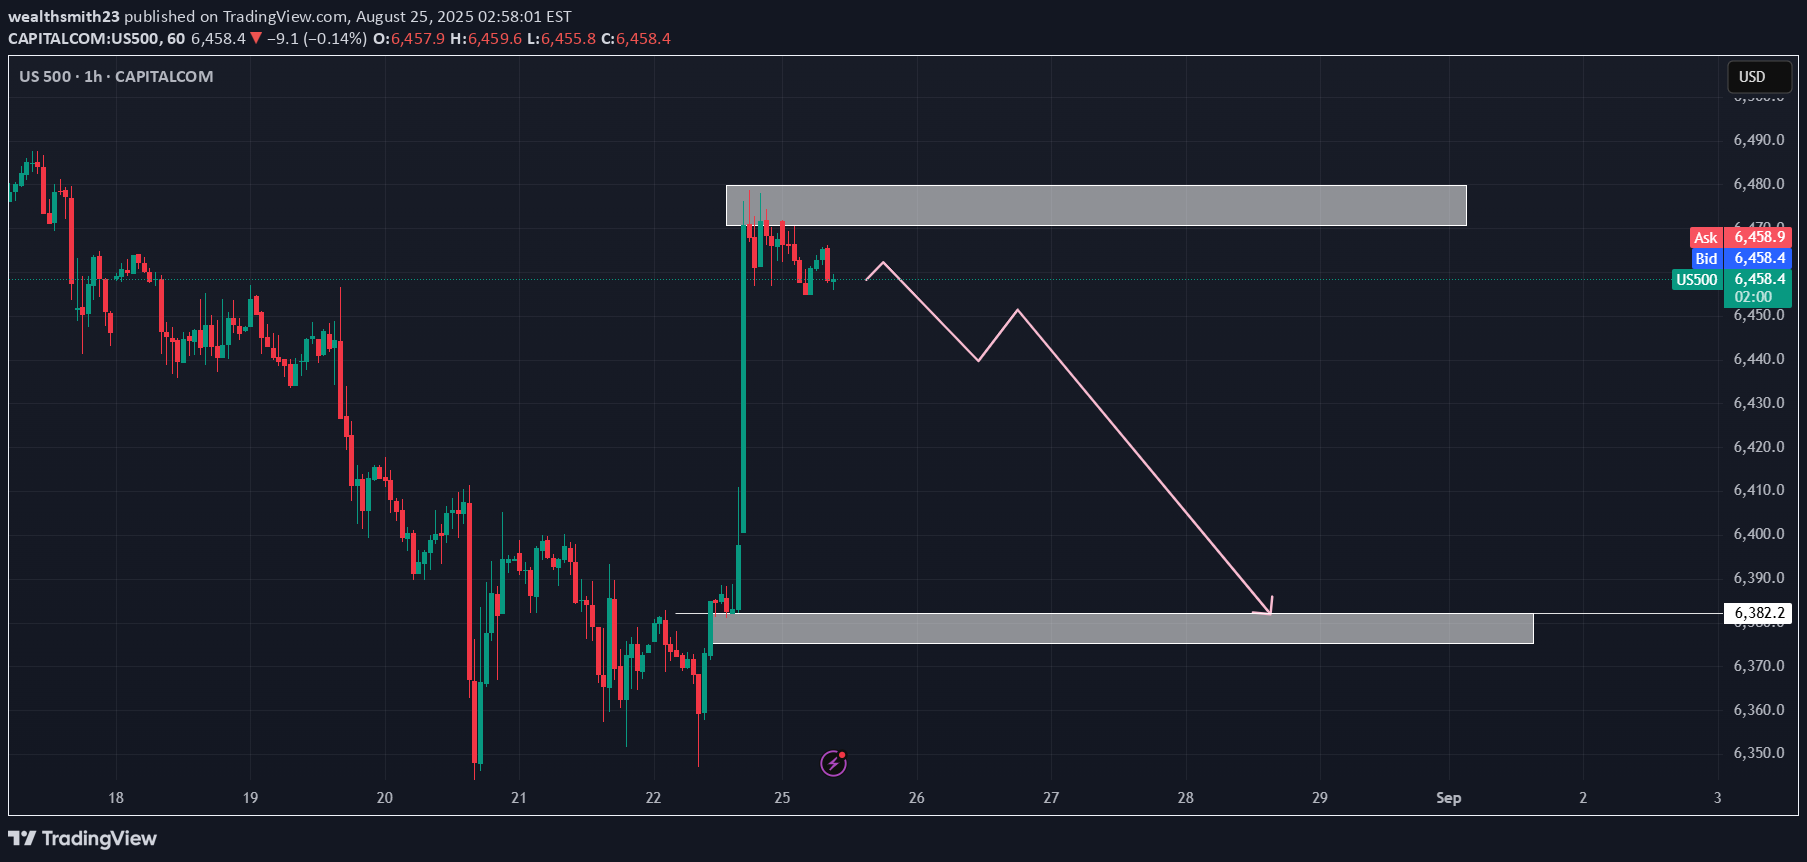
S&P 500 (US500) is showing bearish momentum, targeting a move down to 6,382.2. The market favors sellers below recent resistance, so maintain a short bias. Place stops above the latest swing high to manage risk.
wealthsmith23
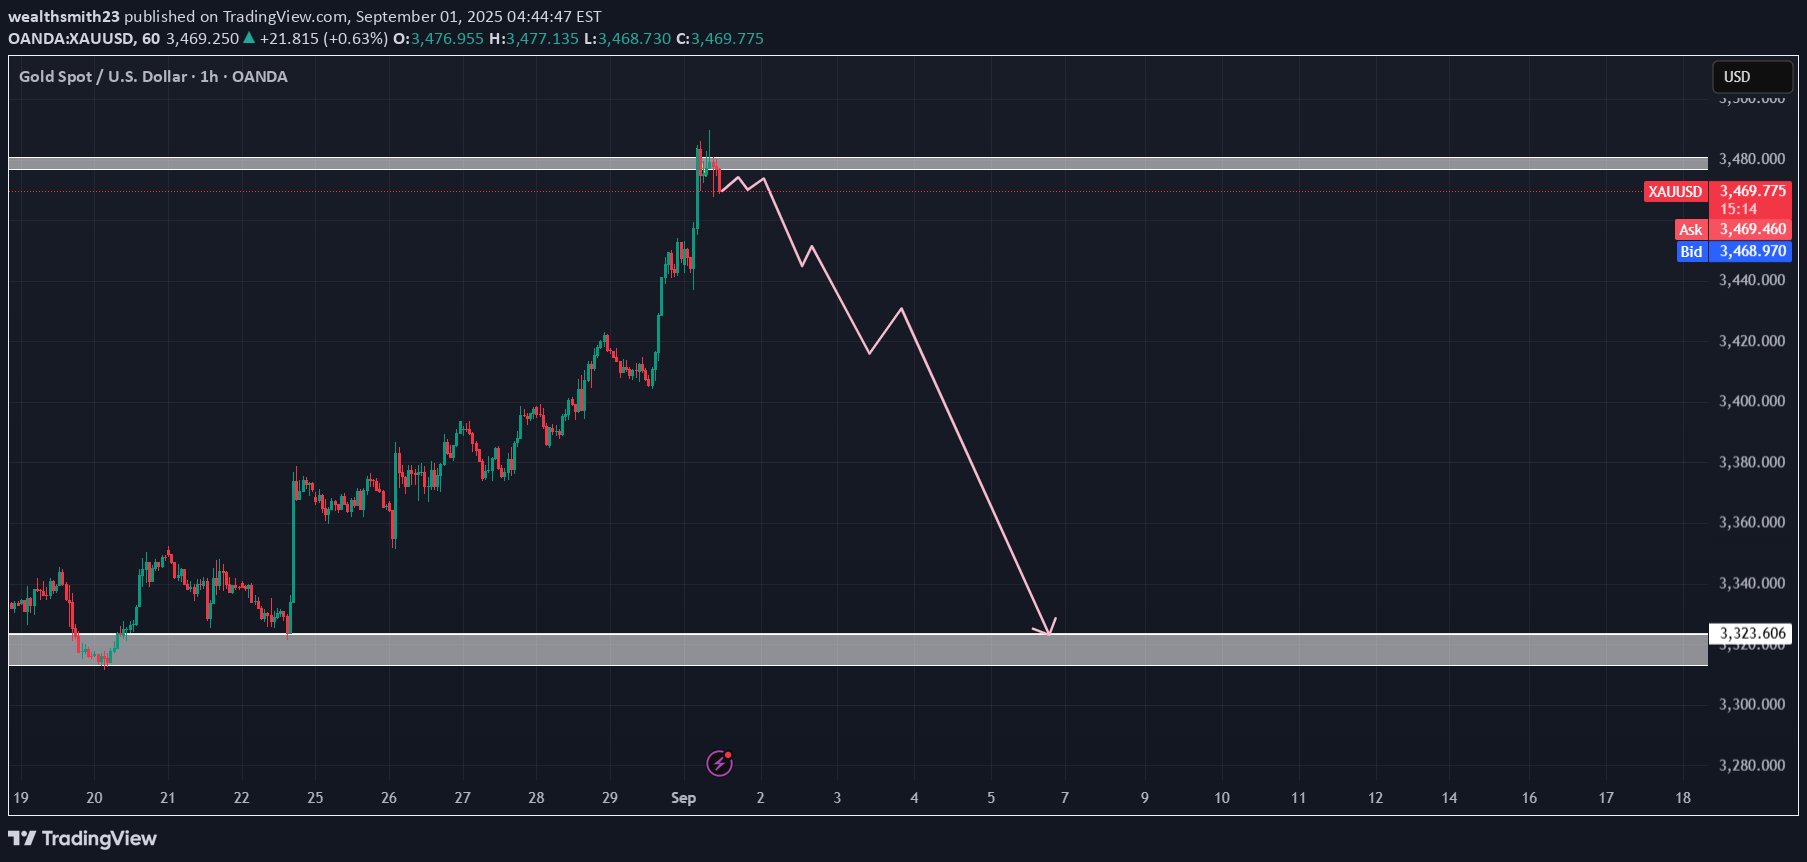
XAUUSD SELL
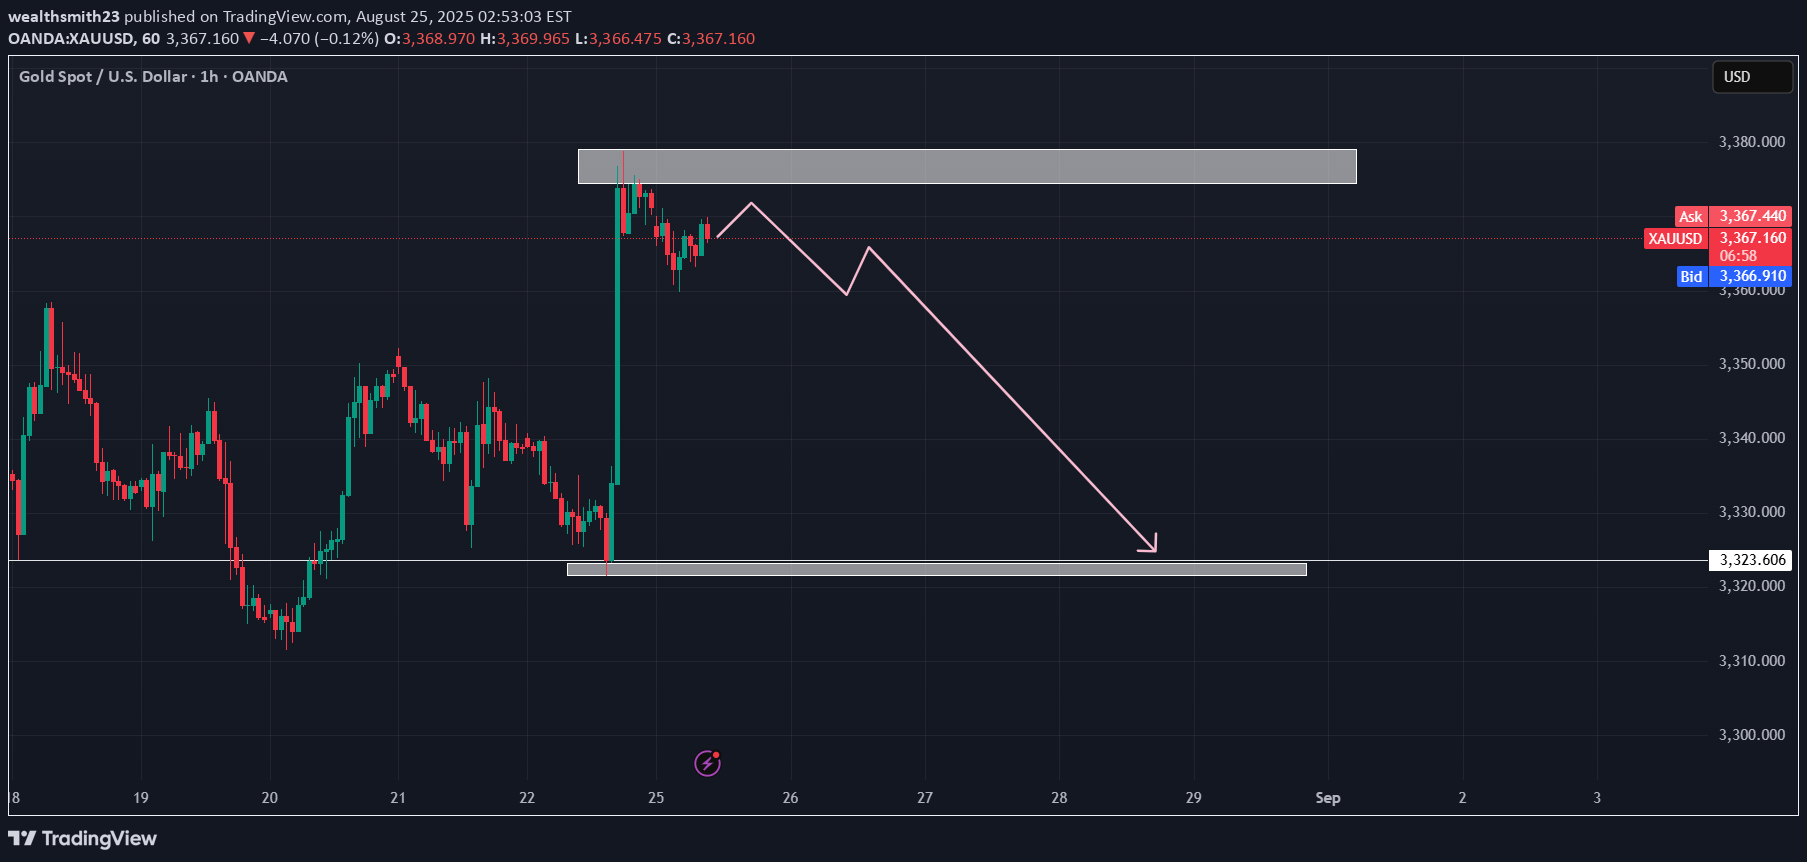
Gold (XAU/USD) is showing signs of weakness, targeting a move down to 3323.606. The market favors sellers below recent resistance, so maintain a short bias. Place stops above the latest swing high to manage risk
wealthsmith23
Sell XAUUSD

Gold (XAUUSD) is currently in a short-term downtrend and is likely to continue dropping towards $3200 and $3137 support levels, as long as price stays below the $3325-$3365 resistance zone. Traders may look for sell opportunities on lower timeframe pullbacks or rejections near broken support.
wealthsmith23
BUY BTCUSD

Bitcoin (BTC/USD) is showing signs of a strong bullish reversal off a major demand zone at $98,000.** If price holds above this level and confirms with continued bullish candles, the likely trajectory is toward the resistance zone around $110,000–$111,200. The forecast structure suggests a clean trend recovery pattern. However, manage risk tightly — as a breakdown below the demand zone could flip the narrative to bearish.
wealthsmith23
Buy Gold

The $3,390 support level remains a key battleground for bulls and bears. A strong hold here opens the path for a high-momentum breakout, potentially propelling XAU/USD to test the $3,720–$3,760 region. This setup offers a clear structure, supported by both price action and historical behavior, making it a high-probability bullish opportunity — provided the zone remains intact.
wealthsmith23
Sell Setup BTCUSD

Currently, BTC/USD is approaching a key supply zone between $107,800 – $108,600, where price previously faced strong rejection. My expectation is that price will react similarly upon retest. 🧠 Trade Idea: I'm anticipating a fakeout or liquidity grab above the zone, followed by a lower high formation. Once this confirmation occurs, I’ll be looking for a short entry, targeting the major demand zone below, around $100,800 – $101,600. ✅ Confluences: Previous price rejection from this same resistance zone. Clean bearish imbalance below that still needs filling. Lower timeframes showing signs of exhaustion as we approach resistance. 🕵️♂️ Entry Trigger: I’ll wait for bearish price action within or just above the yellow resistance zone (e.g. bearish engulfing, lower high, or break of structure). 📉 Target: TP Zone: $101,000 area SL: Just above the fakeout zone to manage risk effectively.DONE
Disclaimer
Any content and materials included in Sahmeto's website and official communication channels are a compilation of personal opinions and analyses and are not binding. They do not constitute any recommendation for buying, selling, entering or exiting the stock market and cryptocurrency market. Also, all news and analyses included in the website and channels are merely republished information from official and unofficial domestic and foreign sources, and it is obvious that users of the said content are responsible for following up and ensuring the authenticity and accuracy of the materials. Therefore, while disclaiming responsibility, it is declared that the responsibility for any decision-making, action, and potential profit and loss in the capital market and cryptocurrency market lies with the trader.