
vodoo666
@t_vodoo666

What symbols does the trader recommend buying?
Purchase History
پیام های تریدر
Filter
اپل رکورد تاریخی شکست: راز ساختار تقاضا و هدف ۲۰۸ دلاری سهام AAPL
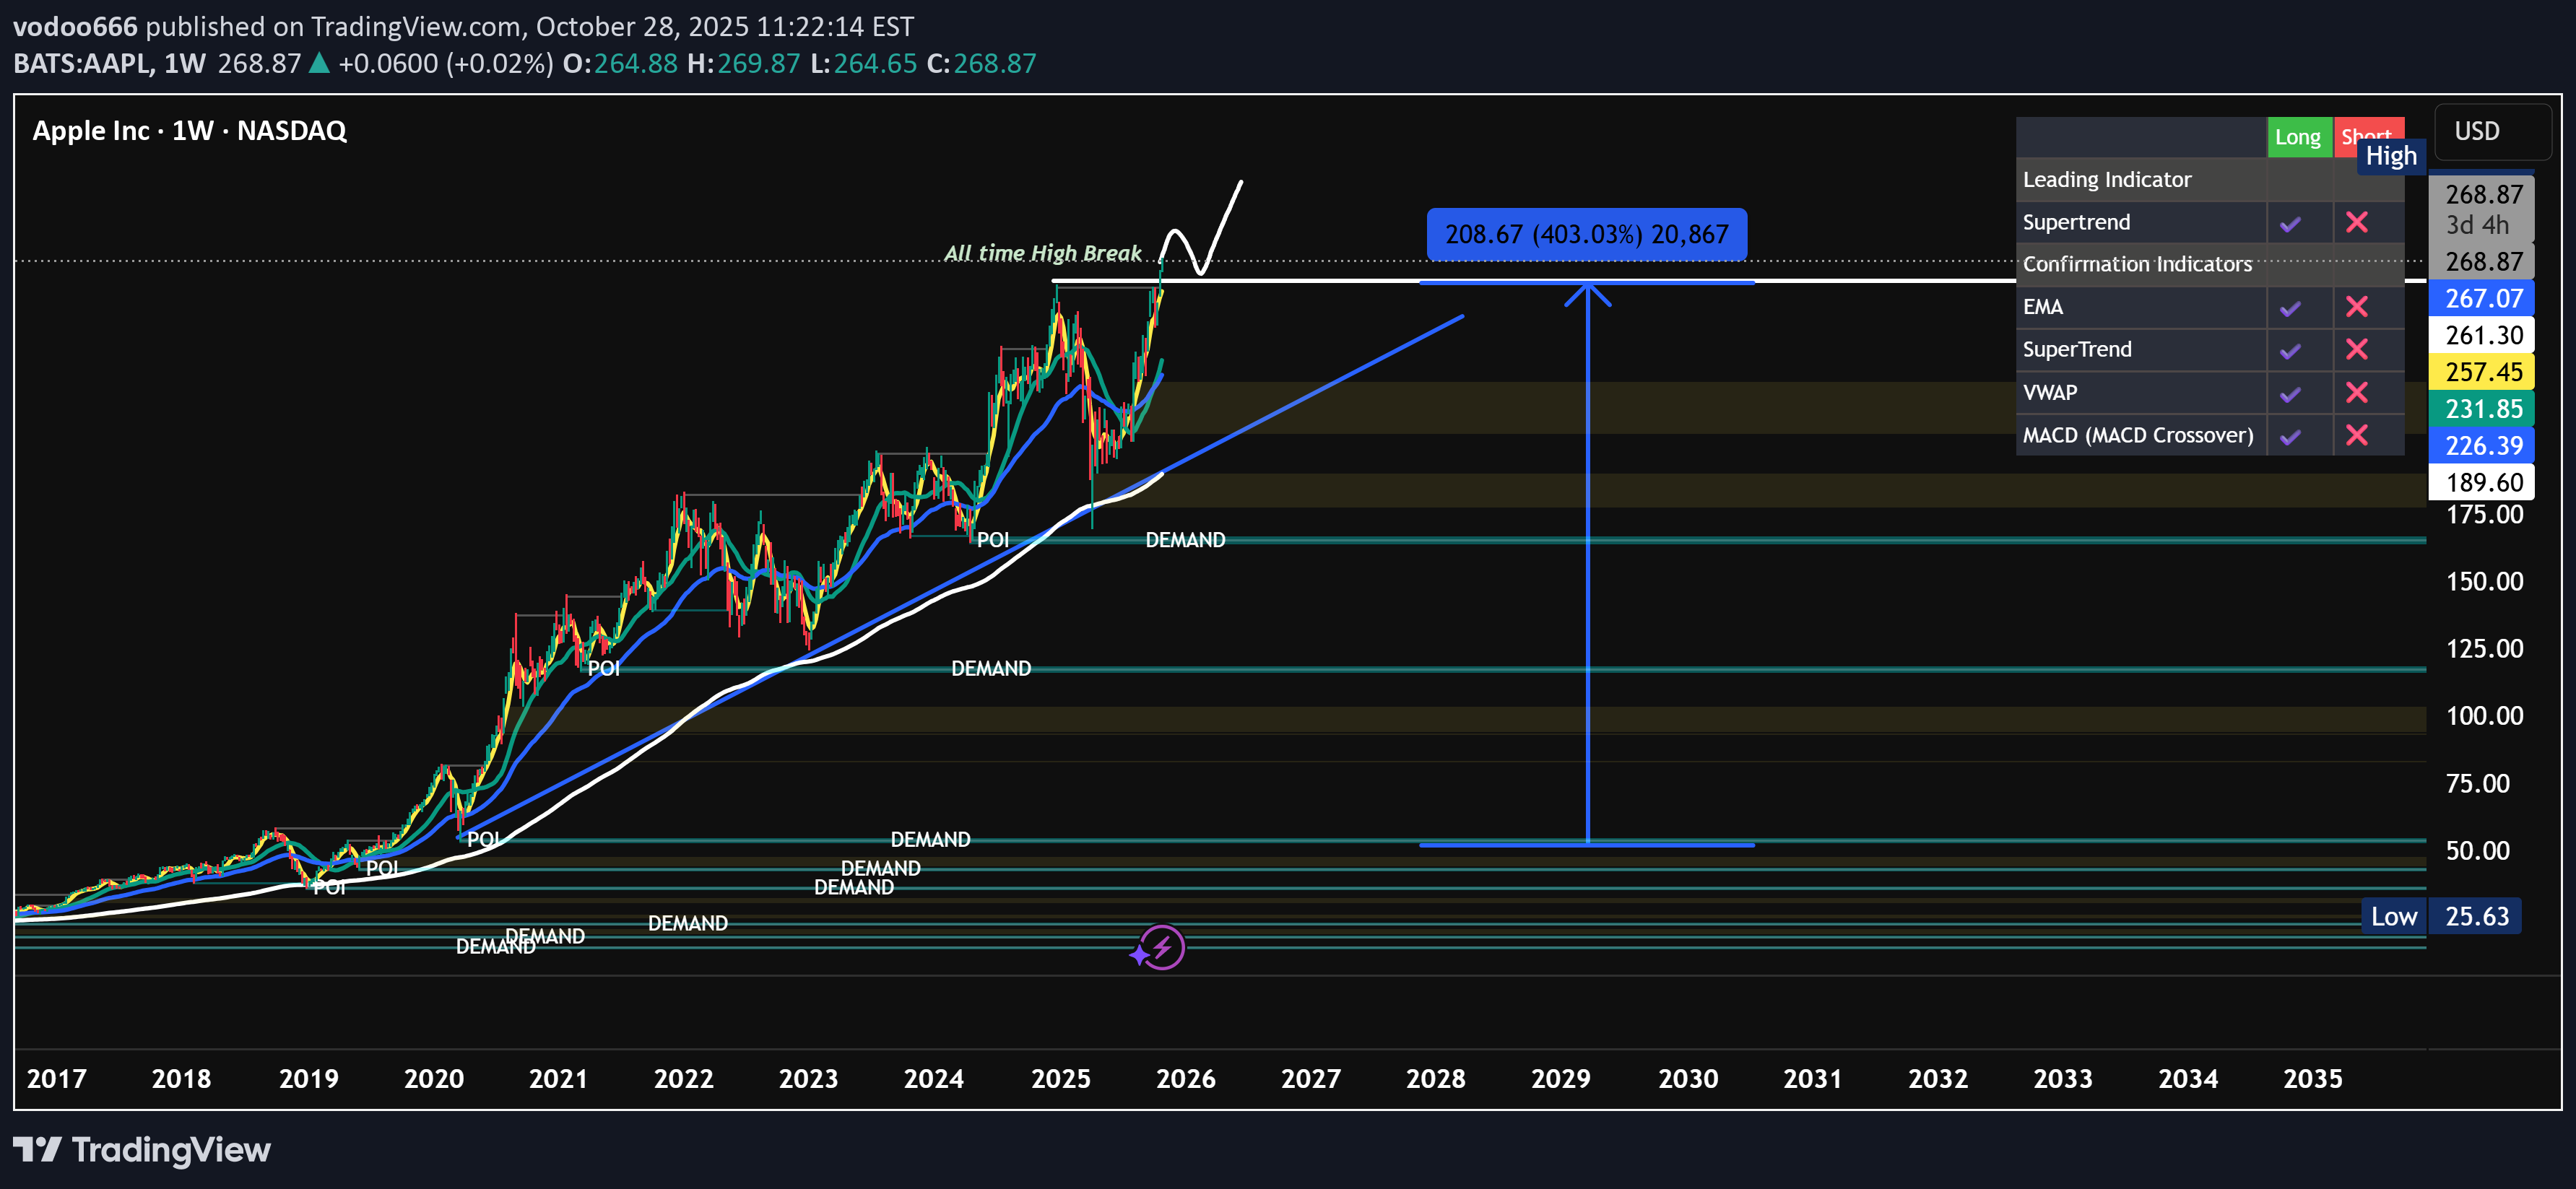
Apple continues to display one of the strongest technical structures among large-cap equities. The price action has respected multi-year demand zones and continues to advance in a controlled parabolic channel, signaling strong institutional order flow and long-term accumulation behavior. 1. Multi-Year Demand Structure Each pullback into a demand zone since 2019 has produced a strong bullish reaction, confirming active institutional defense at key points of interest (POIs). The structure showcases consistent higher highs and higher lows, a textbook uptrend aligned with long-term exponential moving averages and anchored VWAP support. The most recent reaction off the weekly demand near $130 - $135 marks another strong reaccumulation phase. This region acted as a liquidity pocket where large orders were likely absorbed before initiating the next expansion wave. 2. All-Time High Break and Price Discovery Price has now decisively broken above the all-time high, entering a fresh price discovery phase. Such breakouts often attract momentum buyers and algorithmic inflows, but historically, Apple tends to consolidate briefly above new highs before continuing its trend. The current projection suggests a measured move toward $208 - $210, which represents approximately +40% from the breakout level. This target is derived from the vertical measured range of the prior accumulation base and Fibonacci extension alignment. 3. Indicator Confluence Key indicators are showing strong trend confirmation: EMA Cluster: All major EMAs are stacked bullishly and acting as dynamic support. VWAP: Anchored VWAP from the previous high sits below price, confirming that institutional cost basis remains positive. SuperTrend: Flipped bullish on the weekly timeframe, signaling trend continuation. MACD: Crossed bullish above the zero line, aligning with the macro bullish momentum shift. Together, these indicators confirm that price structure is healthy, with momentum and liquidity aligned for continuation rather than exhaustion. 4. Smart Money and Institutional View Apple’s current behavior fits the smart money model of accumulation → manipulation → expansion. The manipulation phase occurred during the deep retracement in 2022–2023, where retail sentiment turned bearish while institutions accumulated within the demand blocks. The ongoing breakout represents the expansion phase where smart money distributes into higher liquidity as price advances. 5. Long-Term Outlook If Apple continues to respect the ascending demand trendline and sustains above the all-time high zone, the next major liquidity cluster lies near $208 – $210. Beyond that, a long-term projection suggests that a full cycle expansion could carry price toward the $260 – $270 region over the next few years, especially if macro conditions remain favorable for large-cap tech. Key Levels Current Price: 147.27 Support / Demand Zones: 135.00 – 140.00 and 120.00 – 125.00 Short-term Target: 208 – 210 Long-term Projection: 260 – 270 Invalidation: Sustained close below 130.00 Summary Apple has officially entered a new phase of price discovery following its all-time high breakout. The multi-year demand structure, strong institutional flow, and technical indicator confluence all point to sustained bullish momentum. The first major target zone remains $208 - $210, while the long-term projection sits near $260+, supported by macro bullish sentiment in the Nasdaq and strong fundamental resilience. A brief retest of the breakout zone could occur, but dips into the 135–140 area would likely be absorbed aggressively by institutional buyers, maintaining the long-term uptrend.
لایت کوین در آستانه انفجار: ورود پول هوشمند به کمینگاه نقدینگی!
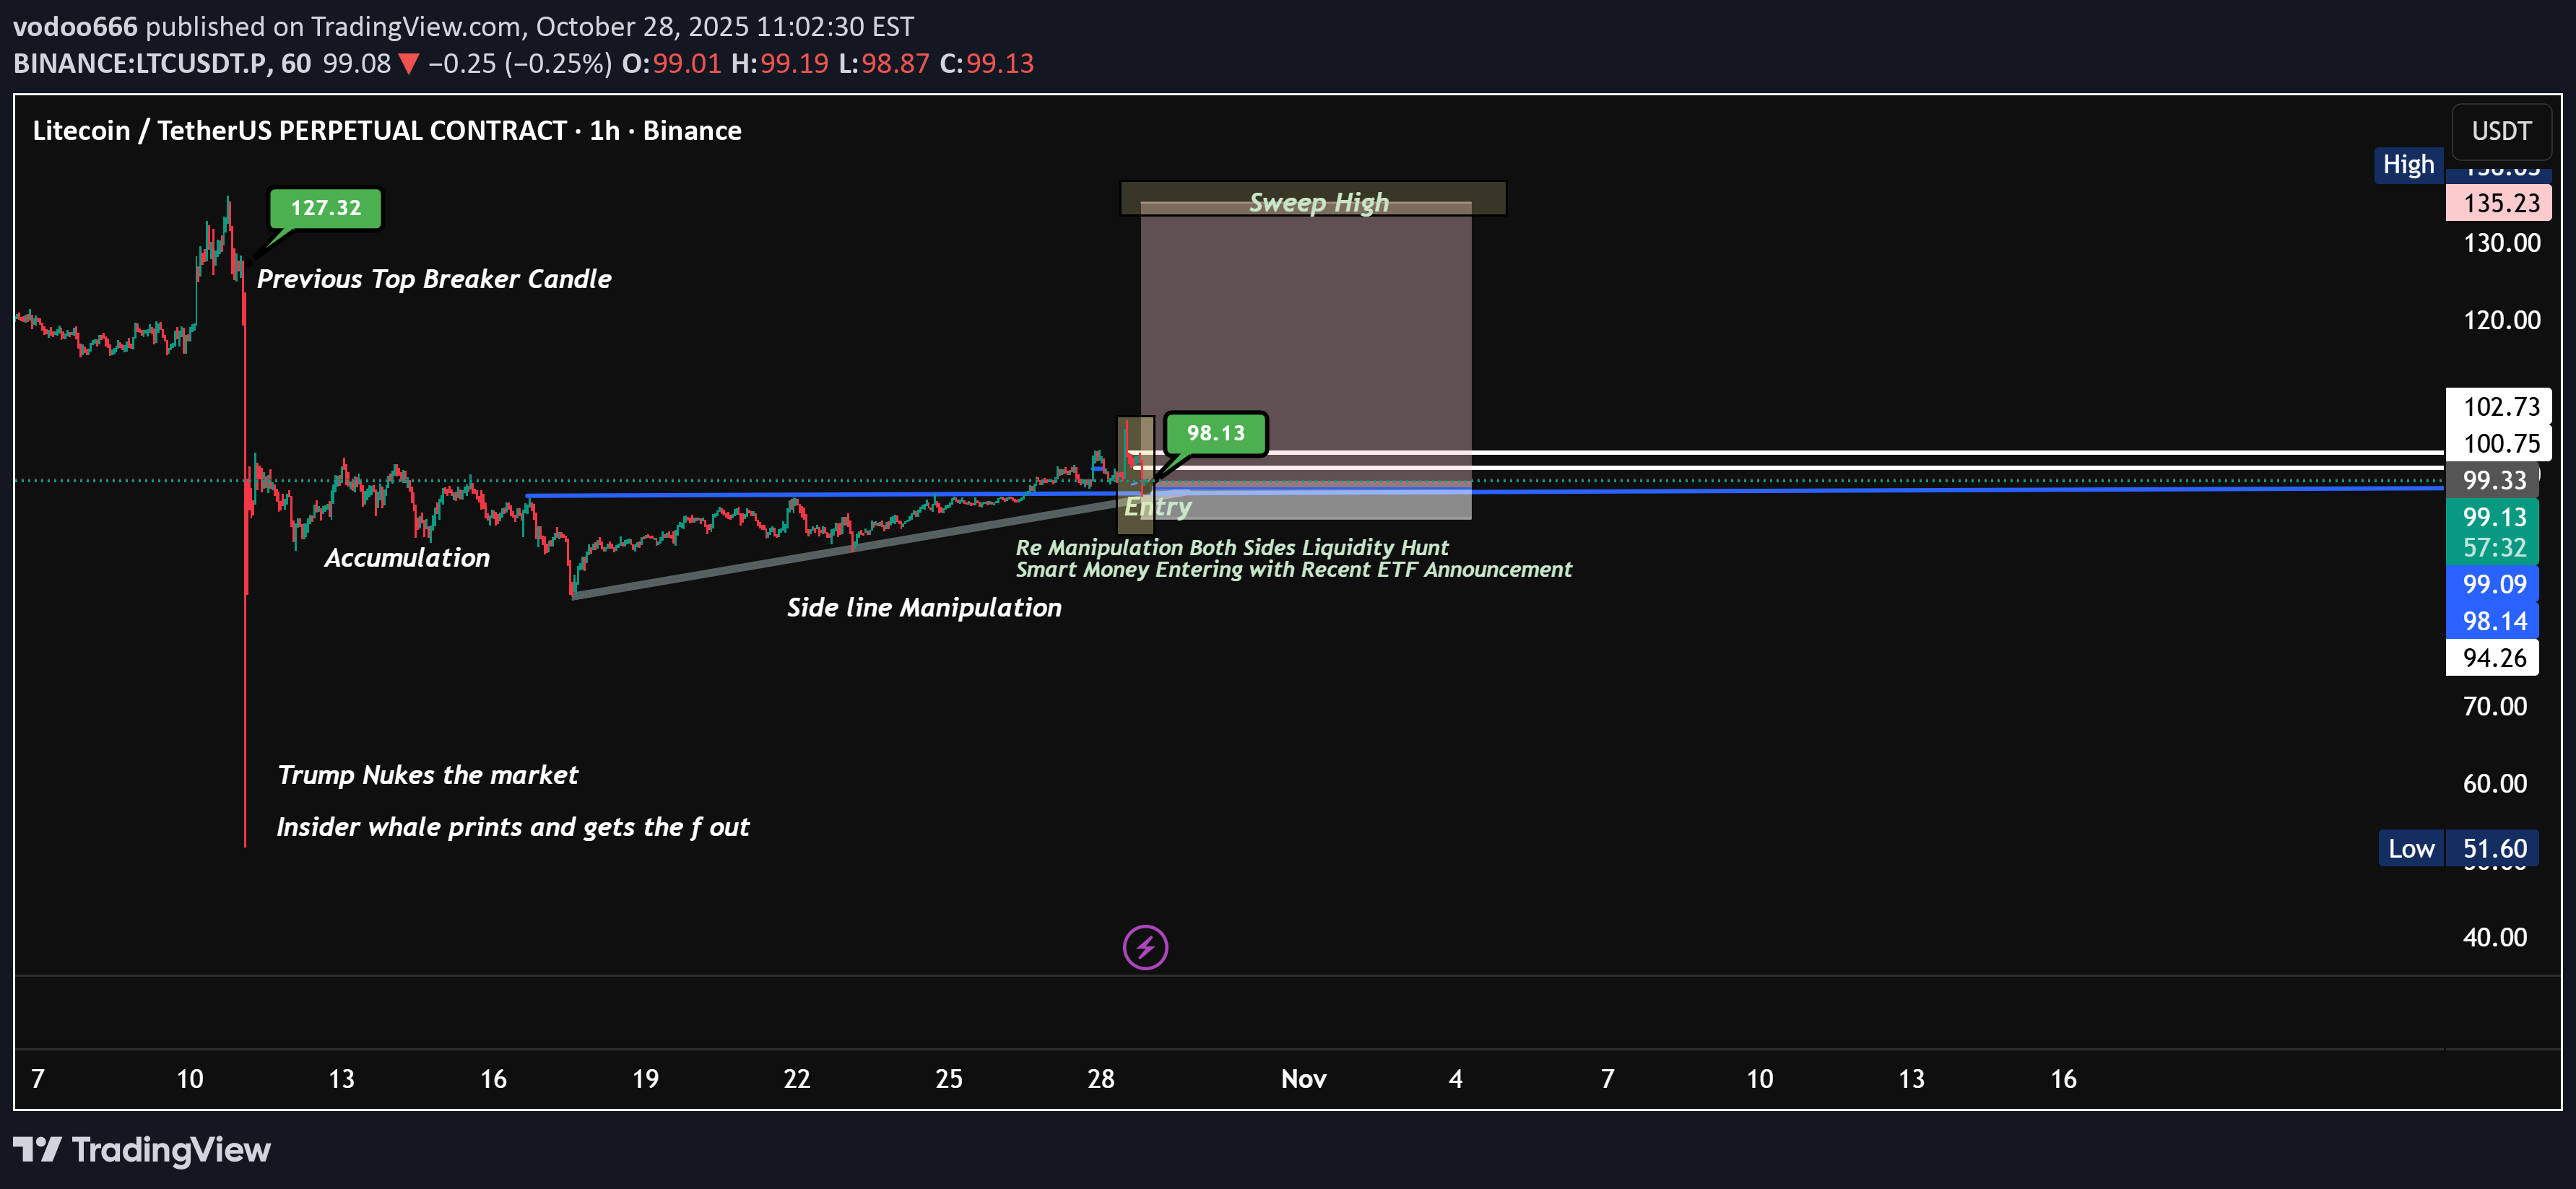
Litecoin has entered a decisive re-accumulation phase after a prolonged period of liquidity manipulation and structural compression. The market structure clearly reflects controlled accumulation by larger entities preparing for a directional expansion. 1. Accumulation & Side-line Manipulation Following the sharp capitulation event labeled “Trump nukes the market”, price action transitioned into an extended accumulation range. This was a classic liquidity engineering phase, where market makers ran both sides of the book to trap breakout traders and absorb liquidity at discounted prices. The extended sideways movement was not weakness, but preparation — smart money quietly positioning while the broader market focused on Bitcoin and ETF headlines. 2. Re-Manipulation and Entry Confirmation The re-manipulation phase has been completed, with price now consolidating above the structural support near $98.00. I have personally entered a long position at $98.10, aligning with the Smart Money entry zone ($98.00 - $99.00). The area represents efficient price delivery where institutional accumulation meets retail confusion — a classic setup before expansion. The recent ETF-driven sentiment acts as the perfect catalyst for volatility absorption before the impulsive move higher. Smart money often enters during such quiet, technically uncertain zones, not during euphoria. 3. Liquidity Objectives The immediate liquidity target is the untested breaker zone near $126 - $127, where a prior high remains unswept. My first take-profit zone (TP1) is at $135 - $140, aligning with the previous high liquidity cluster. If momentum replicates recent Zcash-style vertical behavior, Litecoin could deliver a legendary move toward the $580 - $600 range — its historical distribution top from the previous cycle. 4. Market Maker Structure The chart currently reflects the three classic stages of market maker behavior: Phase 1: Accumulation through false breakdowns Phase 2: Re-manipulation to absorb liquidity on both sides Phase 3: Expansion toward untouched liquidity pools Each stage has been structurally respected, confirming the smart money model in play. 5. Macro Confluence & Bitcoin Relationship Historically, Litecoin tends to top out before Bitcoin, often signaling a macro market top or bear cycle onset within 3 to 5 months. This pattern has repeated across multiple cycles, making Litecoin’s strength a reliable early indicator of overheated market conditions. Hence, while the immediate bias remains bullish, I’ll be closely monitoring LTC’s relative strength as a potential macro warning for the broader crypto market. Key Levels Entry: 98.10 (Active Long) Entry Zone: 98.00 – 99.00 Short-term Target: 102.70 Primary Target (TP1): 135 – 140 Extended Target (Cycle High): 580 – 600 Invalidation: Below 94.00 Summary Litecoin is in the late stages of accumulation, showing signs of smart money re-entry amid a broader risk-on narrative. As long as price remains above 94.00, the path of least resistance remains upward. Any dips into the 98 region are likely liquidity grabs rather than genuine breakdowns. Buy Spots for a chill trip to 600 with a 6x. If momentum extends beyond $140 with strong volume expansion, we could be witnessing the start of one of the most aggressive pumps of this cycle.
شانس بزرگ بیت کوین: آیا موج صعودی جدید در راه است؟ (پیشبینی قیمت تا ۱۳۰ هزار دلار)
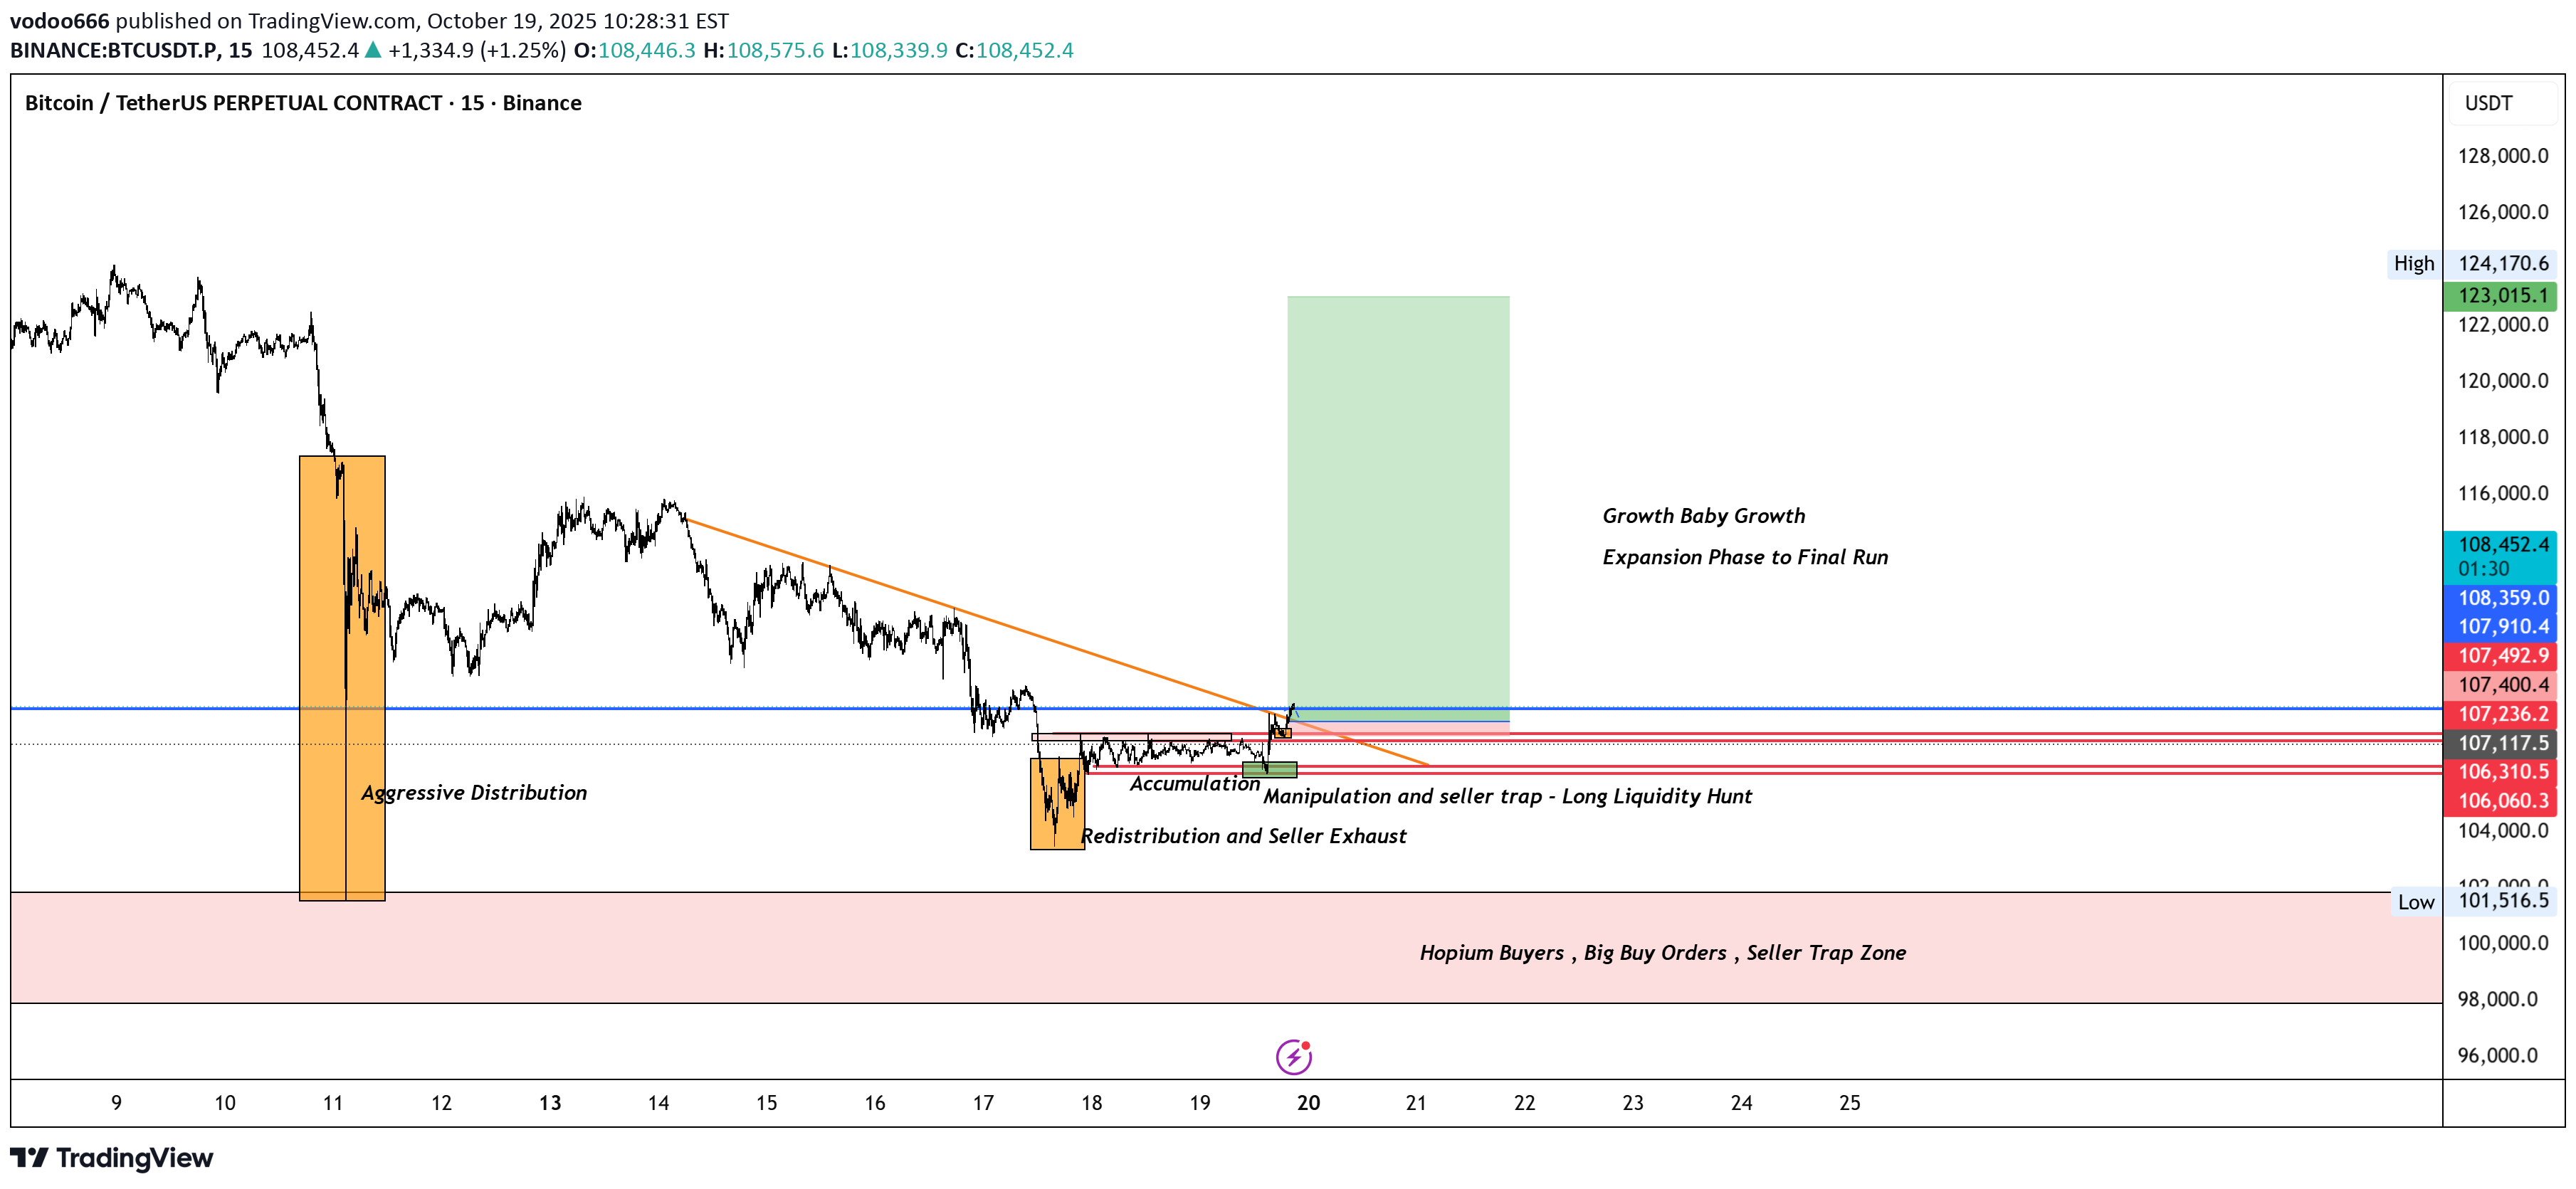
🧭 Bitcoin Long Setup – Expansion Phase Incoming After an aggressive selloff and redistribution phase, Bitcoin has built a clean accumulation base around 106k–107k, showing clear signs of seller exhaustion and liquidity hunts. The breakout above the descending trendline confirms a potential trend reversal and entry into the expansion phase. I’m entering long around 107k, with a stop near 105k and targets at 120k–130k, stretching up to 140k if momentum sustains. The structure aligns with Wyckoff accumulation and liquidity-trap patterns, backed by favorable October seasonality and improving macro sentiment. As long as BTC holds above the accumulation range, I expect continuation toward the green zone and possibly a new local high. A breakdown below 105k would invalidate this setup.
Disclaimer
Any content and materials included in Sahmeto's website and official communication channels are a compilation of personal opinions and analyses and are not binding. They do not constitute any recommendation for buying, selling, entering or exiting the stock market and cryptocurrency market. Also, all news and analyses included in the website and channels are merely republished information from official and unofficial domestic and foreign sources, and it is obvious that users of the said content are responsible for following up and ensuring the authenticity and accuracy of the materials. Therefore, while disclaiming responsibility, it is declared that the responsibility for any decision-making, action, and potential profit and loss in the capital market and cryptocurrency market lies with the trader.