
vikinsa
@t_vikinsa

What symbols does the trader recommend buying?
Purchase History
پیام های تریدر
Filter
vikinsa
سقوط قریبالوقوع اپل (AAPL)؟ نشانههای اصلاح قیمتی این سهام بزرگ چیست؟
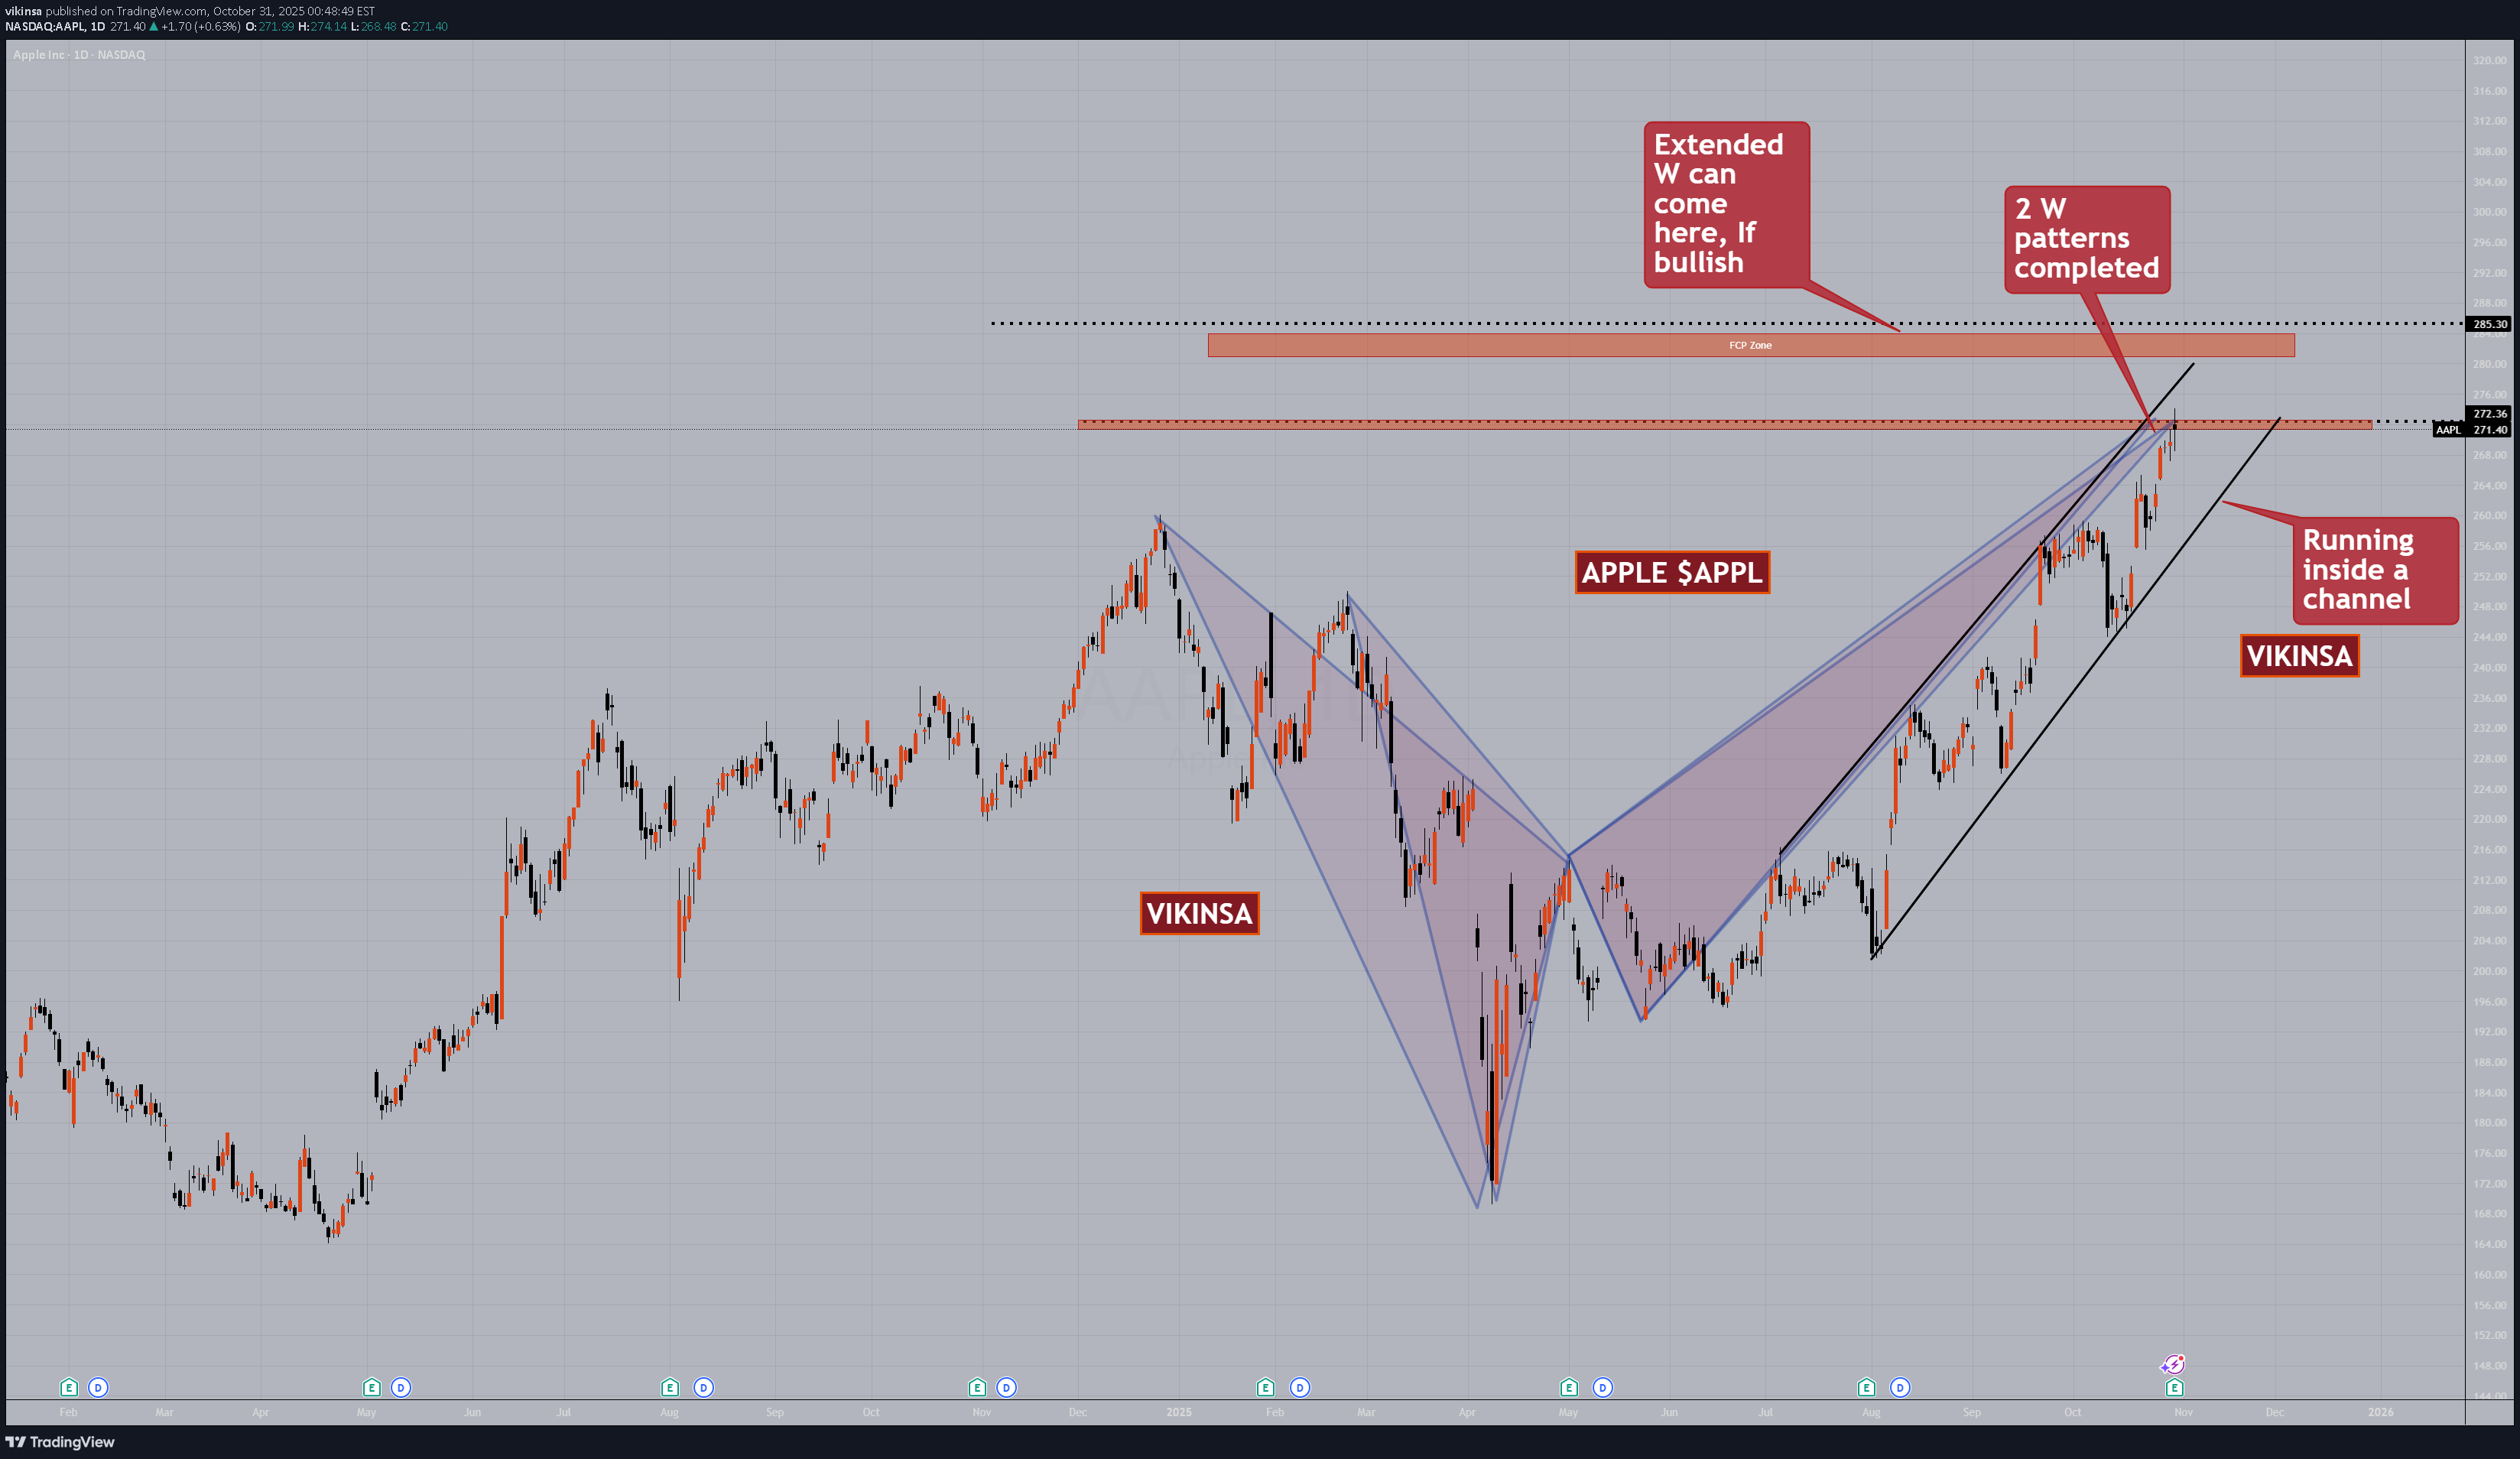
Apple APPL had a great run so far in the past few weeks. It has also been running inside a channel which has pushing the price upwards. However, now it has just completed an extended W pattern. In fact 2 of them got completed exactly at the same level. The current price level is something that needs to eb watched very closely. When W patterns complete, markets tend to have a correction. Market is still bullish and is still inside the channel so even if the correction comes, we will have to be careful with the shorts. If the market stay bullish from this point above at least on daily/weekly basis then we have an upper FCP zone where it can reach possibly take a correction from there. In all cases, we must remember to wait for confirmations and obviously manage the risk.
vikinsa
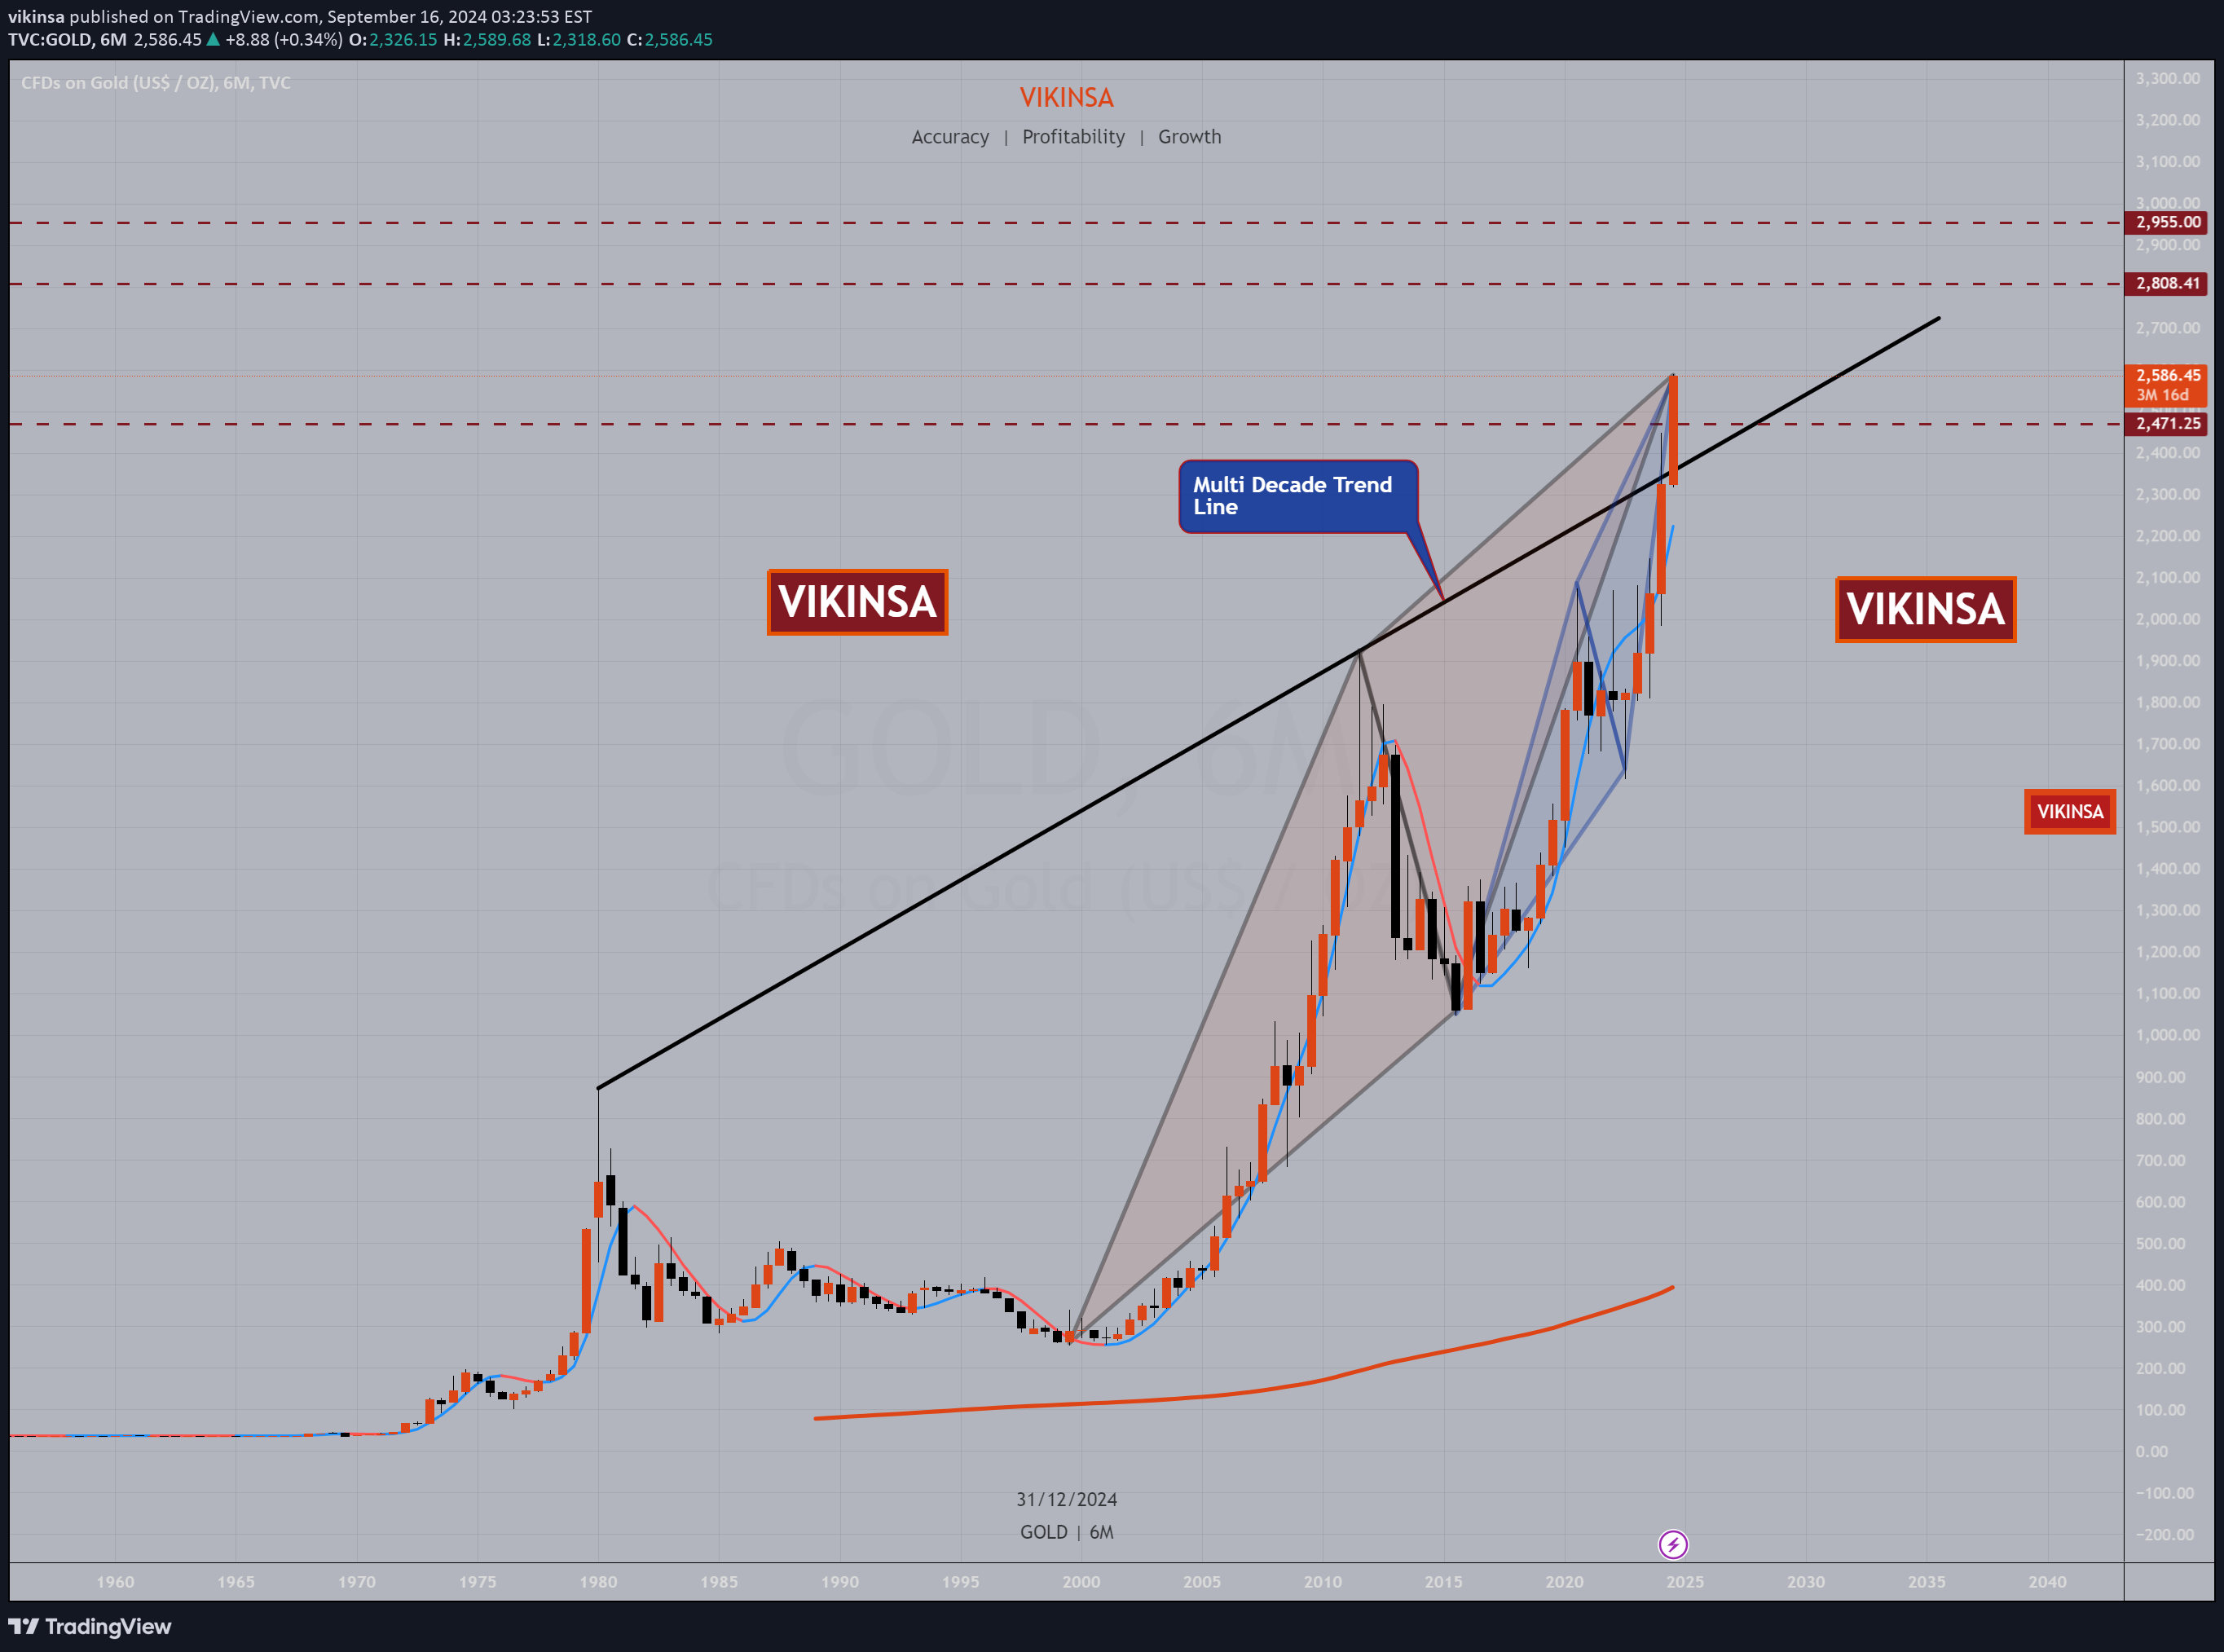
What's Happening With Gold? Gold had a huge breakout after several weeks and moved sharply towards 2600. (Please keep in mind that I am referring to a particular CFD/spot feed for XAUUSD.) Although the momentum remains bullish and the bearish divergence (as I posted the last time) remains intact, there is a pattern that we should now be aware of. We now have 2 ABCD patterns nearly completed on the 6-month time frame chart. There is also a multi-decade trend line that has been violated but has not been retested so far. Technical analysis is suggesting again that whilst it remains bullish, caution must be exercised now. Not an advice as usual. Please support this analysis by liking, commenting, and sharing with friends, colleagues, traders, and trading communities. Thanks👍🙂
vikinsa
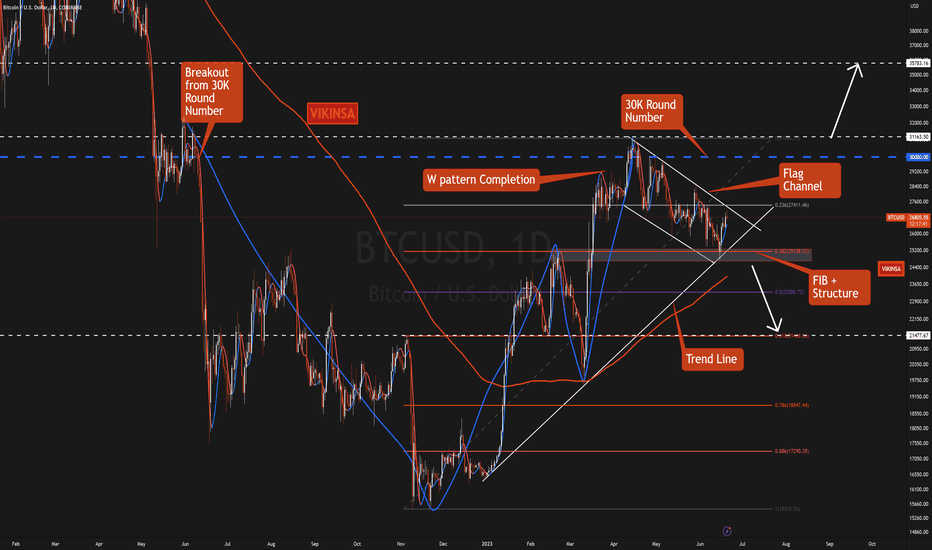
Traders and investors, Bitcoin has been causing a lot of confusion among traders and investors. So let's break it down and understand. 1. in June 2022 (1 year ago) Bitcoin broke out of the 30000 price tag but never retested that. 2. This year it formed a W pattern to reach that level and retest it. 3. The price reached 30000 this year and completed that W pattern. When a W pattern "completes" the market goes down. So Bitcoin started to fall from there. 4. It reached its target level of Fibonacci 38.2 which was also a good confluence of Structure and Trend Line 5. This formed a flag pattern. 6. Currently the price is supported by the trend line and moving slowly inside the flag 7. This has been going on for quite some time now. So a breakout is imminent. 8. If it breaks out to the downside it can fall further to foran M pattern around 21477 9. If it breaks above the previous high of 31163 and confirms then it will become bullish and can target a bigger W pattern completing around 36783 and a better W pattern at 41000. 10. Caution: Until the breaks and confirms the previous high of 31163 there will still be a chance of it falling down to complete the M pattern as pointed out in point 8 above. Please support this analysis by liking and sharing. 👍🙂 Rules: 1. Never trade too much 2. Never trade without a confirmation 3. Never rely on signals, do your own analysis and research too ✅ If you found this idea useful, hit the like button, subscribe and share it in other trading forums. ✅ Follow me for future ideas, trade setups, and updates on this analysis ✅ Don't hesitate to share your ideas, comments, opinions, and questions. Take care and trade well -Vik ____________________________________________________ 📌 DISCLAIMER The content of this analysis is subject to change at any time without notice and is provided for the sole purpose of education only. Not financial advice or signal. Please make your own independent investment decisions. ____________________________________________________
vikinsa
Traders and Investors, Gold has been going sideways in past couple of weeks after a making a great push the upside. It is now is a crucial level where it now needs to decide how it is going to finish the year. There are few very important scenarios based on Candle stick patterns, Fibonacci patterns and trend assessment. Bullish scenario: 1. It can end the yearly candle as slightly bullish candle and for that it can go to 1833-1850 or 1906 level too. 2. Yearly candlestick pattern supports that Bearish Scenario: 1. The year end with a bearish dozi candle, basically not much movement in the days to come 2. The year ends with a large bearish candle. A possible M pattern,, extended M pattern scenarios are available. In this Gold ( XAUUSD ) analysis update we will look at what happened and what sort of opportunities can be there in coming days and possibly weeks. Please support this analysis by liking and sharing. 👍🙂 Rules: 1. Never trade too much 2. Never trade without a confirmation 3. Never rely on signals, do your own analysis and research too ✅ If you found this idea useful, hit the like button, subscribe and share it in other trading forums. ✅ Follow me for future ideas, trade set ups and the updates of this analysis ✅ Don't hesitate to share your ideas, comments, opinions and questions. Take care and trade well -Vik ____________________________________________________ 📌 DISCLAIMER The content on this analysis is subject to change at any time without notice, and is provided for the sole purpose of education only. Not a financial advice or signal. Please make your own independent investment decisions. ____________________________________________________
vikinsa
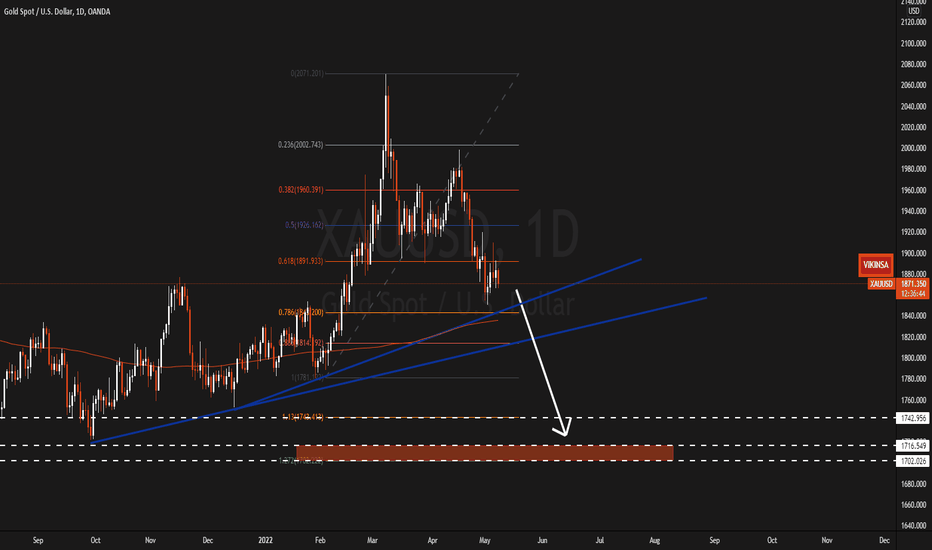
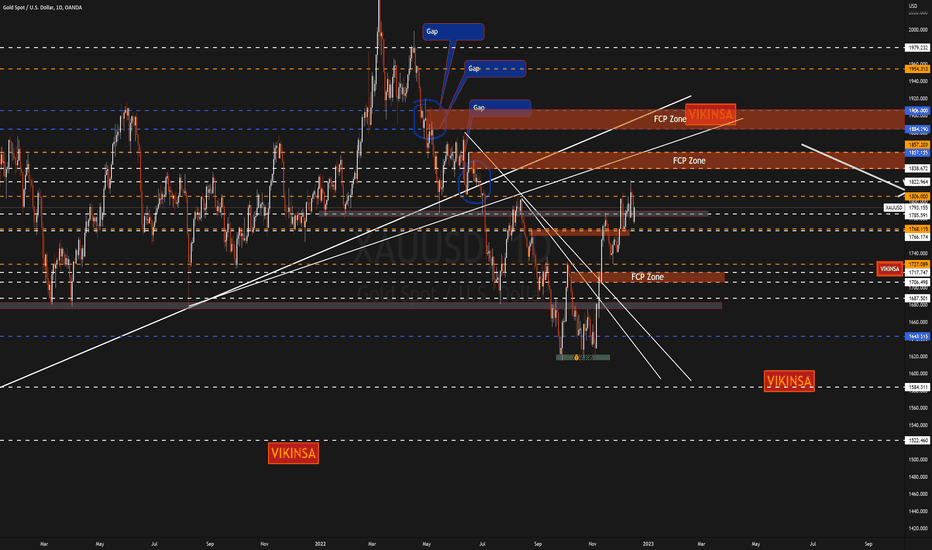
Traders,Gold followed our analysis and fell from 1988 supply zone after completing a W pattern with good Fibonacci confluence. Now after few recent bounces up it is reaching a critical area which can define its future direction for a long term structure. We have:1. Possible completion of M pattern (FCP zone)2. Trend Lines to support3. 200 SMABut if this area is violated because Gold already had few bounces in recent days consuming majority of Buy orders then it can fall much further down to 1700s. That can be a very big opportunity for shorting gold.Presenting Gold Analysis & Forecast Updates - XAUUSD Technical Analysis For May 09, 2022Rules:1. Never trade too much2. Never trade without a confirmation3. Never rely on signals, do your own analysis and research too✅ If you found this idea useful, hit the like button, subscribe and share it in other trading forums.✅ Follow me for future ideas, trade set ups and the updates of this analysis✅ Don't hesitate to share your ideas, comments, opinions and questions.Take care and trade well-Vik____________________________________________________📌 DISCLAIMERThe content on this analysis is subject to change at any time without notice, and is provided for the sole purpose of education only.Not a financial advice or signal. Please make your own independent investment decisions.____________________________________________________
vikinsa
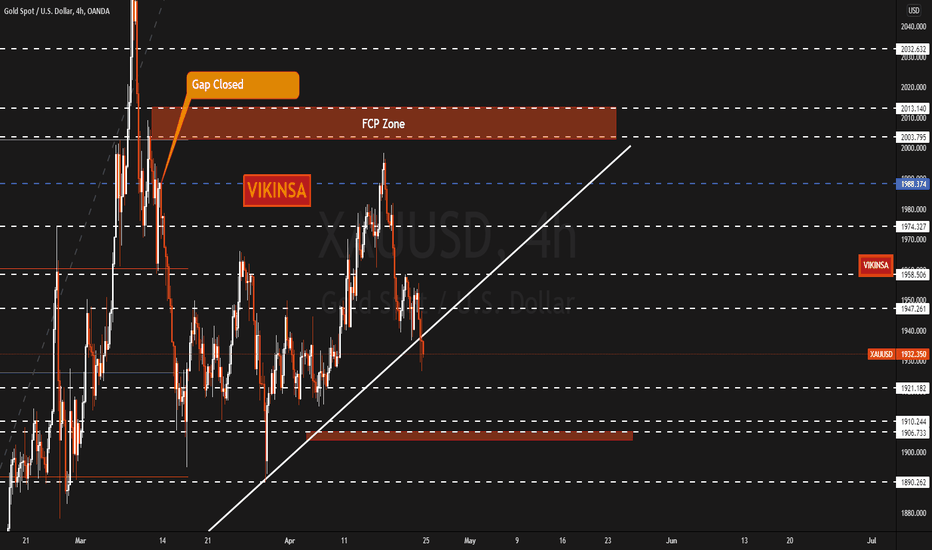
Traders, Gold fell from a level where a left over gap was. It did not even complete a W pattern and this possibility was discussed in the previous week's analysis.No Gold has broken below an important trend line which make it bearish so the bias is bearish but as always we look into and prepare ourselves for all the scenarios. In this weekly analysis for Gold we explore bearish targets and bullish scenarios. Presenting XAUUSD technical analysis update and forecasts.Trade what you see and ignore any hypes. Stay objective.Rules:1. Never trade too much2. Never trade without a confirmation3. Never rely on signals, do your own analysis and research too✅ If you found this idea useful, hit the like button, subscribe and share it in other trading forums.✅ Follow me for future ideas, trade set ups and the updates of this analysis✅ Don't hesitate to share your ideas, comments, opinions and questions.Take care and trade well-Vik____________________________________________________📌 DISCLAIMERThe content on this analysis is subject to change at any time without notice, and is provided for the sole purpose of education only.Not a financial advice or signal. Please make your own independent investment decisions.____________________________________________________
vikinsa
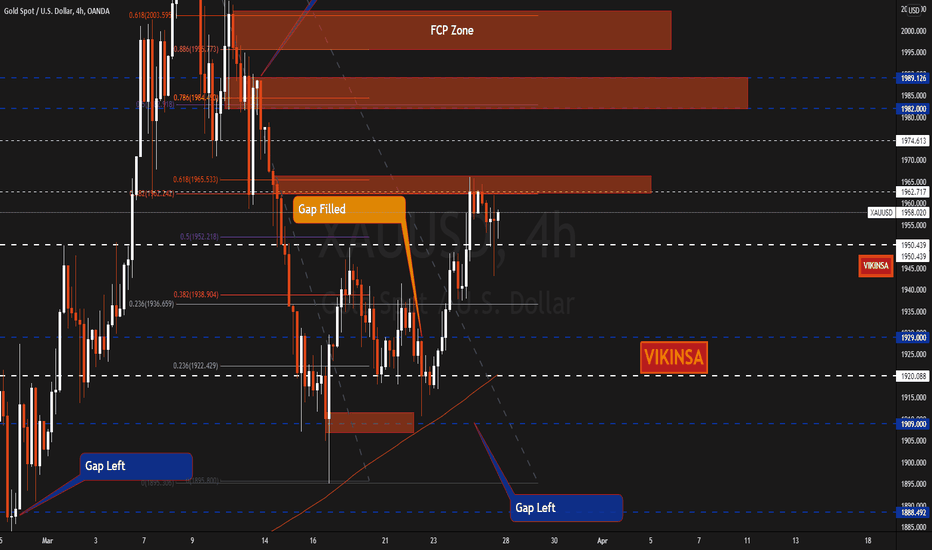
Traders, Gold moved higher as expected from the FCP zone. We were expecting it to go little more down before moving higher but nonetheless it was inside the FCP zone which pushed it higher. In has reached an intermediate target FCP zone and performed a retest of the middle point of the W pattern. This still has potential to go higher to 1966, 1974, 1982-1989, 2000, 2024.At 1974 we have potential Head and Shoulders pattern which may or may not play out so do not rely too much on it unless its neck line around 1888 is broken. Remember that we have financial year end, quarter end and month end. Besides we still have war situation going on. So expect a lot of volatility and fake breakouts. Trade what you see and manage the risk.Trade what you see and ignore any hypes. Stay objective.Rules:1. Never trade too much2. Never trade without a confirmation3. Never rely on signals, do your own analysis and research too✅ If you found this idea useful, hit the like button, subscribe and share it in other trading forums.✅ Follow me for future ideas, trade set ups and the updates of this analysis✅ Don't hesitate to share your ideas, comments, opinions and questions.Take care and trade well-Vik____________________________________________________📌 DISCLAIMERThe content on this analysis is subject to change at any time without notice, and is provided for the sole purpose of education only.Not a financial advice or signal. Please make your own independent investment decisions.____________________________________________________Chart used:
vikinsa
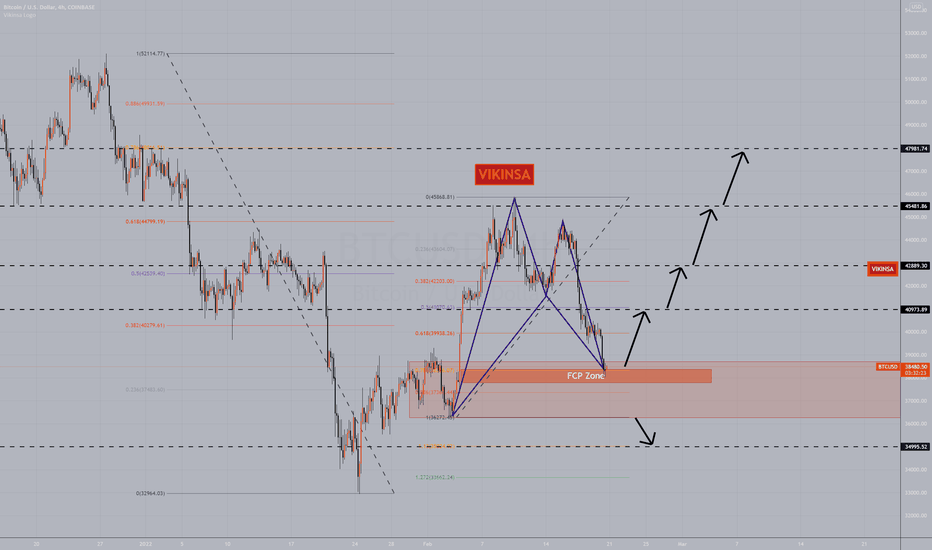
Traders, Bitcoin has just completed an M pattern in a consolidation area which can push the price upwards. This M pattern is also part of a bigger W pattern which in turn can push the price up. These are the levels and directions (arrows) that we can look at.Trade what you see and ignore any hypes. Stay objective.Rules:1. Never trade too much2. Never trade without a confirmation3. Never rely on signals, do your own analysis and research too✅ If you found this idea useful, hit the like button, subscribe and share it in other trading forums.✅ Follow me for future ideas, trade set ups and the updates of this analysis✅ Don't hesitate to share your ideas, comments, opinions and questions.Take care and trade well-Vik____________________________________________________📌 DISCLAIMERThe content on this analysis is subject to change at any time without notice, and is provided for the sole purpose of education only.Not a financial advice or signal. Please make your own independent investment decisions.____________________________________________________
vikinsa
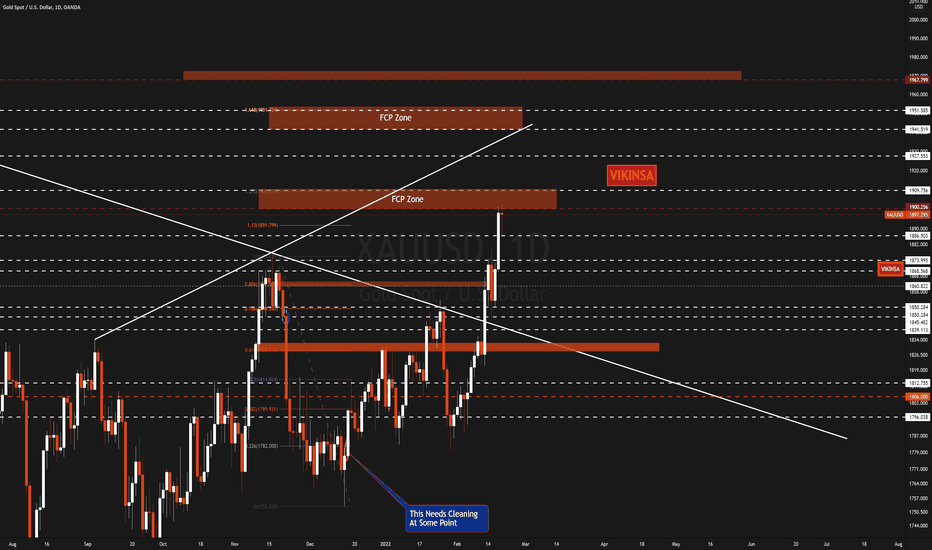
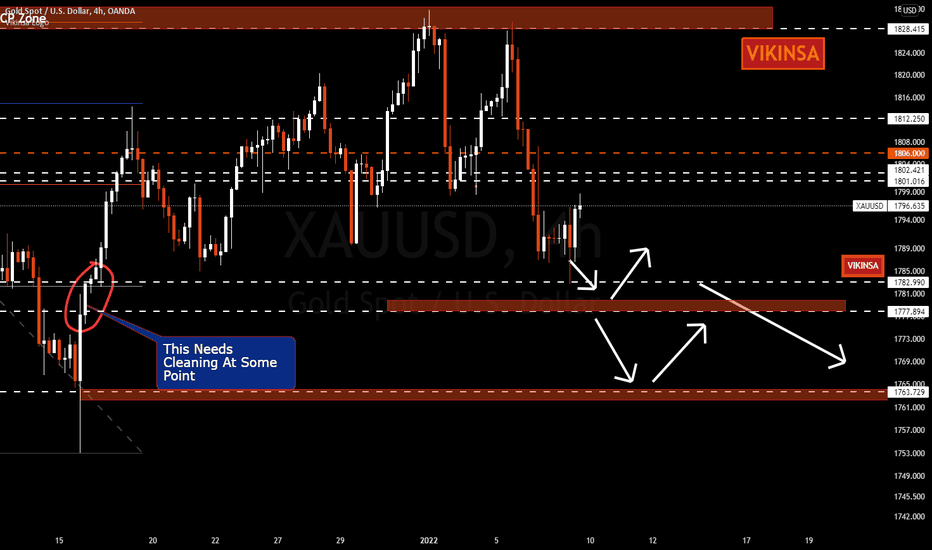
Traders, Gold had a great breakout. After hitting few of our bullish targets, it is now sitting at an FCP zone and 1900 round number which can create a short opportunity. In fact nearly all upwards moves on gold at the moment can bring us good short opportunities too. The horizontal lines and zones are potential targets areas and support/resistance. So make sure you manage your positions around them. A deeper analysis is available on the channel. Although gold can fall any time for a correction next week, 1910 still looks like a good level to watch out for a confirmation on a short position. There are several liquidity areas available on gold which market can hit with a swift move so a fall to lower levels can not be ruled out. Trade what you see and ignore any hypes. Stay objective.Rules:1. Never trade too much2. Never trade without a confirmation3. Never rely on signals, do your own analysis and research too✅ If you found this idea useful, hit the like button, subscribe and share it in other trading forums.✅ Follow me for future ideas, trade set ups and the updates of this analysis✅ Don't hesitate to share your ideas, comments, opinions and questions.Take care and trade well-Vik____________________________________________________📌 DISCLAIMERThe content on this analysis is subject to change at any time without notice, and is provided for the sole purpose of education only.Not a financial advice or signal. Please make your own independent investment decisions.____________________________________________________
vikinsa
Traders, Gold had a mix week. We hit few targets early on in the week and ended with a profitable trade but lost a trade too. The price action was slightly confusing. So in this Gold (XAUUSD) Further Update On Analysis And Trading Plan lets first see what we were expecting and what happened. Then we will look into possible trading plan for the next week.Rules:1. Never trade too much2. Never trade without a confirmation3. Never rely on signals, do your own analysis and research too✅ If you found this idea useful, hit the like button, subscribe and share it in other trading forums.✅ Follow me for future ideas, trade set ups and the updates of this analysis✅ Don't hesitate to share your ideas, comments, opinions and questions.Take care and trade well-Vik____________________________________________________📌 DISCLAIMERThe content on this analysis is subject to change at any time without notice, and is provided for the sole purpose of education only.Not a financial advice or signal. Please make your own independent investment decisions.____________________________________________________
Disclaimer
Any content and materials included in Sahmeto's website and official communication channels are a compilation of personal opinions and analyses and are not binding. They do not constitute any recommendation for buying, selling, entering or exiting the stock market and cryptocurrency market. Also, all news and analyses included in the website and channels are merely republished information from official and unofficial domestic and foreign sources, and it is obvious that users of the said content are responsible for following up and ensuring the authenticity and accuracy of the materials. Therefore, while disclaiming responsibility, it is declared that the responsibility for any decision-making, action, and potential profit and loss in the capital market and cryptocurrency market lies with the trader.