
trendbooster
@t_trendbooster

What symbols does the trader recommend buying?
Purchase History
پیام های تریدر
Filter
trendbooster
WIF 4H. Make or Break Zone

WIFUSDT The asset is still moving within a defined range and is now brushing against the lower boundary of its structure. This area has historically triggered buyer interest — and if that repeats, we could be looking at a recovery toward $0.97+ in the short term.However, failure to defend this support could send price cascading down to the $0.58–$0.60 zone.Given the ongoing uncertainty in global markets, especially due to rising geopolitical tension, any long positions should be executed with tight risk management and a hard stop-loss.Entry range (EP):• Market• $0.8120• $0.7790Take-Profit targets (TP):• $0.8880• $0.9425• $0.9765I’m managing risk carefully and limiting exposure per trade to no more than 2% of my portfolio. This is my personal trading log and not financial advice — always DYOR and trade responsibly.Let the market decide — I'm prepared either way.Stay sharp. Stay safe. 🧠📊
trendbooster
AR 1H. $5.90 Is the Last Line of Defense. 06/15/25

ARUSDT If we fail to hold the $5.90 level, this asset could crash hard — potentially entering a deeper downtrend.DYOR.
trendbooster
BTC 4H. $104K or Bust — Critical BTC Moment! 06/13/25
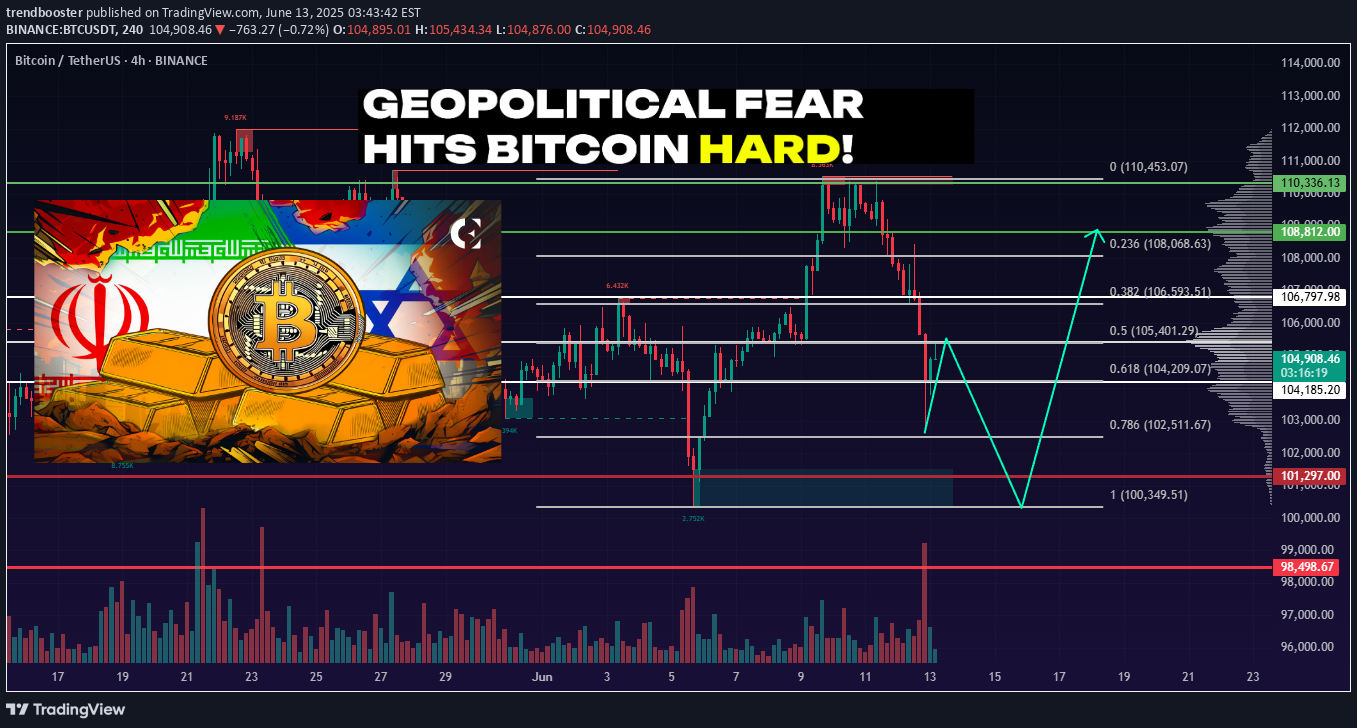
BTCUSDT remains in a sideways range between $110,336 – $101,297. The main trading volume is concentrated around $103,907.Recently, the price reached the upper boundary of the range at $110,336 and sharply declined from there — confirming the strength of resistance. The drop was intensified by negative geopolitical news (Israel–Iran tensions).As a result, BTC retraced into the $104,185 – $101,297 demand zone — a potential area where buyers might step in again.Personally, I expect one more dip into the $104,185 – $101,297 range to test the strength of buyers.⚠️ If negative news continues, a breakdown below $100,349 and a new local low is possible.DYOR.
trendbooster
ATOM. Massive Liquidity Grab Incoming. 06/12/25

ATOMUSDT At the moment, the price is in an accumulation phase.The buyer interest zone lies between $3.806 – $3.601, which also serves as a strong support area. We may see solid spot/futures entries here and the potential start of a new upward move.What we’re really waiting for is liquidity to be swept in this zone — where tons of stop-losses have clustered. Such a shakeout would be a perfect setup for a bullish impulse.Spot/futures accumulation is valid within this zone.DYOR.
trendbooster
BNB 1D Ready to Explode? This Chart Says YES. 06/12/25
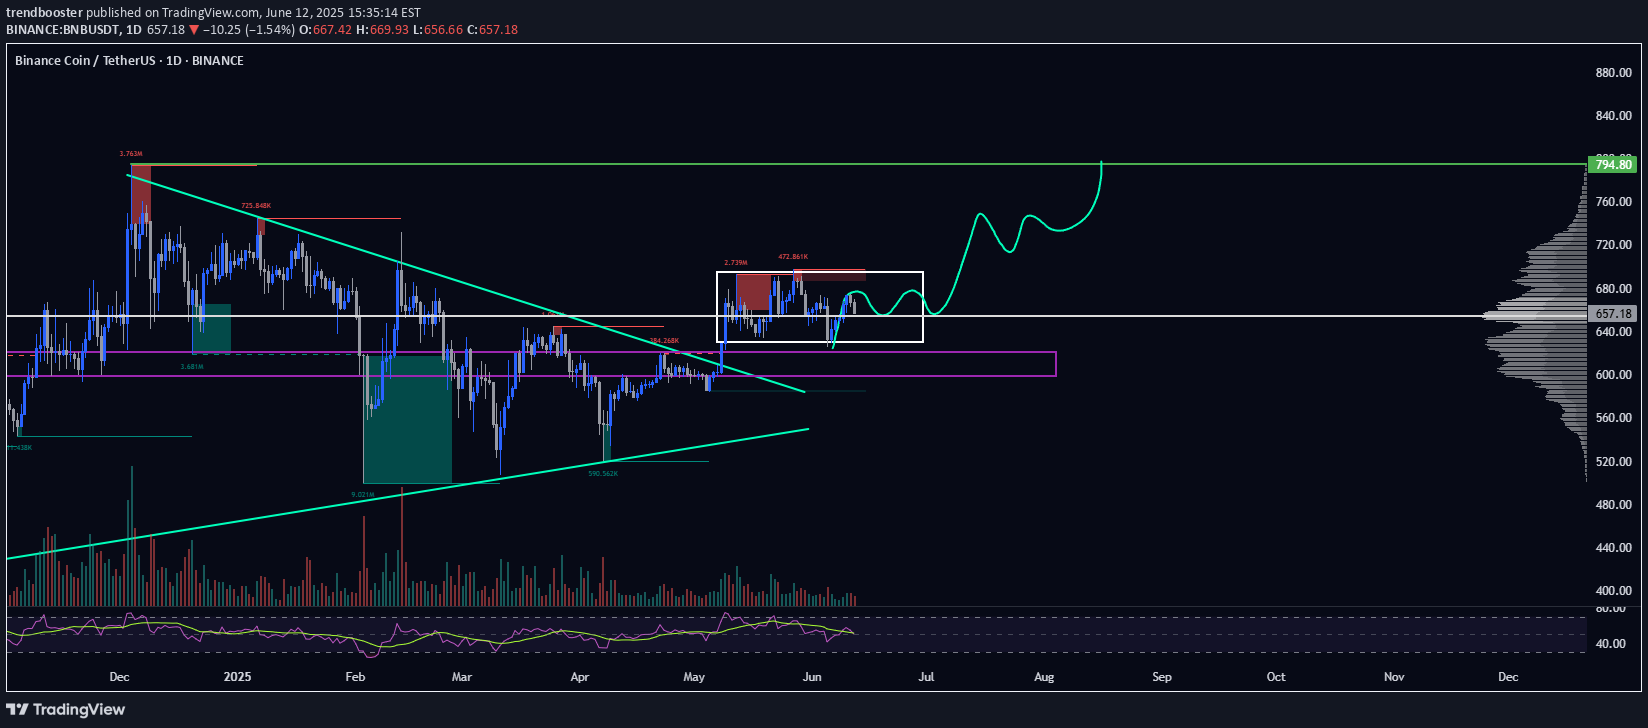
BNBUSDT is forming a tight consolidation right below key resistance at $710, inside a triangle structure. Every dip into the $655–$625 support zone gets quickly bought up — showing strong buyer interest and accumulation.Price is compressing inside the triangle with higher lows, indicating bullish pressure. A breakout above $710 would likely trigger a strong move toward $770–$780, and potentially a new ATH > $800.As long as $625 holds — I'm bullish. I expect one more sweep of support before an explosive breakout.Spot/futures entries: $655–$625Targets: $710 → $780 → $820+Invalidation: Daily close below $625.
trendbooster
1INCH 1D. Showing Signs of Accumulation. 06/12/25
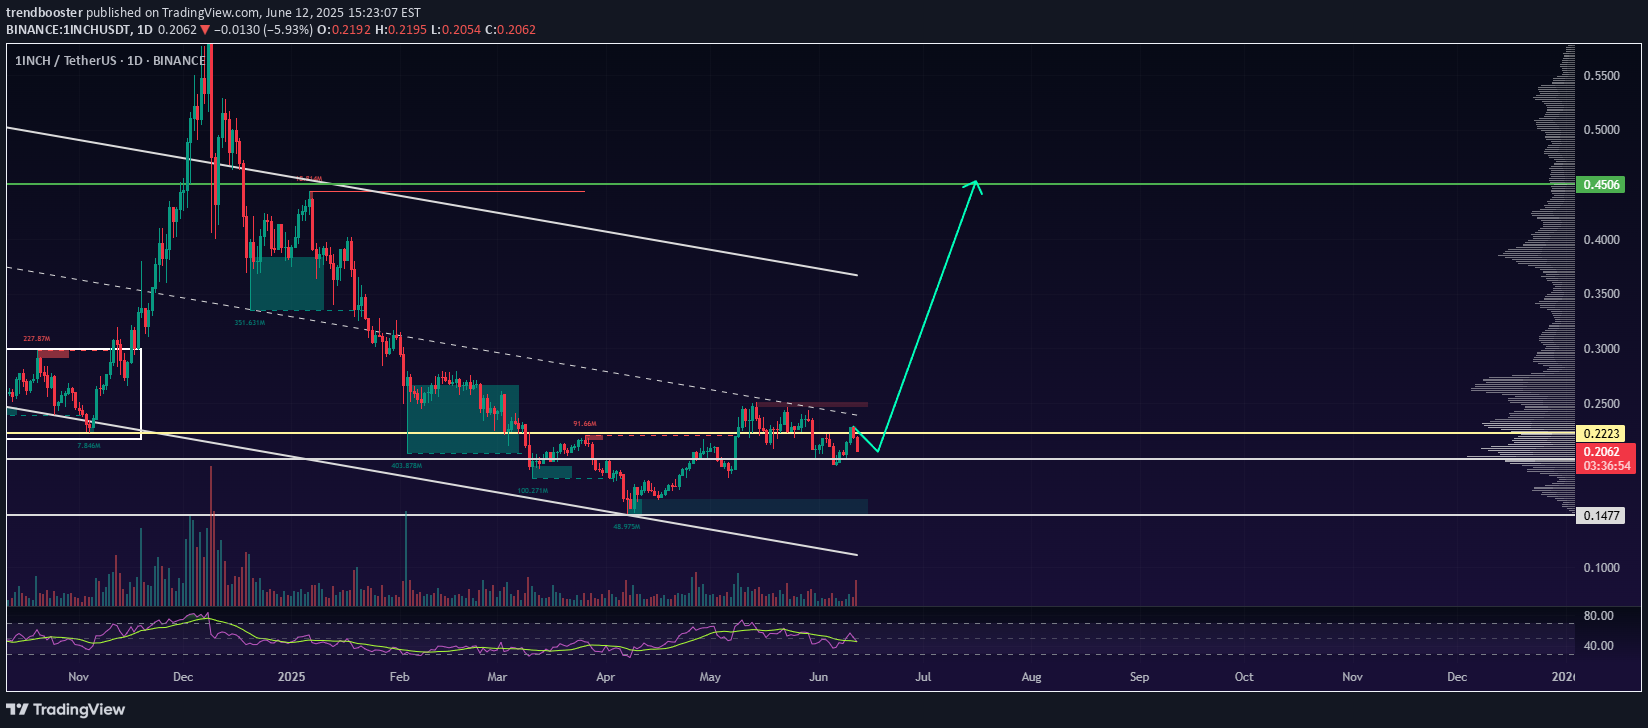
1INCHUSDT There's growing media and social media attention around the 1INCH project, which could be a bullish sentiment trigger.Currently, the price is trading within a descending channel and has recently bounced from the lower boundary, signaling a potential long entry or spot accumulation opportunity.From current levels, I expect a clean 2x upside on spot. Personally, I think it's worth starting to scale in carefully on spot or futures.However, keep in mind — even after a bounce, price could still dip slightly lower before any meaningful move up. A deeper correction remains a possibility, so always factor in risk.📌 Key Takeaways:• Long bias from current levels• Potential 2x on spot• Further dip possible — manage risk accordinglyDYOR. Stay sharp.
trendbooster
SOL 1D. Price Action Suggests a Bullish Move. 12/06/25
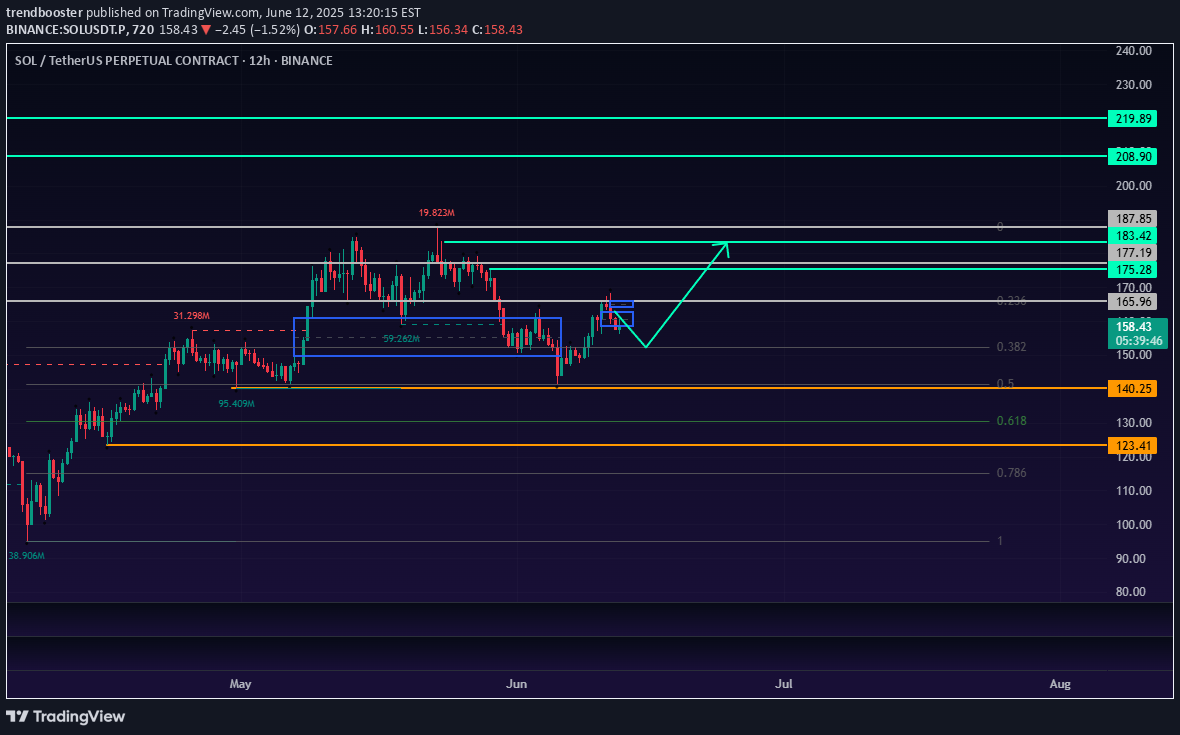
SOLUSDT The current price action looks bullish, and it's likely we’ll see a push toward the $170–$180 range without major pullbacks. I’ve outlined a potential path on the chart reflecting short-term expectations.However, if the broader market experiences a correction, there's no reason we couldn't see a retracement to the 0.5–0.618 Fibonacci levels. For that reason, it's wise to have limit orders set just in case.Entry Points (EP):• Market• $140.25• $123.41Take Profit (TP):• $175.28• $183.42• $208.90⚠️ This is not financial advice. Just my personal outlook based on current structure.Please do your own research and remember: your decisions are your responsibility.Stick to your risk management plan, and never risk more than 2% of your portfolio per trade.Wishing everyone green candles and solid gains!DYOR.
trendbooster
DOGE 1D: Missed PEPE? Don’t Miss DOGE 06/12/25
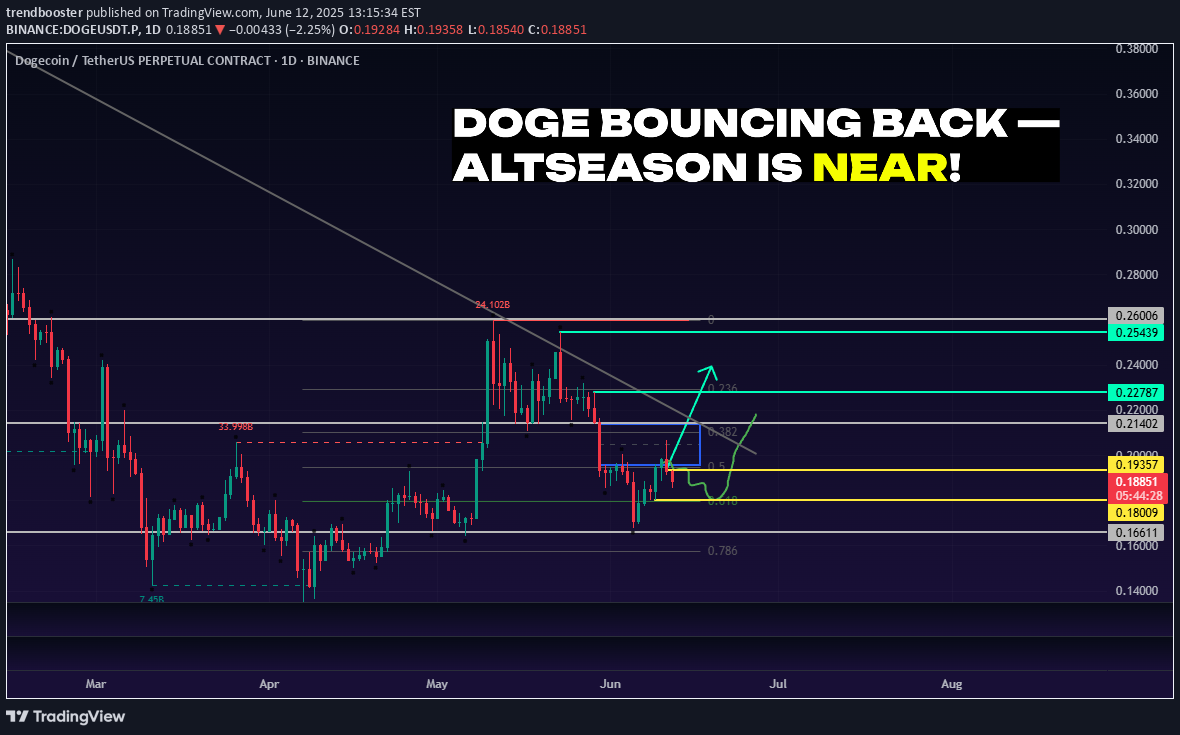
DOGEUSDT I’m expecting a continuation of the upward movement and a possible trend reversal.There’s a chance we’ll revisit the 0.618 Fib level to shake out weak hands — a classic move before liftoff.Looking at the chart, it really feels like altseason is closer than anyone expects. DOGE may lead the charge.Entry Points (EP):• Market• $0.19357• $0.18009Take Profit (TP):• $0.22787• $0.25439⚠️ My personal opinion only — not financial advice.Do your own research and remember: all actions you take are your own responsibility. Practice solid risk management and avoid investing more than 2% of your total capital per trade.DYOR.
trendbooster
UNI 1D. Breakout Coming? Long-Term Setup Explained 06/11
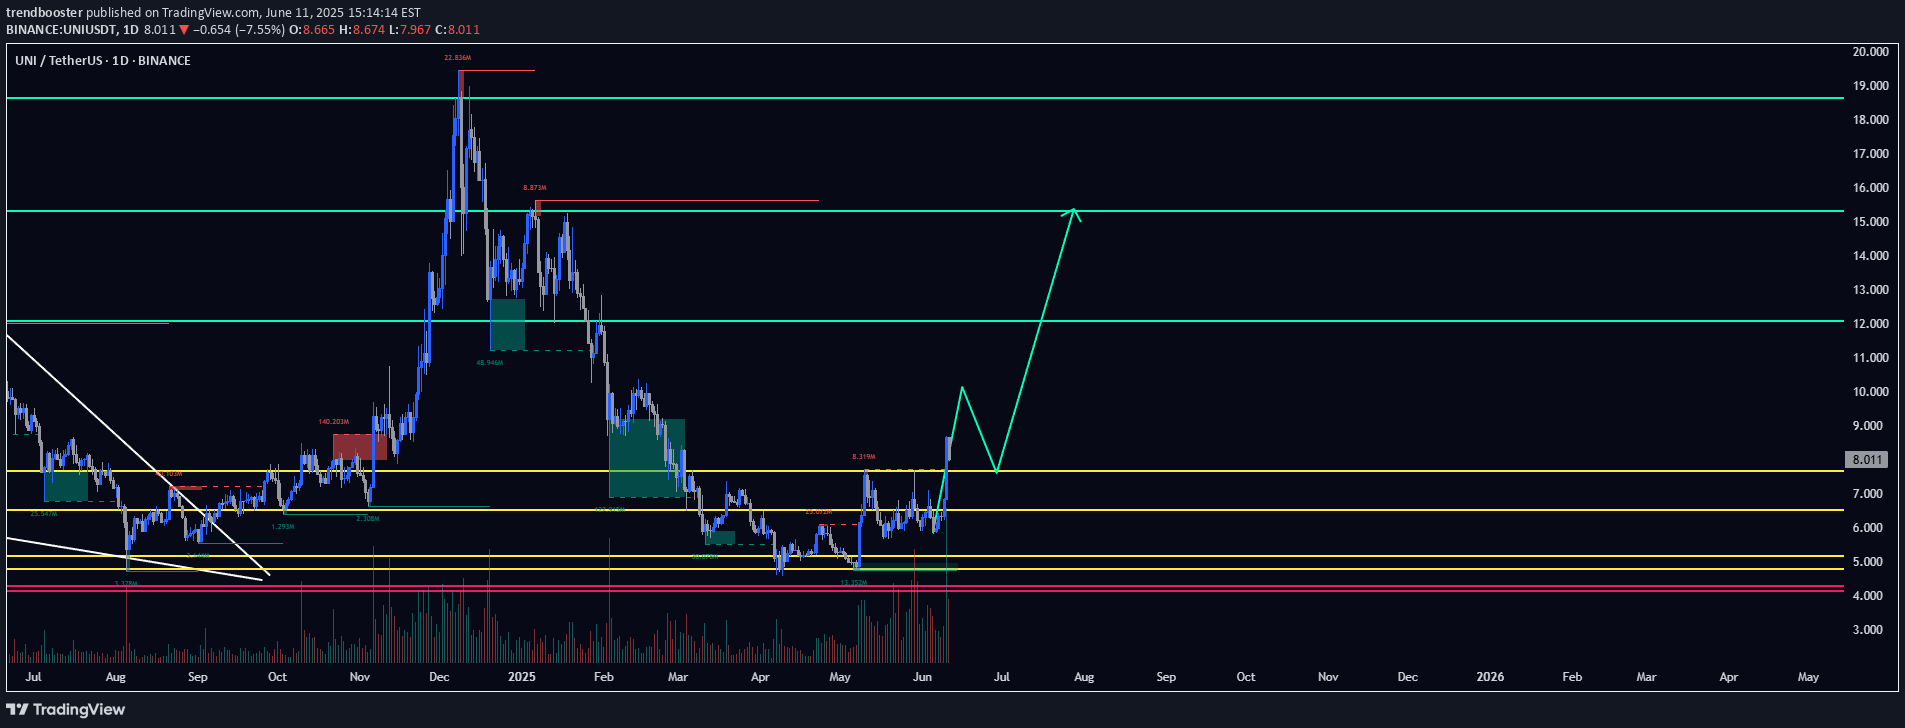
#UNI has been trading in a wide range between $4.072 – $18.634 for the past three years. This is known as an accumulation phase, where large players may be building positions ahead of the next major price move.After a steep decline, the price bounced off the key support zone at $5.623 – $4.753. It then reclaimed and held above $6.325, a historically high-volume area — a bullish signal.For short-term entries, I recommend waiting for confirmation above the 100-week moving average (MA100), which currently sits around $7.671. A break and close above that level would suggest a trend reversal.🎯 Targets:• $12.063• $15.305📥 Mid-term accumulation zone:• $5.623 – $4.753• If price drops to $4.072, it could be another solid buy opportunity.DYOR.
trendbooster
#THETA 1D. Swing High Rejected – What's Next? 06/11/25

We are currently in a consolidation range. After updating the swing high, price immediately faced seller pressure from the top of the structure.Why did this happen?Many participants were stuck in losses for a long time and decided to exit at breakeven as soon as price gave them the chance — totally understandable.Key levels for the setup:Yellow lines – potential entry points.Red lines – stop-loss levels, depending on your risk appetite (marked two options).Green lines – target areas.Whether you go with spot or futures — the setup is there. Choose your strategy accordingly.DYOR.
Disclaimer
Any content and materials included in Sahmeto's website and official communication channels are a compilation of personal opinions and analyses and are not binding. They do not constitute any recommendation for buying, selling, entering or exiting the stock market and cryptocurrency market. Also, all news and analyses included in the website and channels are merely republished information from official and unofficial domestic and foreign sources, and it is obvious that users of the said content are responsible for following up and ensuring the authenticity and accuracy of the materials. Therefore, while disclaiming responsibility, it is declared that the responsibility for any decision-making, action, and potential profit and loss in the capital market and cryptocurrency market lies with the trader.