
tradingconmike
@t_tradingconmike

What symbols does the trader recommend buying?
Purchase History
پیام های تریدر
Filter
Signal Type
tradingconmike

Prospects remain positive as investors bet on lower global interest rates, perhaps look for diversification opportunities away from elevated stocks or, in the case of central banks, continue to reduce exposure to the USD (net central bank gold purchases have grown strongly in the past two years, reports indicate). Broadly, history suggests higher Gold prices are usually associated with a softer tone in the USD so Gold strength and a firm USD look a little odd; something may have to give. Guys, what do you think? Leave a comment with your thoughts.
tradingconmike

To what level can Bitcoin rise? There is an analyst that I respect a lot, from Standard Chartered, who has considered the most likely target for Bitcoin's rise, the price of 200,000. I am more of a chart person, and we are going to go level by level, seeing the evolution of the price on the chart. Financial advisors who have recommended their clients invest in cash Bitcoin ETFs have advised them to allocate 3.5% of their financial assets. It strikes me that the group of financial advisors who have made this investment recommendation to their clients is a small group. Institutions have not yet entered Bitcoin spot ETFs in large volume, because they have not had time to decide, and they will most likely do so now once a correction has begun. So there is money waiting to flow into spot Bitcoin ETFs. In such a way, that analyst's forecast can be fulfilled. Now, I prefer to look at the chart. What are we seeing in the short term? The day before yesterday, there was less money coming into the spot Bitcoin ETFs, and yesterday we had net outflows by funds from the spot Bitcoin ETFs. What does this reveal? It reveals that the bubble of optimism of people who believed that there were not going to be enough bitcoins for everyone is being punctured. We see that desire to buy Bitcoin has been reduced. And what do we see on the chart? The medium and long-term trend continues to be bullish, and what we are witnessing is a correction. It is an orderly, logical and normal correction. There is a bearish channel, and I have established first resistance at the 68.123 zone. In the short term, we are going to consider as the most likely scenario that Bitcoin continues to fall to that support zone that is around 61.000 And when it reaches that zone, or when we see some type of exhaustion pattern, we will think about whether it has made a bottom and can deploy another leg upwards. Guys, what do you think? Leave a comment with your thoughts.
tradingconmike

We have a possible Triangle pattern with a target at 0.46, as long as the price does not break the 0.37 zone.
tradingconmike
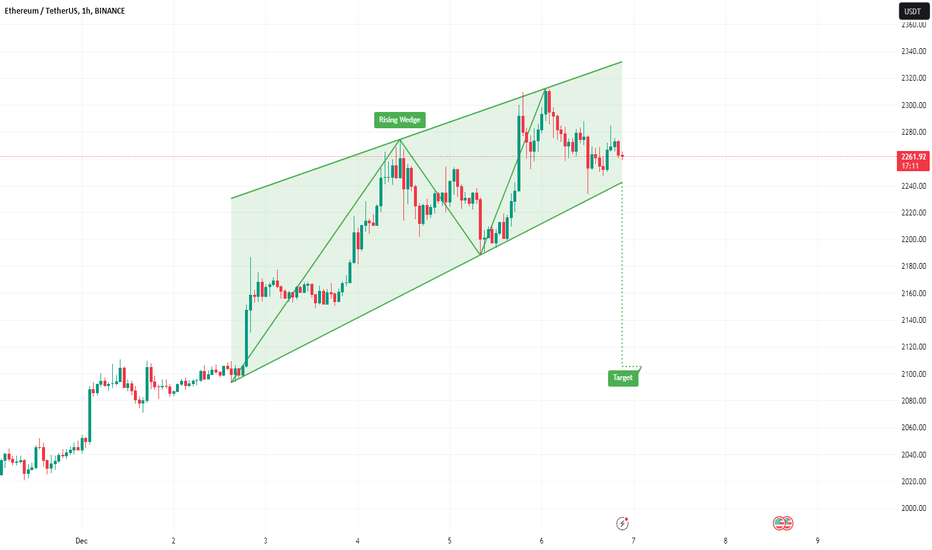
We have a possible Rising Wedge pattern with a target at 2100, as long as the price does not break the 2360 zone.
tradingconmike
GOLD → Some gains after rally above $2,015 XAUUSD finds itself trading into multi-month highs, looking to clear more topside space after climbing back over the $2,000 handle once more. Finding chart territory north of $2,000 has proven a challenge for Gold bidders after the XAU/USD dropped below the key level back in May, trading back into the year's lows near the $1,800 region. October saw the XAU/USD rally back into positive territory, and Gold is up over 11% from October's low of $1,810. Spot Gold saw fresh bidding after getting pulled down into the 200-day Simple Moving Average (SMA), and buyers will be looking for a fresh round of bids if the XAU/USD sinks back towards $1,950.
tradingconmike

GOLD → $1,950 in sight Hourly candles see the XAUUSD knocking back into the 200-hour Simple Moving Average (SMA) after a failed bid for higher chart ground, slipping back from Wednesday's weekly high set at $1,975. The 50-hour SMA is showing a mixing of near-term momentum, consolidating with the longer moving average near $1,960. On the daily candlesticks, the XAU/USD is churning after a bounce off the 200-day SMA is facing resistance early on. The 200-day and 50-day SMAs are consolidating around $1,930 as long-term momentum drains out of Spot Gold, and sellers will be looking for a break of last week's bottom bids near $1,930 while the topside target remains late October's high-water mark etched in just north of the $2,000 major handle.
tradingconmike
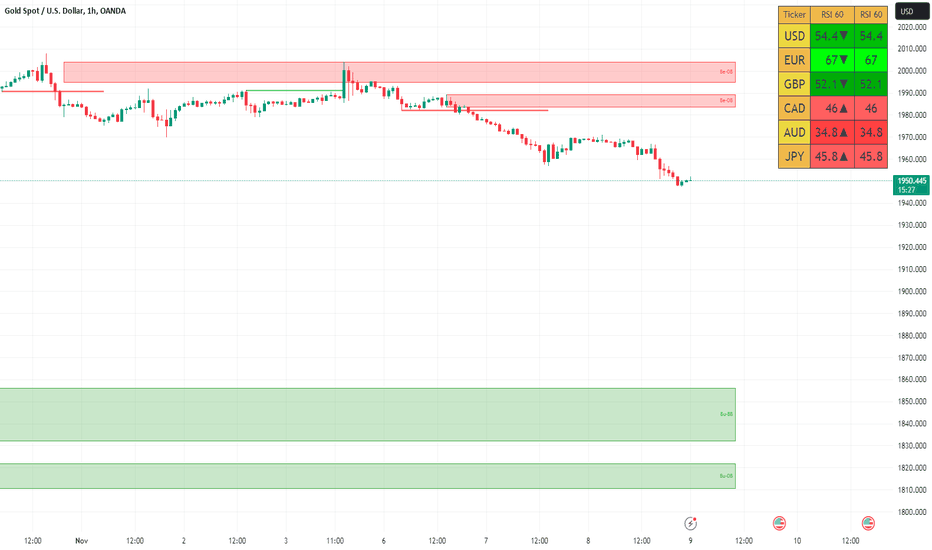
GOLD → XAU/USD extending declines into $1,950 Gold's extension into three straight declining days is sending the XAUUSD back towards the 200-day Simple Moving Average (SMA) currently near $1,935. Recent momentum in the Spot Gold chart has left both a lower low and a higher high acting as technical boundaries for trend momentum; the near-term technical ceiling sits at $2,009 while the floor on any bearish continuations will eventually need to clear $1,810.
tradingconmike
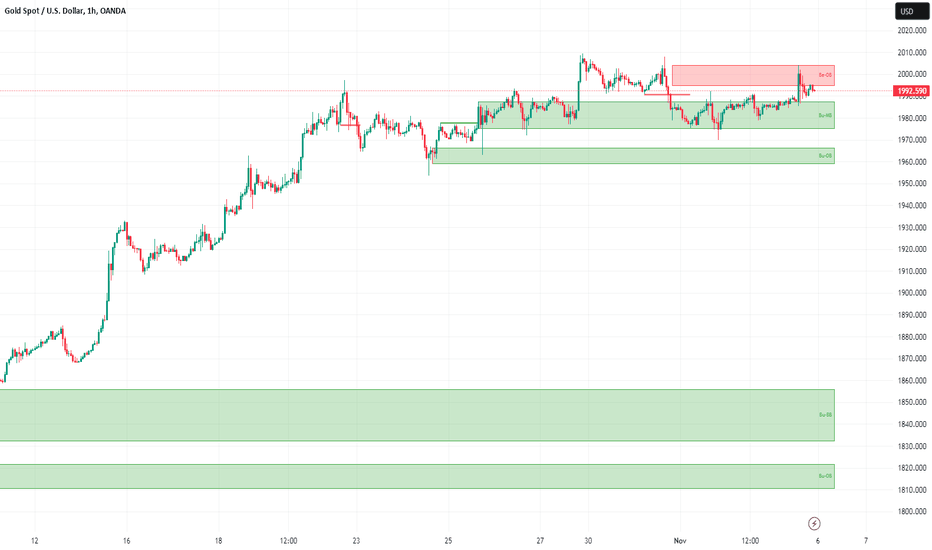
GOLD → Paddling just beneath $2,000 The XAUUSD bid into an intraday high just shy of $2,005 on Friday following the worst read on US Nonfarm Payrolls (NFP) in almost 3 years, but Gold bids recovered to the midrange of the day's trading to finish up near $1,992.50. The US NFP report missed expectations, showing the US added only 150 thousand jobs in October compared to September's bumper reading of 297 thousand jobs additions, which saw a downside revision from the initial print of 336K. Markets initially expected an October reading of 180K, and the headline miss has global markets surging into the trading week's close as investors cheer the heralded end of Federal Reserve rate hikes. Gold initially tapped a weekly high of $2,008 on Tuesday before swinging into a weekly low of $1,970. Despite the NFP miss, Gold struggled to etch in firm gains as cooler metal heads prevail; despite cooling US data, inflation and excess wage growth remain key factors for the Fed, and a single bad NFP reading will do little to push the Fed off of their "higher-for-longer" stance on interest rates. Money markets are currently pricing in odds of a full percentage rate cute by the end of 2024, a look-ahead that could stand to be premature as the Fed grapples with getting a firm grasp on price volatility. XAU/USD Technical Outlook Spot Gold bids are etching in the beginning stages of a rising channel in the near-term, and bids are leaning towards the bullish side with XAU/USD intraday action trading on the north side of the 200-hour Simple Moving Average (SMA) currently rising from $1,985. Spot Gold has been trading on the top side of the 200-day SMA currently grinding towards $1,940, and Friday's knock back from the $2,000 major handle sees XAU/USD backing away in preparation for another topside run next week.
Disclaimer
Any content and materials included in Sahmeto's website and official communication channels are a compilation of personal opinions and analyses and are not binding. They do not constitute any recommendation for buying, selling, entering or exiting the stock market and cryptocurrency market. Also, all news and analyses included in the website and channels are merely republished information from official and unofficial domestic and foreign sources, and it is obvious that users of the said content are responsible for following up and ensuring the authenticity and accuracy of the materials. Therefore, while disclaiming responsibility, it is declared that the responsibility for any decision-making, action, and potential profit and loss in the capital market and cryptocurrency market lies with the trader.