
traderspro_charts
@t_traderspro_charts

What symbols does the trader recommend buying?
Purchase History
پیام های تریدر
Filter
Signal Type
traderspro_charts
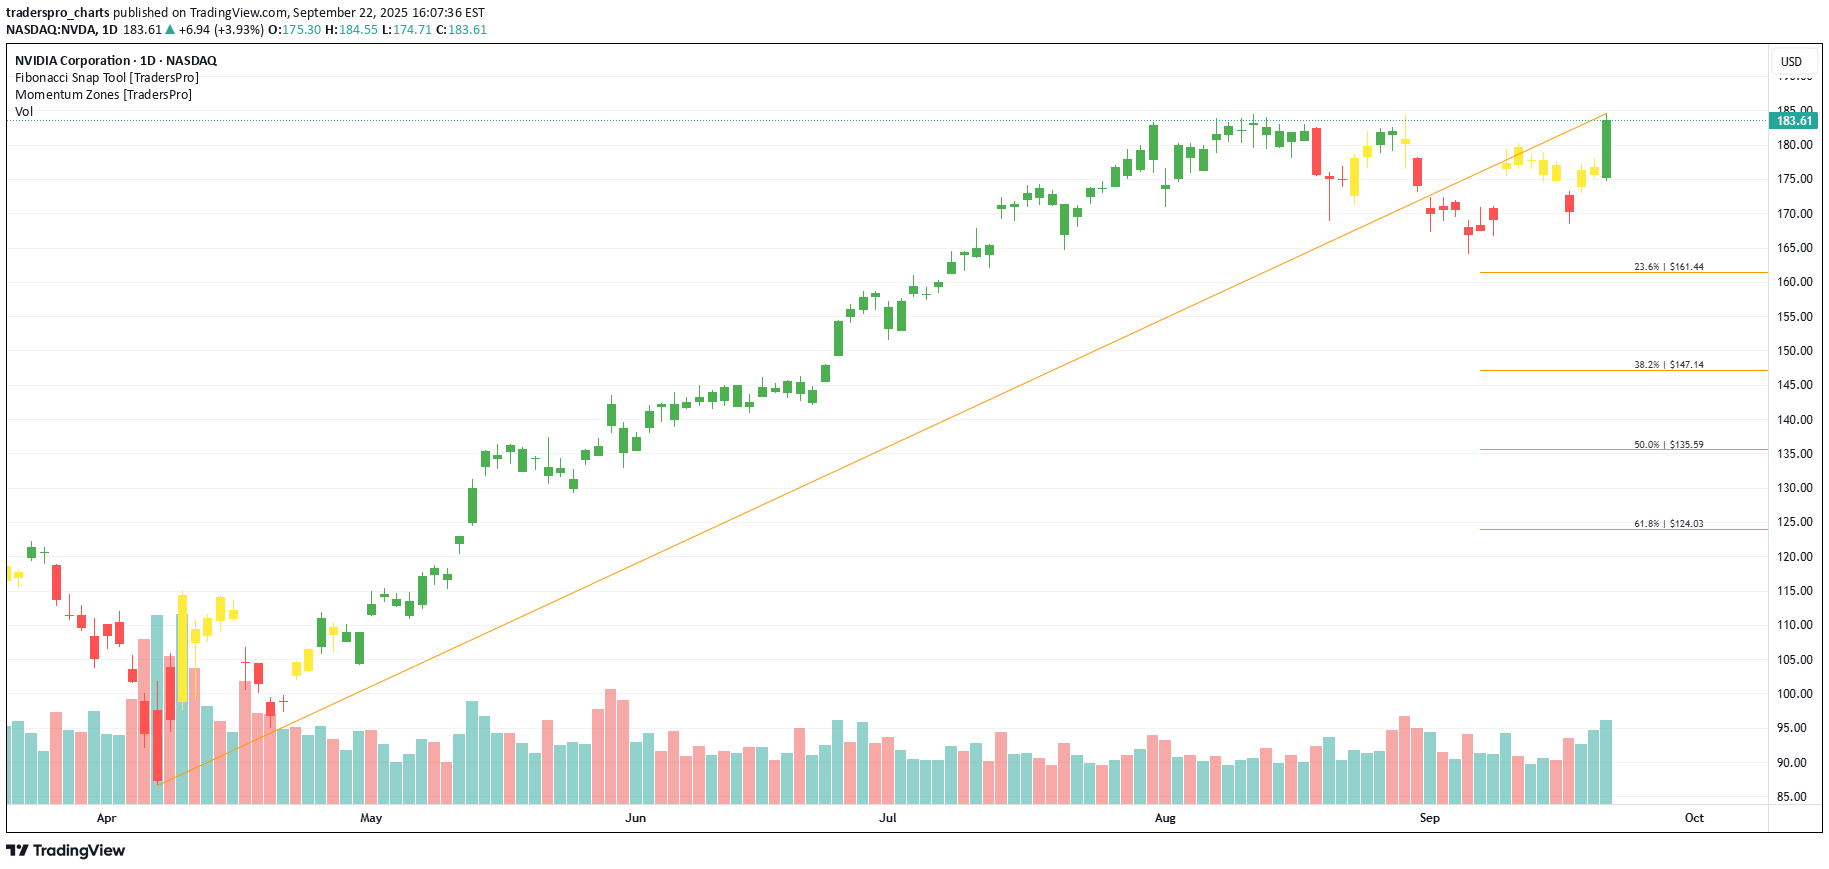
NVIDIA Corporation (NVDA) is a global leader in graphics processing units (GPUs) and AI computing platforms. Best known for powering gaming, data centers, and professional visualization, NVIDIA also drives innovation in autonomous vehicles, healthcare, and supercomputing. The company’s growth is fueled by explosive demand for AI chips, the rise of cloud computing, and its ability to expand GPU technology into nearly every corner of the digital economy. On the chart, a confirmation bar with rising volume highlights bullish momentum. The price has entered the momentum zone after climbing above the .236 Fibonacci level. A trailing stop can be placed just below this Fibonacci line using the Fibonacci snap tool, helping traders lock in profits while staying positioned for more potential upside.
traderspro_charts
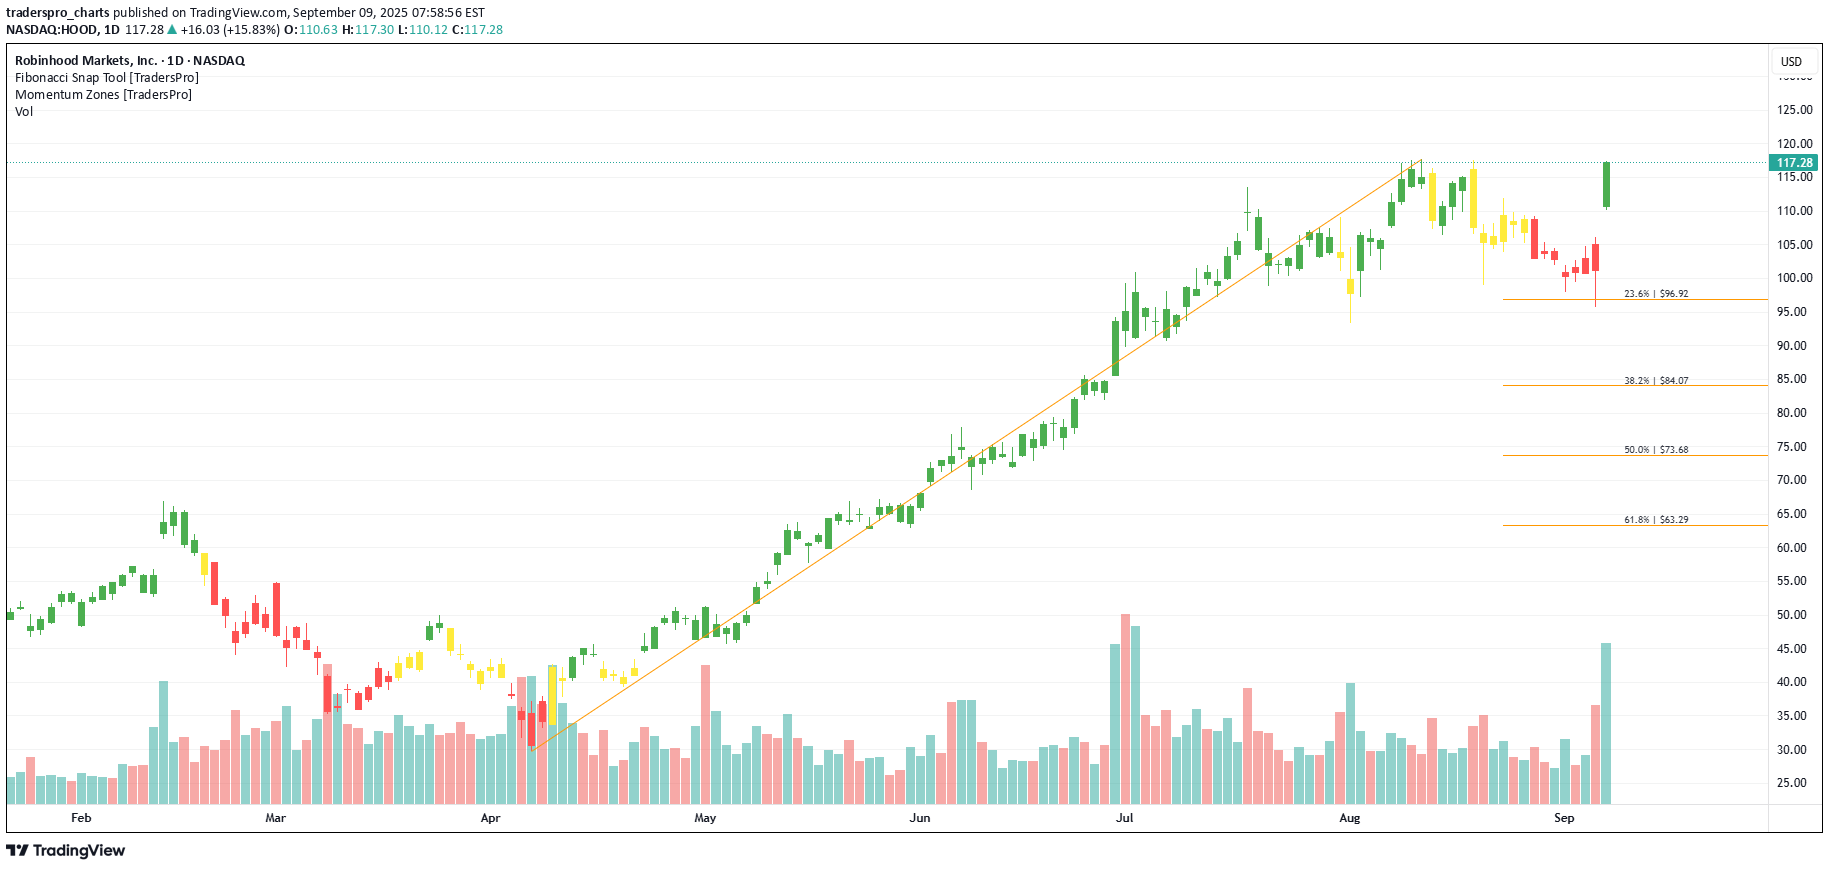
Robinhood Markets, Inc. (HOOD) is a financial services platform best known for pioneering commission-free trading of stocks, ETFs, options, and cryptocurrencies. With a mobile-first approach, Robinhood has attracted millions of retail investors and continues to expand into new financial products like retirement accounts and credit cards. The company’s growth is fueled by user-friendly technology, democratization of investing, and increasing participation from younger generations entering the markets. On the chart, a confirmation bar with rising volume shows strong buying interest. The price has entered the momentum zone after breaking above the .236 Fibonacci level. A trailing stop can be placed just below this Fibonacci line using the Fibonacci snap tool, helping traders secure gains while leaving room for additional upside.
traderspro_charts
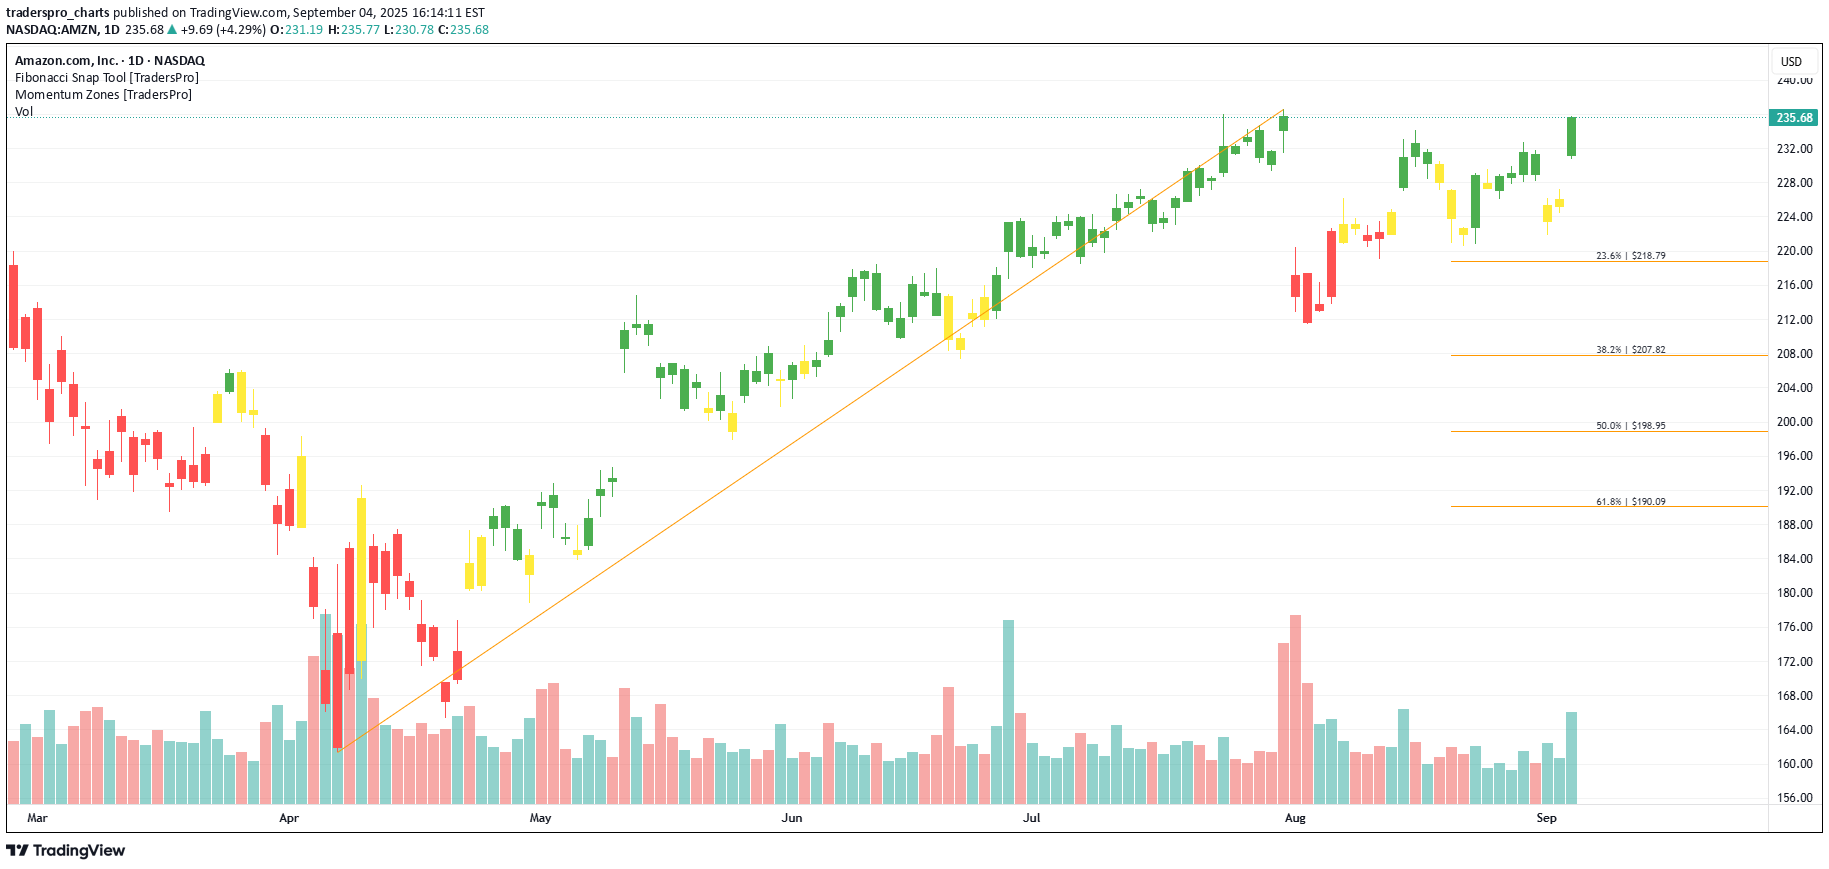
Amazon.com, Inc. (AMZN) is a global leader in e-commerce and cloud computing, best known for its massive online marketplace and its AWS cloud platform. The company also operates in digital streaming, logistics, and AI-powered technology solutions. Amazon’s growth is fueled by the continued shift to online shopping, the rapid expansion of AWS, and investments in logistics, automation, and emerging technologies that keep it at the forefront of global innovation. On the chart, a confirmation bar with rising volume shows bullish momentum. The price has entered the momentum zone after moving above the .236 Fibonacci level. Traders can set a trailing stop just below this Fibonacci line using the Fibonacci snap tool, helping protect gains while leaving room for more upside potential.
traderspro_charts
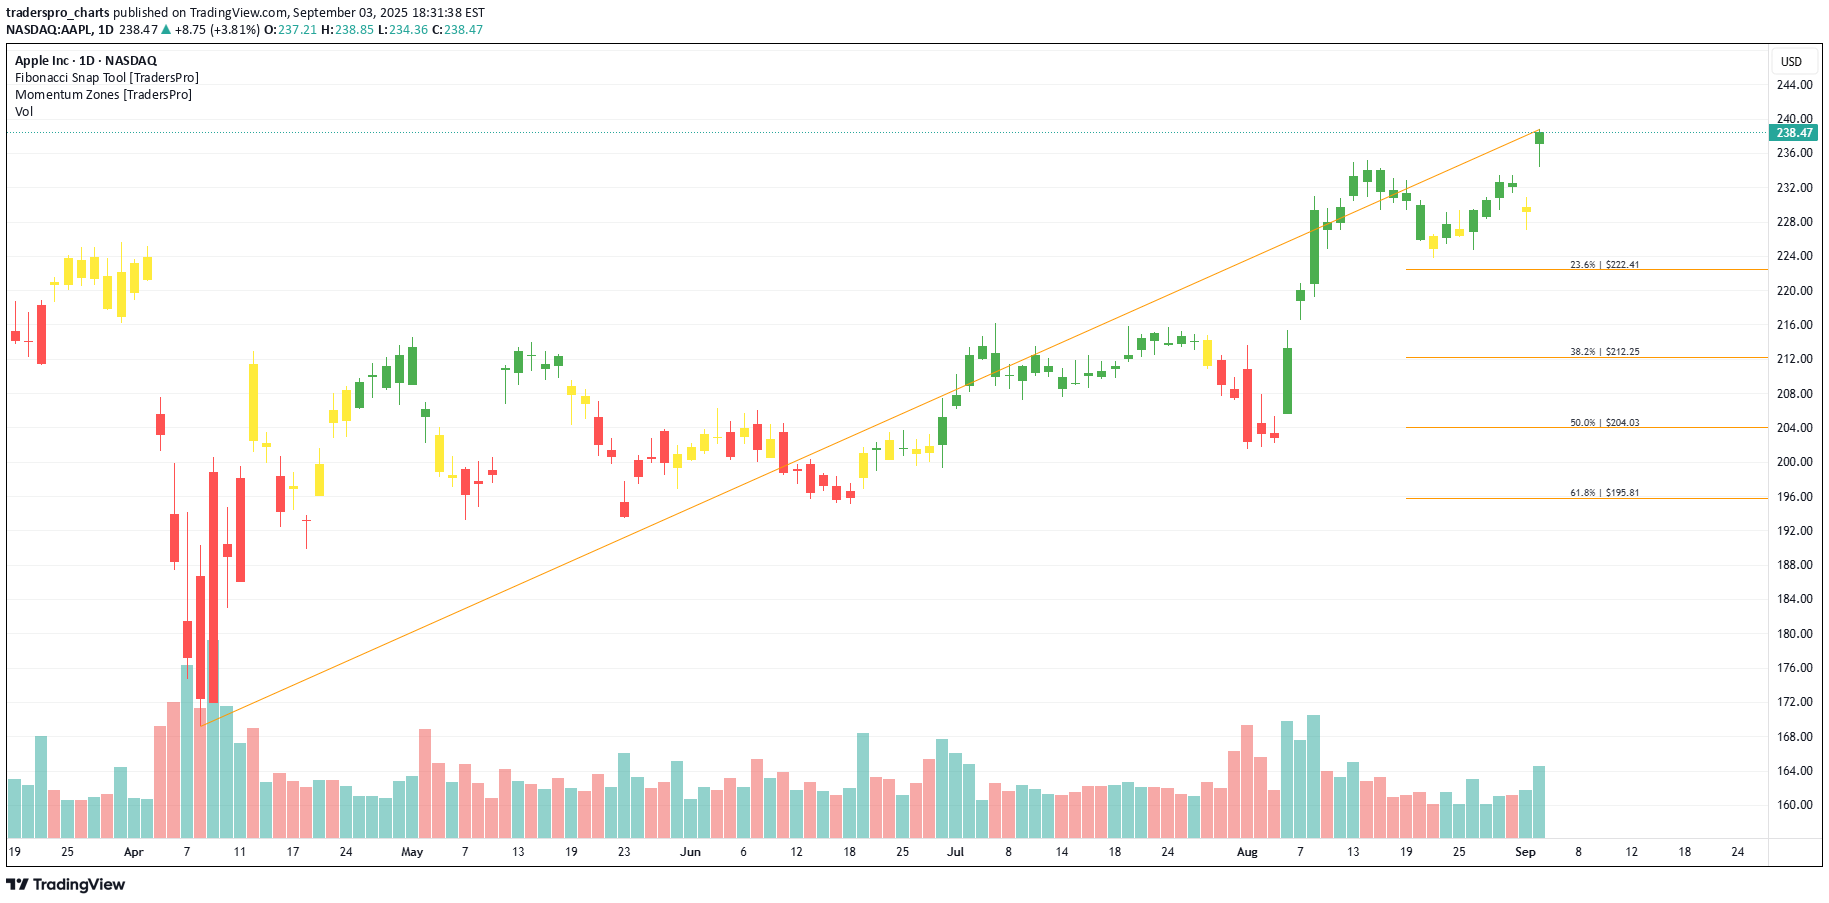
Apple Inc. (AAPL) is one of the world’s most valuable technology companies, known for its iconic products like the iPhone, iPad, Mac, Apple Watch, and AirPods. The company also generates strong recurring revenue through services such as the App Store, Apple Music, and iCloud. Apple’s growth is fueled by constant product innovation, a loyal global customer base, and expanding services that complement its hardware ecosystem. On the chart, a confirmation bar with rising volume shows bullish strength. The price has entered the momentum zone by moving above the .236 Fibonacci level. A trailing stop can be set just below this Fibonacci line using the Fibonacci snap tool, helping traders secure profits while allowing room for more upside potential.
traderspro_charts
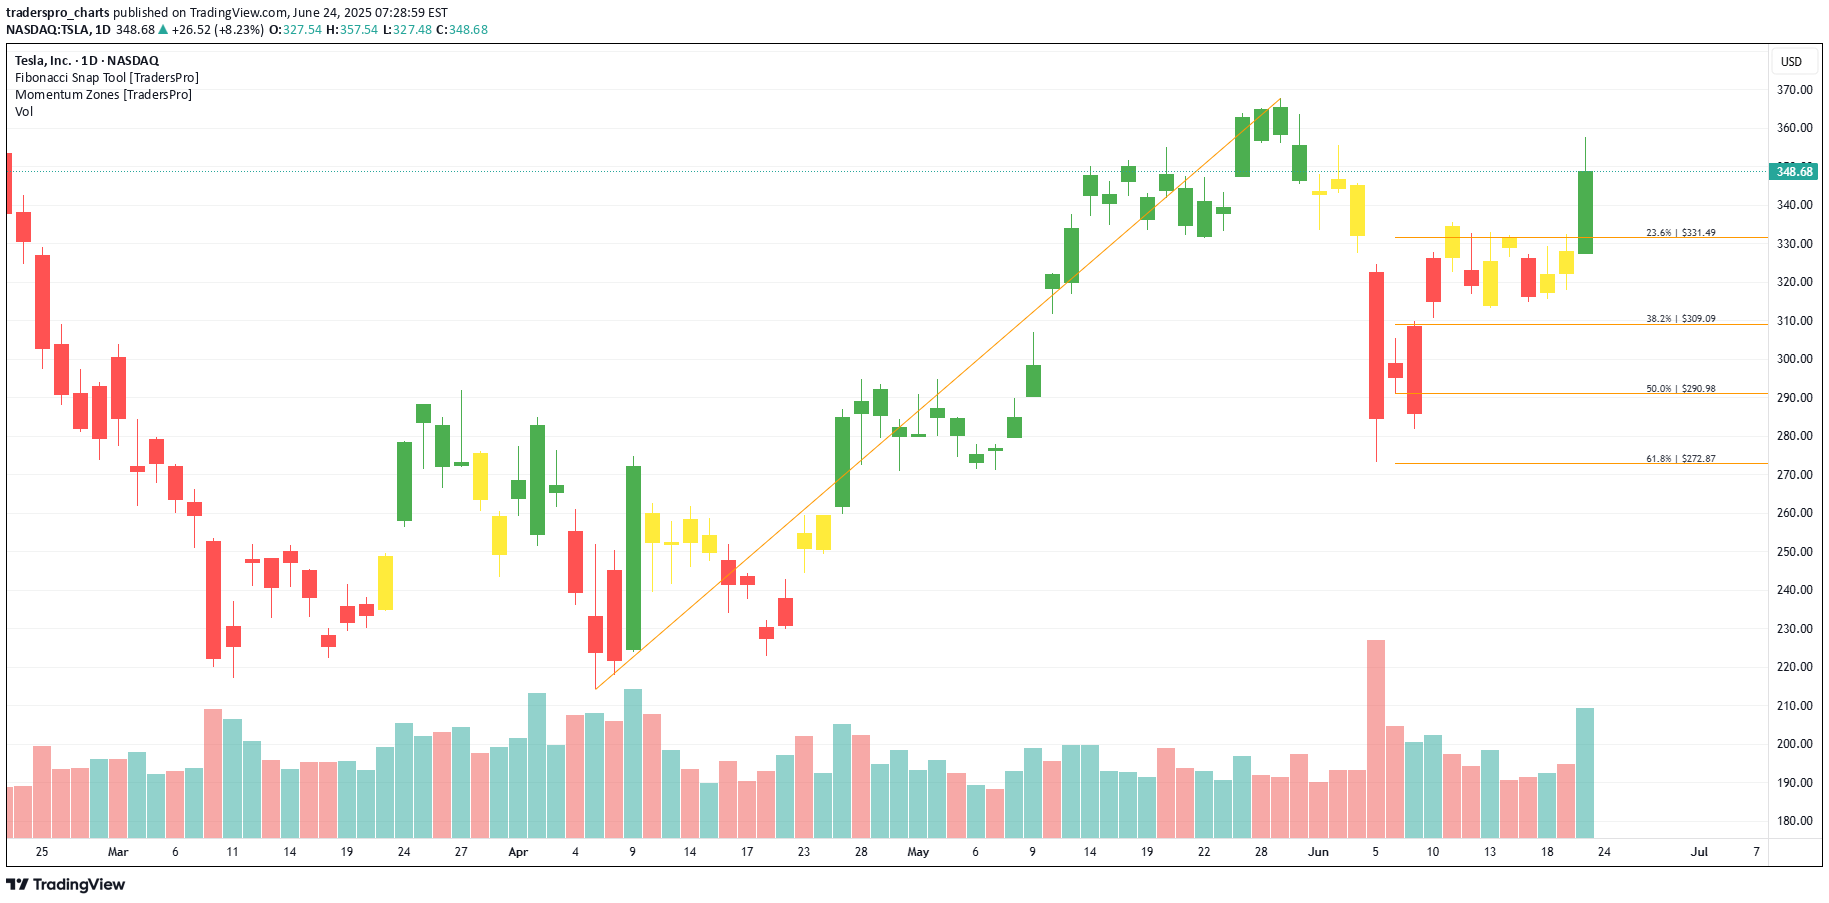
Tesla, Inc. (TSLA) is a global leader in electric vehicles, clean energy solutions, and battery technology. The company designs and manufactures EVs, solar products, and energy storage systems that help drive the transition to sustainable energy. Tesla’s growth is fueled by rising EV adoption, battery innovations, and expansion into new markets with its cutting-edge technologies. On the chart, a confirmation bar with increasing volume signals strong buying interest. The price has moved into the momentum zone by breaking above the .236 Fibonacci level. A trailing stop can be set just below this level using the Fibonacci snap tool to protect gains as momentum continues.
traderspro_charts
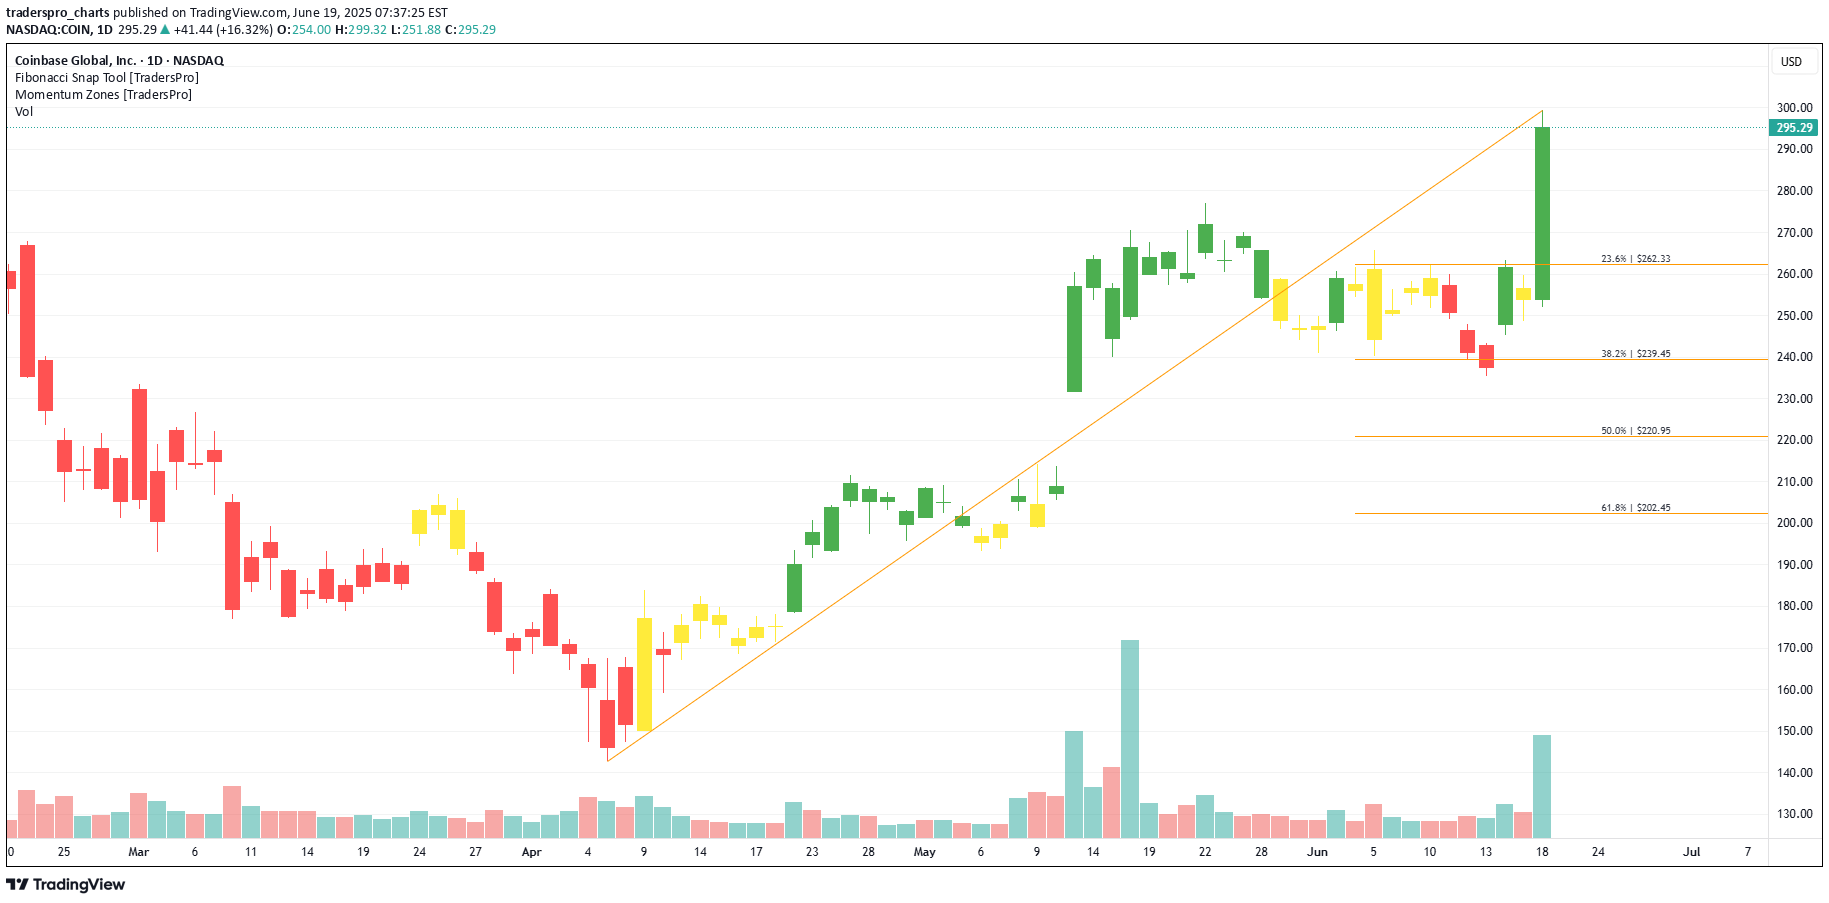
Coinbase Global, Inc. (COIN) is one of the largest cryptocurrency platforms in the U.S., providing a trusted marketplace for buying, selling, and storing digital assets like Bitcoin and Ethereum. Known for its user-friendly interface and strong security, Coinbase supports both retail and institutional traders. The company’s growth is fueled by increasing crypto adoption, rising trading volumes, and its expanding lineup of blockchain-related services. On the chart, a confirmation bar with rising volume confirms momentum. The price has moved into the momentum zone after breaking above the .236 Fibonacci level. Using the Fibonacci snap tool, traders can place a trailing stop just below the .236 level to manage risk while capturing more upside.
Disclaimer
Any content and materials included in Sahmeto's website and official communication channels are a compilation of personal opinions and analyses and are not binding. They do not constitute any recommendation for buying, selling, entering or exiting the stock market and cryptocurrency market. Also, all news and analyses included in the website and channels are merely republished information from official and unofficial domestic and foreign sources, and it is obvious that users of the said content are responsible for following up and ensuring the authenticity and accuracy of the materials. Therefore, while disclaiming responsibility, it is declared that the responsibility for any decision-making, action, and potential profit and loss in the capital market and cryptocurrency market lies with the trader.