
traderchamp_
@t_traderchamp_

What symbols does the trader recommend buying?
Purchase History
پیام های تریدر
Filter
traderchamp_
XMR BEARISH SETUP

With the recent bearish momentum we have witnessed a breakout on support and the recent pullback can trigger another selling pressure as a continuation of the major bearish trend to the downside.
traderchamp_
BITCOIN BEARISH SETUP

Bitcoin (BTC/USDT) – Breakdown from Double Top Confirms Bearish Trend Continuation The 4-hour chart of BTC/USDT (Binance Perpetual Contracts) presents a textbook double top formation followed by a confirmed breakdown below structural support levels. The bearish trend has already met its first target, and technicals suggest the move could extend lower toward the key demand zone around $96,000. 🔍 Key Technical Highlights: Double Top Pattern: Clear double top structure formed between $109,000–$110,000, followed by a strong rejection. Support Break: Price broke down below key support at ~$105,000, triggering a sell-off and validating the bearish reversal. Bearish Retest: After the breakdown, price retested the broken trendline (highlighted with a red zone) and failed to reclaim the range. First Target Hit: Price achieved the first projected support zone at around $101,000. Next Target: Based on measured move projection and previous structure, the next downside target lies near the $96,000 mark. 📉 Outlook: The structure remains bearish as long as BTC trades below the broken support-turned-resistance zone (~$105,000). Momentum favors continued downside toward the next key zone unless a significant bullish reversal signal emerges.
traderchamp_
BITCOIN BEARISH SETUP

Technical Analysis Summary: Pattern Formation: The chart shows a descending triangle pattern with double tops, indicating bearish pressure at resistance levels. Breakdown Confirmation: Price has broken below a key ascending trendline (shown in dashed line) and retested the breakdown area, forming a bearish rejection (highlighted red zone). Key Zone: The price is currently trading around $105,075, just under the previous support-turned-resistance zone (~$106,000). This confirms a failed bullish structure and strengthens the bearish outlook. Targets: First Target: Around $101,000–102,000, aligning with the next visible support zone. Second Target: Around $97,000–98,000, which is a major support / key zone based on prior structure. Bias: Bearish in the short term, as long as price remains below the $106,000 resistance zone. Trade Setup Outlook: A short position is implied by the arrows. Best entries are around retests near $105,500–106,000 with stops above the recent highs (~$107,000). Conservative profit-taking at the first target, with extended TP near the key support zone.First Target has been achieved with the escalating war tensions in the Middle East. We continue to monitor the prices of Bitcoin during this time as we have anticipated for a further decline towards the next support identified.First Target has been achieved with the escalating war tensions in the Middle East. We continue to monitor the prices of Bitcoin during this time as we have anticipated for a further decline towards the next support identified.
traderchamp_
ZECUSDT BEARISH SETUP

Identified a trend breakout under the daily timeframe which has a potential for a retest back on the key zone highlighted. Expecting a continuation in the bearish trend to follow up price target close to $40.A decent runner
traderchamp_
ETH BULLISH SETUP

Ethereum has recently broken out bullishly on higher timeframes, signaling a potential move toward the key resistance zone around $3,460. This level holds significant technical importance. The breakout above the hourly flag pattern confirms bullish momentum. As long as price holds above $2,300, the setup remains valid. A drop below this level would invalidate the current bullish outlook.
traderchamp_
GOLD BEARISH SETUP
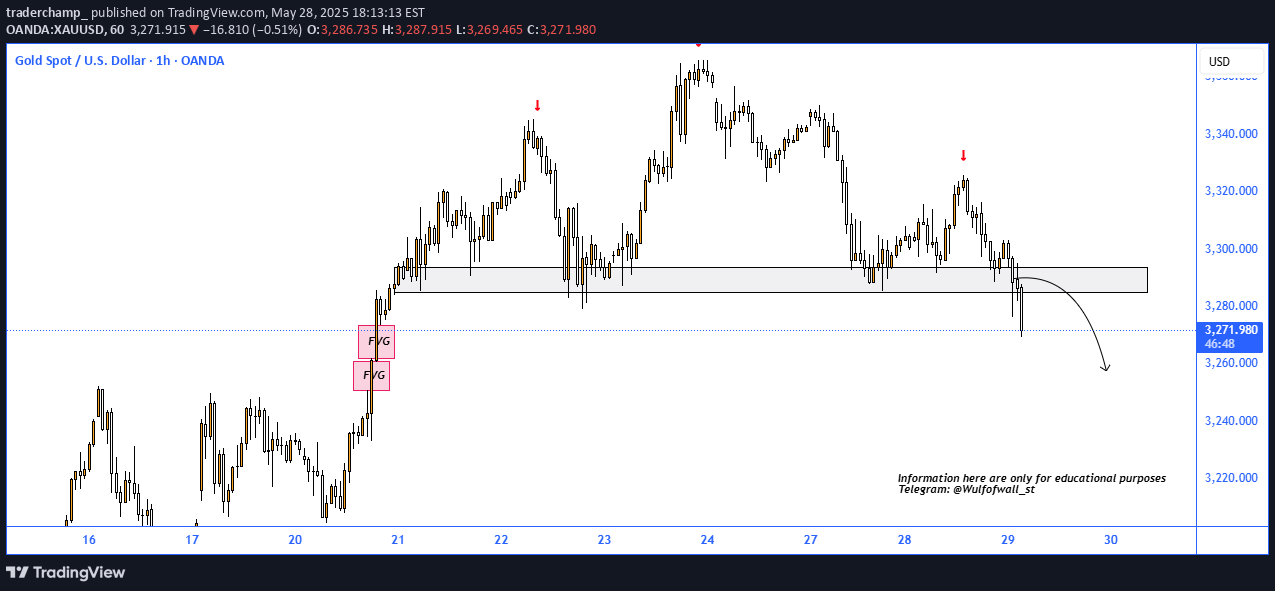
Identified a breakout on the support / neckline on the head and shoulder pattern under the hourly timeframe. We witness a possibility of a filling the imbalance created inside the 1hour candles close to 3273-3250 region with the continuation of bearish trend expected.
traderchamp_
BTC BULLISH SETUP

BTCUSDT is looking for a reversal and to take the bullish trend extended towards the FVG formed on top. Under the lower timeframes we have a valid reversal indication identified.
traderchamp_
TAO BULLISH SETUP

TAOUSDT on a major hourly support, where we are looking for a possible short term reversal for a high accuracy opportunity.
traderchamp_
GOLD POSSIBLE REVERSAL ON TREND LINE SUPPORT

GOLD holding on a major daily trend line support after a massive decline since last friday! Expecting a recovery with a bullish reversal from the lows of $2970's
traderchamp_
Bearish Projection - XAUUSD

📉Bearish Projection - XAUUSD 📌On the 4-hour timeframe, the recent bullish trend appears to have completed its fifth wave, reaching the upper boundary of the structure. Additionally, Fibonacci extensions have surpassed the 2.618% level, indicating a potential retracement or corrective phase. Given the strong rally from $2832 to $3146, we anticipate a pullback toward the $2990 - $2945 zone, aligning with the 50%-61.8% Fibonacci retracement levels. The recent surge in gold prices, driven by escalating trade tensions and geopolitical uncertainty, has led to significant resistance breakouts across multiple timeframes. With the US Jobs data release** scheduled this week, we could see increased momentum supporting a bearish correction for XAUUSD. ➡️Daily Support - 3010-3000 ➡️Key Level - 3056-3044 ➡️Expected Price Region - 2990-2945 ➖➖➖➖➖➖➖➖➖
Disclaimer
Any content and materials included in Sahmeto's website and official communication channels are a compilation of personal opinions and analyses and are not binding. They do not constitute any recommendation for buying, selling, entering or exiting the stock market and cryptocurrency market. Also, all news and analyses included in the website and channels are merely republished information from official and unofficial domestic and foreign sources, and it is obvious that users of the said content are responsible for following up and ensuring the authenticity and accuracy of the materials. Therefore, while disclaiming responsibility, it is declared that the responsibility for any decision-making, action, and potential profit and loss in the capital market and cryptocurrency market lies with the trader.