
tim13l
@t_tim13l
What symbols does the trader recommend buying?
Purchase History
پیام های تریدر
Filter
Signal Type

tim13l
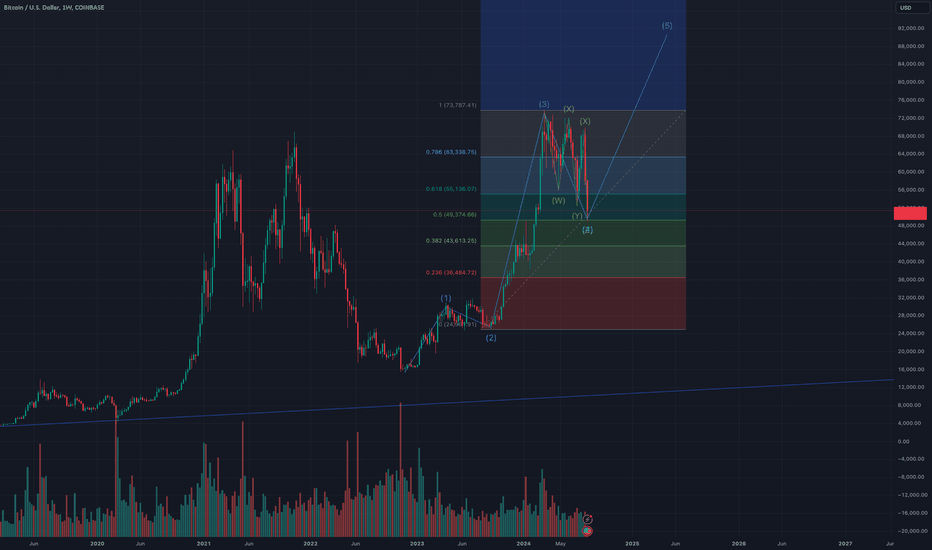
Correction wave 4 with structure W-X-Y-XX-Z of global bullish impulse seems to finish soon. It already reached 0.5 level of Fib of previous bullish wave 3. Now we expecting the final bullish wave 5 of current Bitcoin rally. The only question that remains is how will altcoins behave?

tim13l
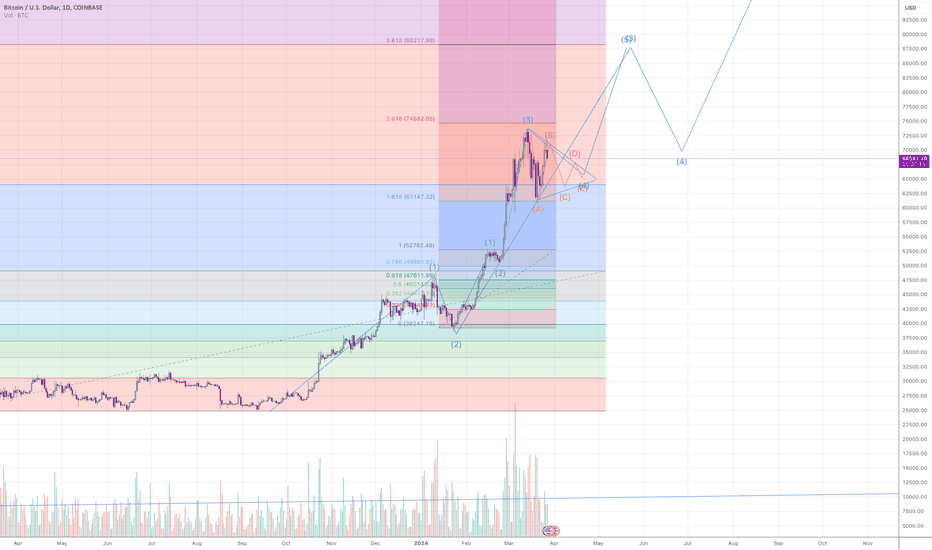
Now the price seems to draw convergent triangle in the correction wave 4 of the wave 3. Wave in wave in wave. Happy announce to you that we have 1 more year of bullish market. Just stay in your favourite altcoins until BTC dominance is not <35%.

tim13l
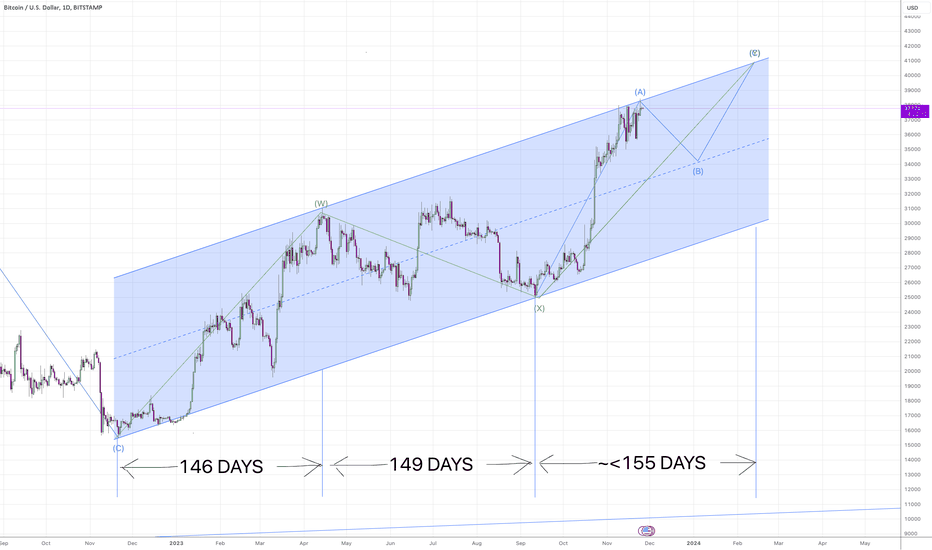
As we observe the Bitcoin market dynamics, a fascinating pattern emerges within the framework of an ascending channel, characterized by a double zigzag formation WXY. Wave W: Spanning 146 days, Wave W exhibits the attributes of a simple zigzag. Wave X: With a duration of 150 days, Wave X presents a more complex structure, resembling a double three formation. Wave Y: Currently unfolding, Wave, also simple zigzag, could least to 155 days, with Part A nearing completion.Looking ahead, the market is anticipated to enter Wave B, a corrective phase to approximately $34,000 by early January. As we approach mid-February, the forecast suggests an upward trajectory, with Bitcoin potentially reaching the $40,000 mark.

tim13l
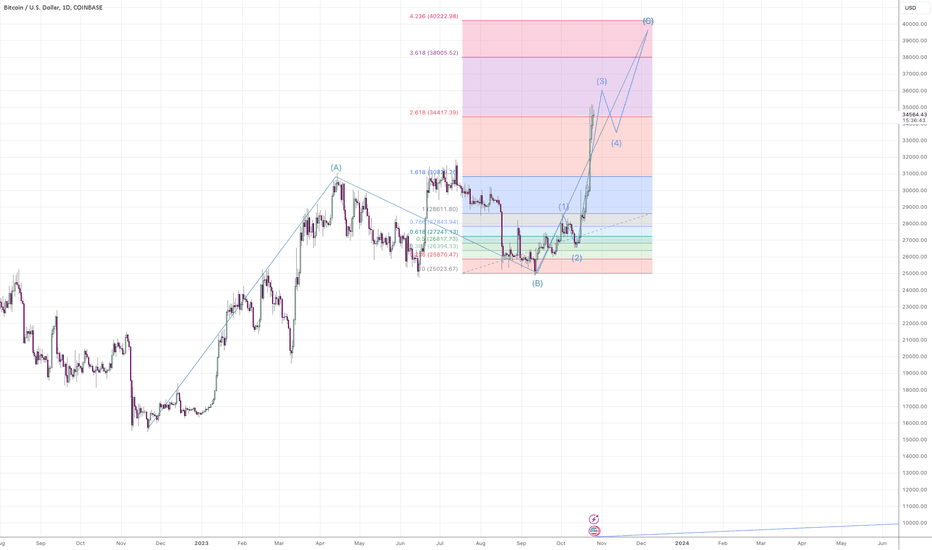
Bitcoin pleased us with a good upward movement, but it won't last longer than 1 month. Final targets for this growth are ~38000$ or ~40000$. There after some confirmations will be good position for buying PUT options or trade Short.

tim13l
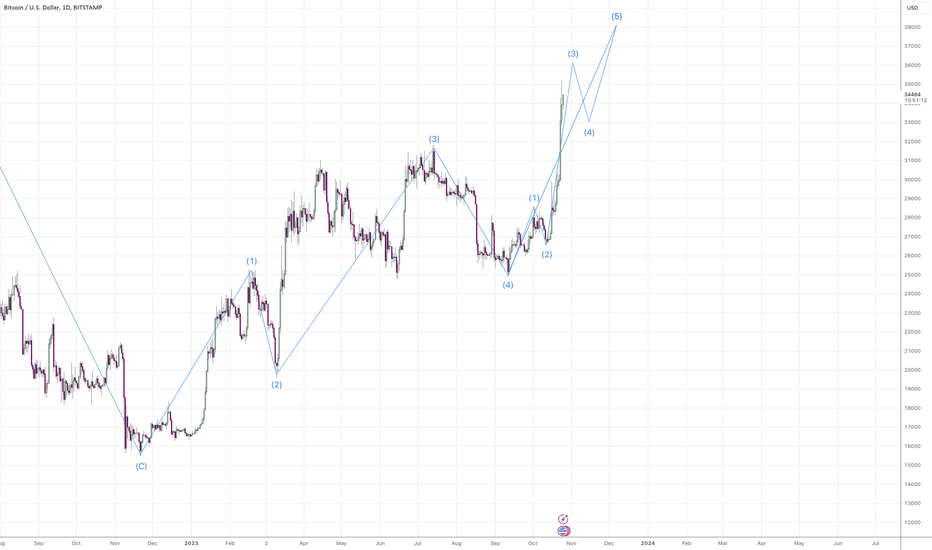
After careful analysis, it's clear we've entered a bull market for BTC. The global correction wave 4 concluded in November 2022, and the recent price actions offer confirmation. Here are the key takeaways: The trend from 23rd November 2022 presents as a robust bullish impulse. All impulse waves and corrections looks nice and well-balanced. The waves within this trend are well-proportioned and align with various Fibonacci levels. It's almost too good to be true! We're currently riding wave 5 of the initial bullish impulse. Expect bullish momentum to persist until the end of November. Following that, prepare for a retracement back to the ~$25000 region before we launch into a massive bull run for 2024!This forecast seems to be very positive. The target here noted correctly, but we are not in Bull market. We have some bullish period until December and then there will be the Final Year of Bearish market.

tim13l
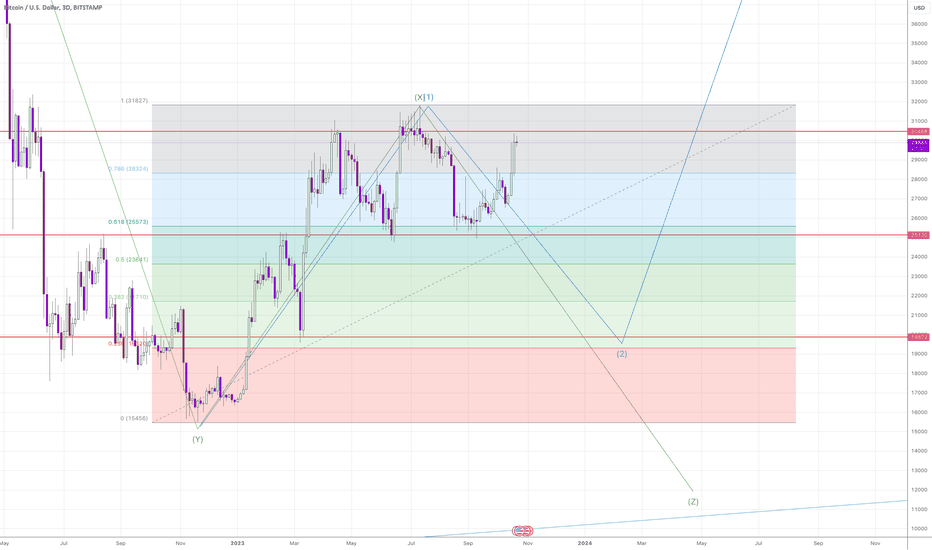
Analyzing the 3-day timeframe for BTC/USD, two primary scenarios arise: Bearish Outlook: Current wave XX-Z indicates a possible triple combo wave W-X-Y-XX-Z. With wave X potentially concluding, a move downwards for wave Y is anticipated. Bullish Correction: Despite a bullish market, a correction wave 2 could drive prices down to 23,700, below the 0.5 Fibonacci level. An emerging "head and shoulders" pattern supports a bearish trajectory, targeting a price equivalent to the height of the formation, indicating prices below 19,800. Recommendation: Watch for a confirming bearish candle pattern on the 1-day or 3-day chart. Ensure proper risk management and consider external influencing factors.

tim13l
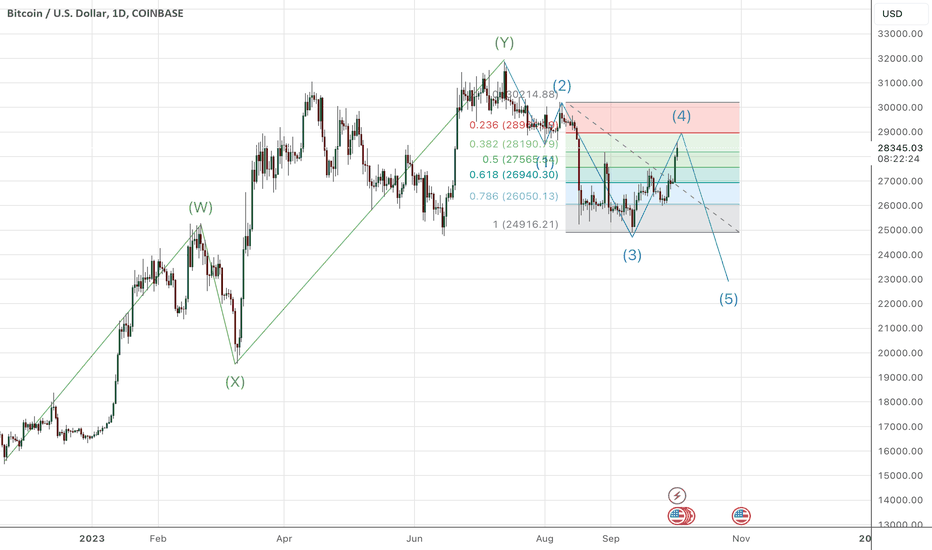
Current bullish movement possible is the correction Elliot's wave 4 to the previous fall from 30300$ to 24800$. The correction wave 4 could be either long in time or sharp and deep. Here deep variant is represented. According to this version the price can not be higher than the highest point of correction wave 2, and also the level 23.6 fib is close (29000$). So we can put sell limits to the 29000$ with stop loss around 30300$.

tim13l
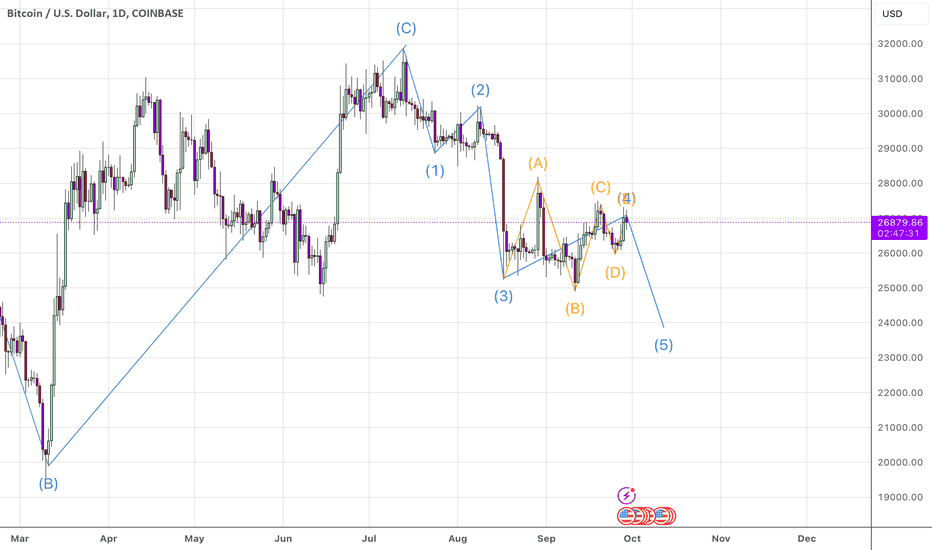
We observe the possibility of converging triangle of the 4th Elliott correction wave appeared on BTCUSDT chart. We may enter short NOW with the target ~23000. If the price will break the rules and knock out the stops from above in the area of 27000-28000, it may be good idea to reenter with SL around 29000 and target price 23000.

tim13l
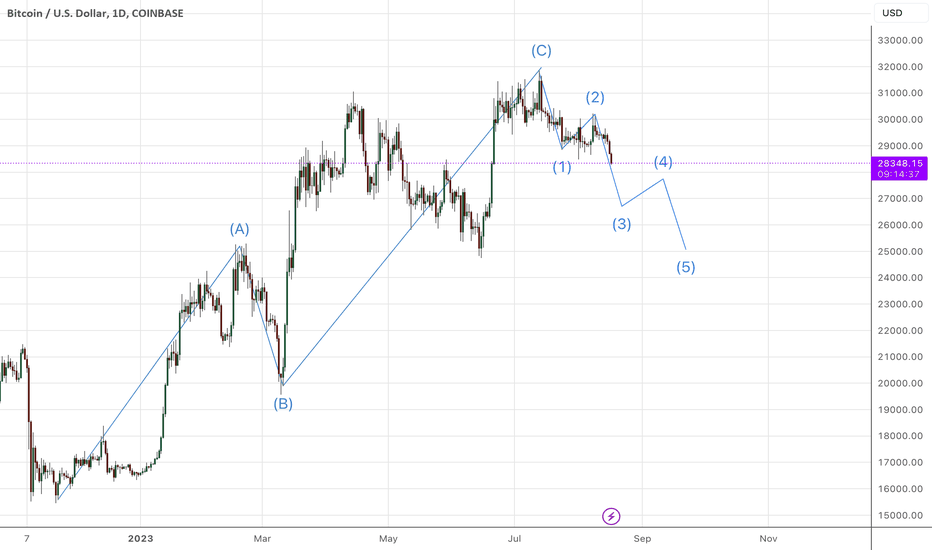
Everything goes as we expected before. Update for Elliot's waves forecast. Stay tuned!

tim13l
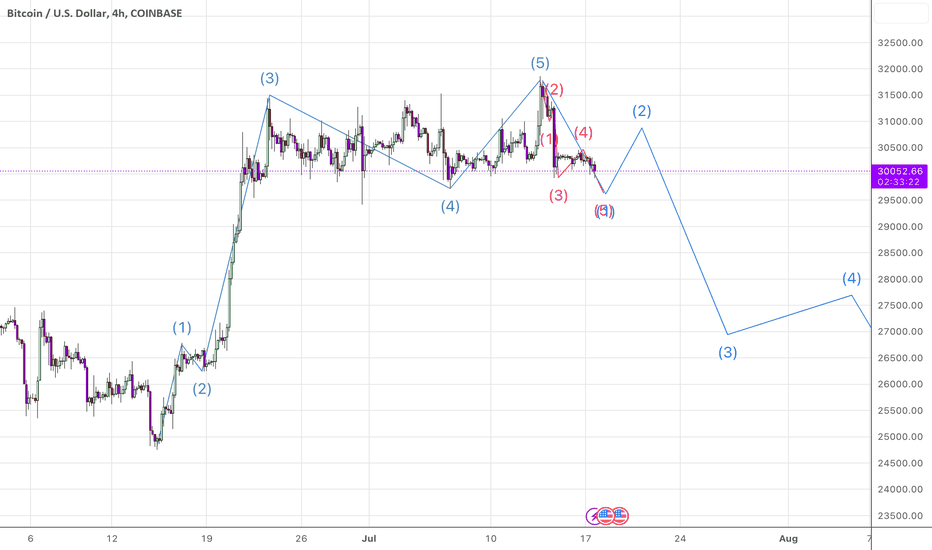
BTCUSDT wave XX of global correction ended and now is SHORT time The global correction wave XX possibly is finished with last impulse for BTCUSDT (15 of June - 13 of July). What we see from 13 of July to today looks like the beginning of the impulse wave 1 of first part correction of future big correction wave Z, which will lead to global trend line up to $13K. Good point for enter is now if you trade with not big leverage, otherwise you need to wait the correction wave 2 for 1st impulse down and may enter SHORT from ~30500$ to 30800$ with stop loss above 32000$. Target for this trade is the end of wave 3, it may be around 26000$. Check my previous predictions (read comments) and you can verify that Elliot Waves works good.
Disclaimer
Any content and materials included in Sahmeto's website and official communication channels are a compilation of personal opinions and analyses and are not binding. They do not constitute any recommendation for buying, selling, entering or exiting the stock market and cryptocurrency market. Also, all news and analyses included in the website and channels are merely republished information from official and unofficial domestic and foreign sources, and it is obvious that users of the said content are responsible for following up and ensuring the authenticity and accuracy of the materials. Therefore, while disclaiming responsibility, it is declared that the responsibility for any decision-making, action, and potential profit and loss in the capital market and cryptocurrency market lies with the trader.