
tienbmdev97
@t_tienbmdev97

What symbols does the trader recommend buying?
Purchase History
پیام های تریدر
Filter
tienbmdev97
SHORT LINK
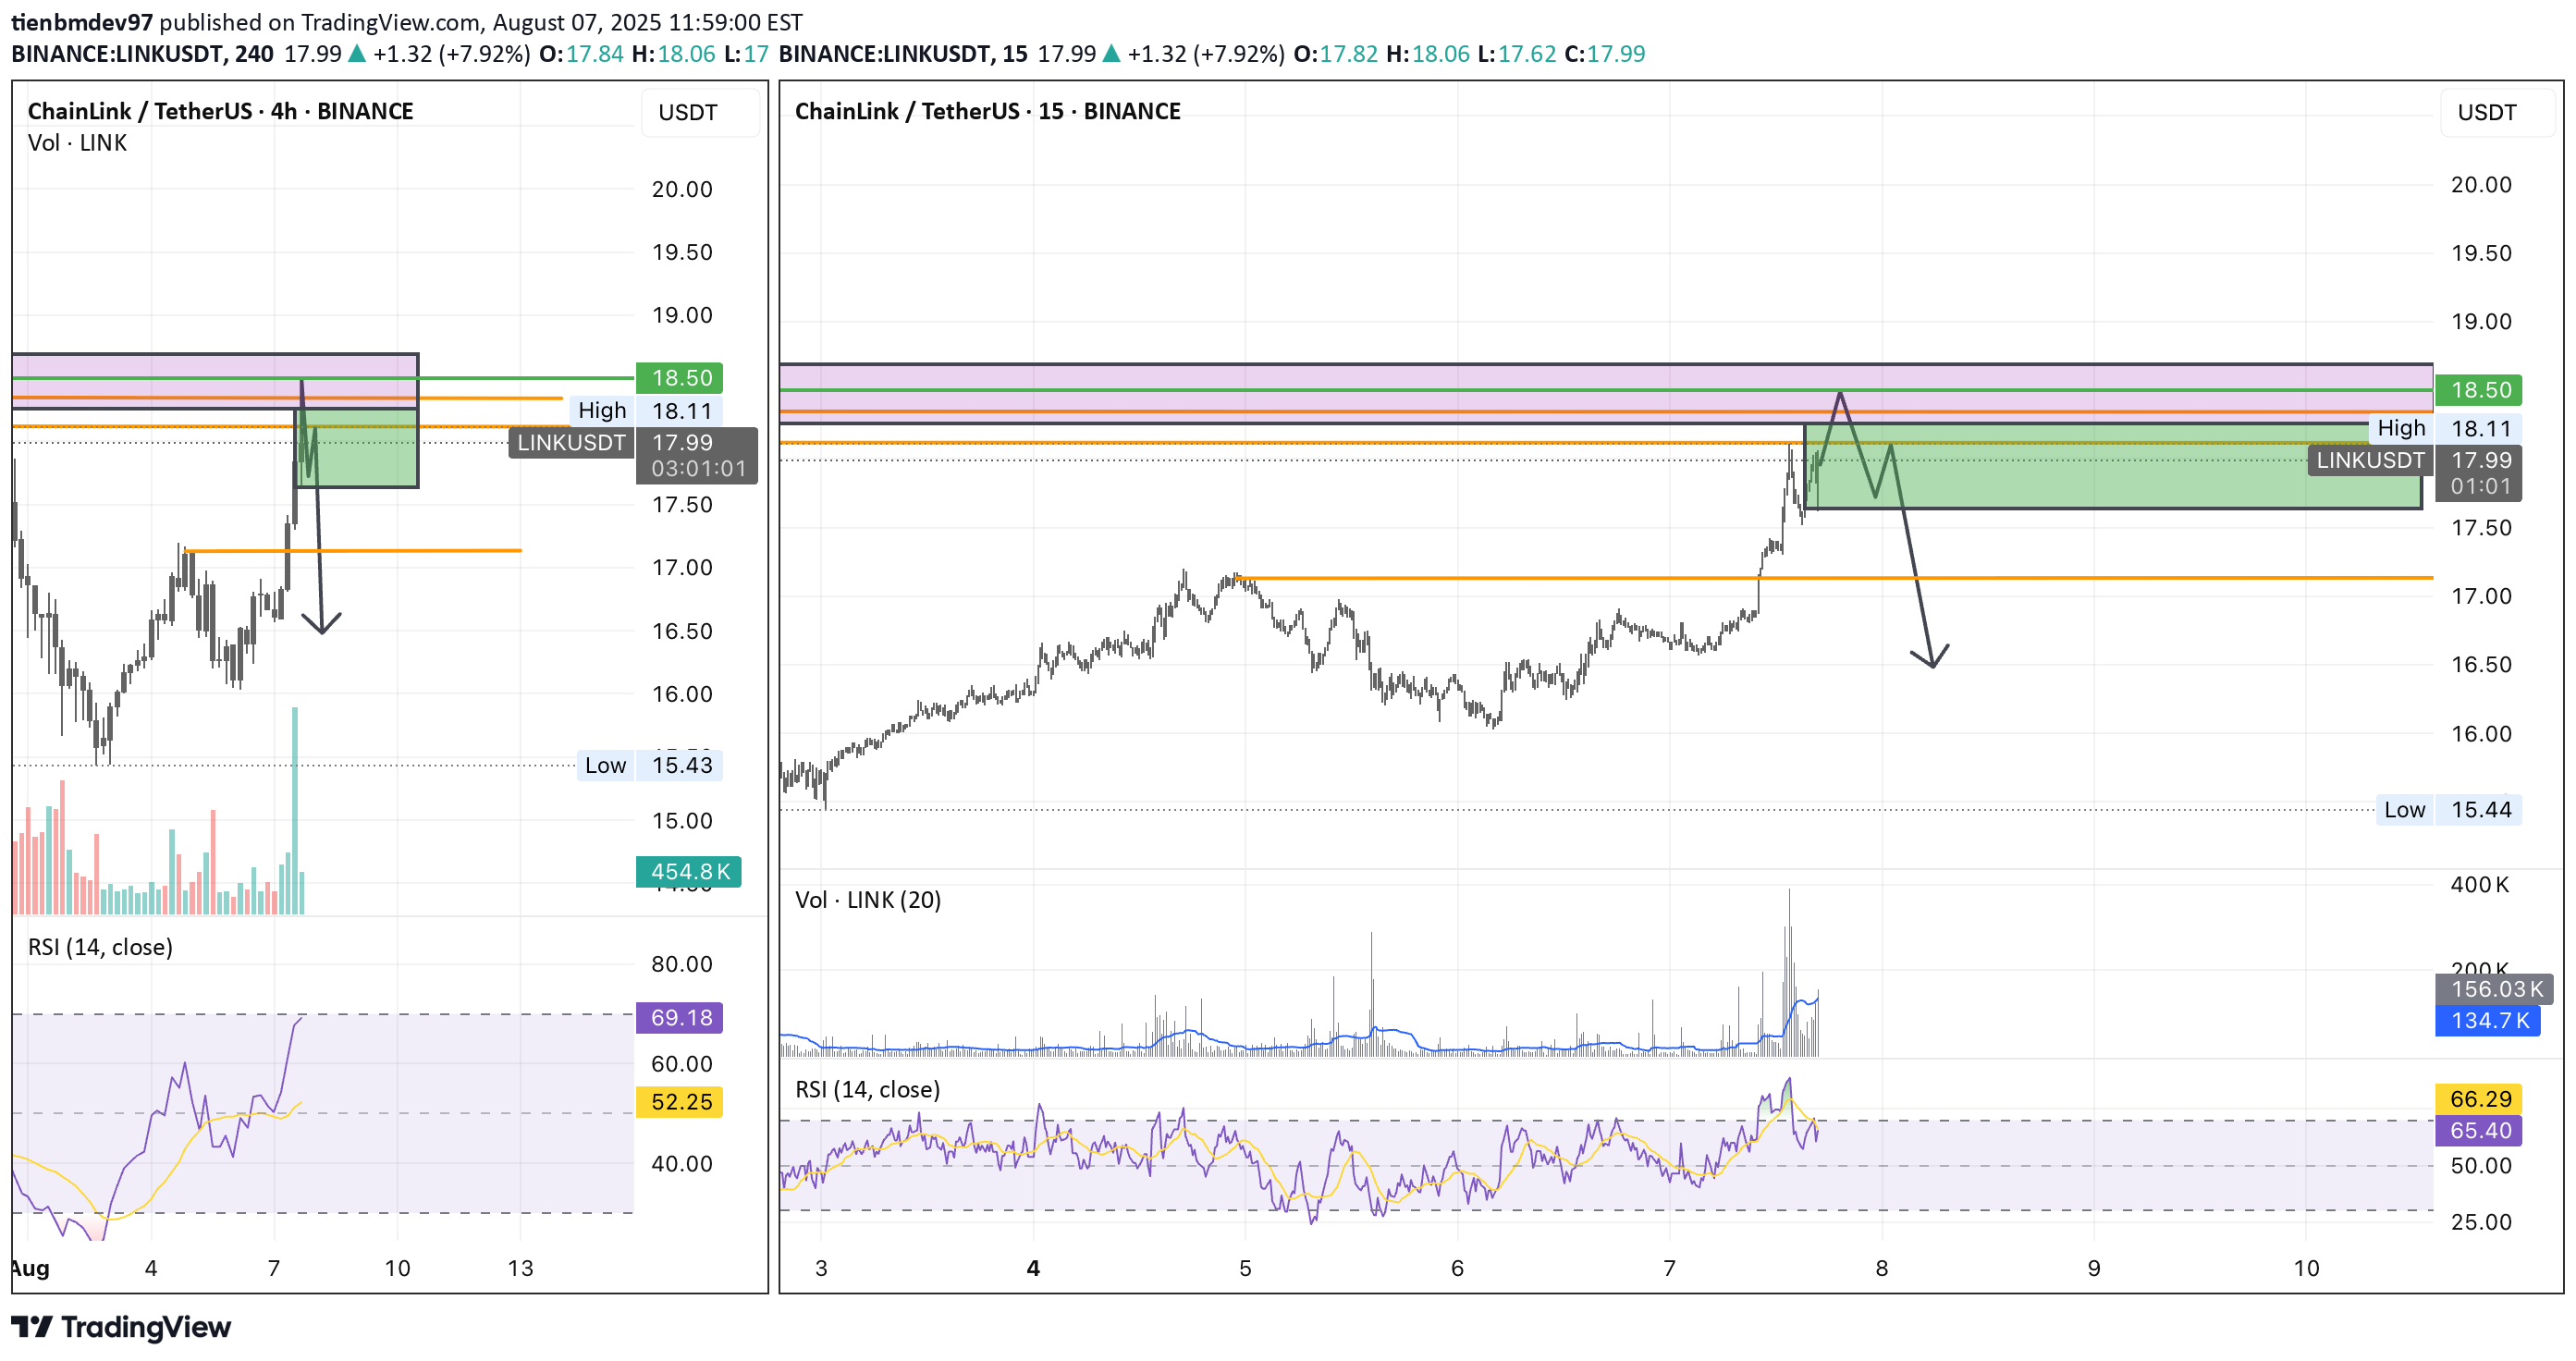
Here’s a detailed trading analysis for your SHORT setup on LINK/USDT based on the chart: 🔍 Chart Context Pair: ChainLink / USDT Exchange: Binance Timeframes: 4H (left) and 15m (right) Current Price: ~$18.05 Short Bias: Bearish reaction expected from supply zone 🔲 Key Zones & Levels 🔼 Resistance / Supply Zone $18.11 - $18.50 (highlighted in purple box) Price reacted sharply on first touch → signs of sell pressure. Confluence: Previous highs Psychological resistance near $18.50 🔽 Support / Target Zone $17.05 - $16.50 (marked by orange and green box levels) Prior consolidation and demand area First strong reaction expected around $17.10–$17.20 🧭 Trade Idea (SHORT) 🎯 Entry Area: $18.05–$18.50 (preferably near the top of the purple box) Confirmation: 15m or 1h bearish engulfing or liquidity sweep + reversal ⛔️ Stop Loss Above $18.60 Reason: Above the wick and supply zone, avoiding stop hunt 📉 Targets TP1: $17.50 (edge of green box, early profits) TP2: $17.00 (orange support line) TP3: $16.50–$16.00 (final target on full breakdown) 🔧 Technical Indicators RSI (Relative Strength Index) 4H RSI: ~69.74 → nearly overbought 15m RSI: ~66.90 → potential bearish divergence Conclusion: Momentum slowing, ripe for pullback Volume Spike on breakout to $18+ zone → Possible buy climax Declining after → suggests distribution phase 🧠 Probability Triggers ✅ High Confluence for SHORT Strong supply zone Overbought RSI High volume spike + exhaustion Clear FVG (Fair Value Gap) and imbalance below ❌ Short Invalidated If Break & close above $18.60 with volume Consolidation above $18.50 📝 Summary CriteriaDetails BiasSHORT Entry Zone$18.05 – $18.50 Stop LossAbove $18.60 Target Range$17.50 → $17.00 → $16.50 Risk/RewardApprox. 1:2.5 to 1:3.5 Confidence✅ High (Supply zone + RSI + Volume confluence)
tienbmdev97
SHORT BTC
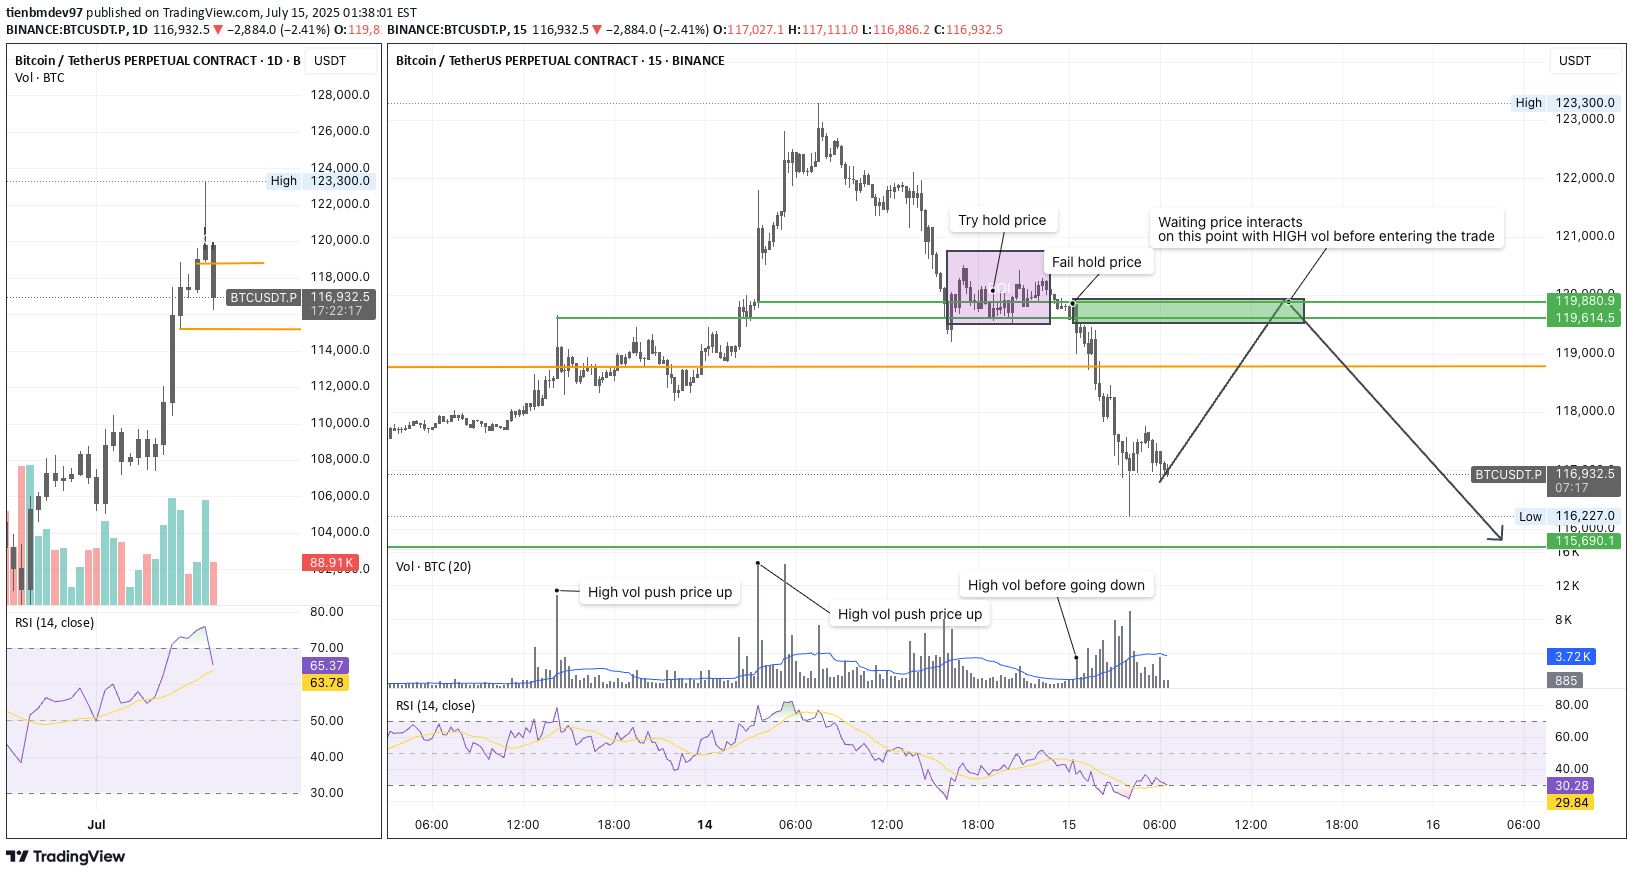
Just follow the description on the chart and waiting it
tienbmdev97
SHORT GOLD

✅ TRADE REVIEW SUMMARY🔎 1. Setup OverviewMarket: XAUUSDTimeframes: Daily (D1) for bias + M15 for entrySetup Type: Bearish setup with expected SFP (Stop Hunt Fakeout) at key resistance zoneStructure: Market is ranging, price is returning to retest key liquidity zone and previous breakdown.📍 2. Key Technical ZonesLevelDescription3,360–3,375Liquidity Zone / Potential SFP trap area3,393Swing high – SL location if trap confirms3,295 / 3,245TP zones – support + volume cluster (POC)✅ These levels align perfectly with volume profile and previous price reaction — smart trap area.🔁 3. Plan Structure (According to FX Dream Trading System)StepActionReference1Wait for price to retest 3,360–3,375 zoneKey Volume zone2Look for trap candle (SFP/Pinbar/Engulf) on M15Trap entry logic3Entry: Sell after confirmed trap + rejectionPA confirmation4SL: Above trap candle (or high: ~3,393)5TP1: ~3,300, TP2: ~3,245Liquidity target (R:3 or more)📉 4. Risk ManagementMaximum risk per trade: 1–2% of capitalMinimum RR: 1:3Accept if SL hits, don’t re-enter same zone unless re-trap happensDo not enter early — wait after trap candle is confirmed!
tienbmdev97
ETH LONG

✅ Trading Setup Summary1. Setup Type:🔹 SFP (Swing Failure Pattern) or Trap at Key Level🔹 Possibly forming a double bottom or liquidity grab at a known support zone.2. Market Context:🔸 Price returns to a previous key level with a volume spike🔸 Likely in a bullish market structure (MS) or forming a reversal after a down move🔸 Entry based on trap logic and session volume confirmation3. Entry Logic:✔ Wait for a stop hunt/SFP at liquidity zone✔ Confirm with volume spike✔ Enter after the rejection/confirmation candle4. Stop Loss:📍 Set just beyond the trap wick (below for long, above for short)🎯 SL is defined and logic-based, not random5. Target (TP):🎯 Use 3–4R reward for intraday/session-based trades🎯 Consider holding for more if Daily timeframe supports a longer move6. Timeframe:🕐 Entry on M15/M5, context from H1/D1📌 Key Strategy Concepts UsedTrap (SFP)Volume confirmationMarket Structure (MS)Key Level (Support/Resistance)Defined SL with good RRSession-based entry (likely Asian session scalp)
tienbmdev97
SHORT BTC

✅ Short Setup Summary – BTCUSDT (15m chart)🧭 1. ContextVolume Profile shows clear value area and Point of Control (POC) between ~104,000–106,000Price is expected to retrace to supply at 106,400 (previous HVN & resistance)Trade plan: Short from 106,400 → down to 100,600 zone📌 Trade Idea Breakdown🔄 Trade Direction: Short🟩 Short Entry Zone: ~106,400🟥 Stop Loss: Above the recent swing high (~107,000+)🎯 Take Profit (TP): 100,600–100,300 (previous demand/liquidity zone)📏 Checklist-Based Analysis✅ 1. Market StructureCurrent short-term structure is bearish (lower highs, lower lows)Plan to enter at pullback into resistance, in-line with the trend📘 Rule: Always trade with MS unless you have a trap or reversal✔️ Structure: Bearish → short pullback is valid⚠️ 2. Key Level (106,400)Acts as supply zone / resistanceAlso lines up with previous POC / volume clusterHigh probability reaction area📘 Rule: Trade from areas where volume or liquidity previously reacted🔻 3. Entry ConfirmationWatch for:Trap wick (SFP) orBearish engulfing / 3-bar reversalOn M15 or M5 before entry📘 Rule: Do not enter blindly — wait for confirmation📊 4. Volume CheckMonitor if volume increases during the test of 106,400Preferably with aggressive sellers stepping in📘 Rule: Volume spike + rejection wick = institutional activity🛡 5. Risk ManagementComponentValue / ZoneEntry~106,400SLAbove 107,000 (last clean high)TP100,600 – 100,300R:RTarget at least 1:3📋 Execution Rules SummaryStepStatusMarket structure bearish✅Supply zone identified✅Entry confirmation seen?🔲 WaitVolume reaction checked?🔲 WaitSL/TP based on structure✅🧠 Final ThoughtsThis is a solid short setup plan with the trend.You’re selling from a liquidity cluster + resistance + supply area — a confluence zone.Just ensure you:Wait for trap confirmation or bearish price actionDon’t jump in early — let price show weakness firstWatch for volume spike confirming rejection at 106,400
tienbmdev97
LONG BTC

✅ Long Setup Summary (BTCUSDT)🧭 1. Daily Timeframe Context (D1)Price is approaching a key low zone at 100,300 – 100,600This is a previous liquidity area, often where large players hunt stop-lossesExpecting a trap or reversal if price sweeps below and quickly recovers📌 Rule: Always check the Daily chart to:Understand current trend biasIdentify if price is at support/resistanceSpot any trap or reversal signals (e.g., engulfing, pin bar, 3-bar reversal)📐 2. Market Structure (M15–H1)Short-term structure is currently bearish (lower highs, lower lows)Trade idea is a counter-trend long, so confirmation is critical📌 Rule:Confirm market structure on M15/H1 before entryCounter-trend trades must have trap confirmation to reduce risk🔻 3. Trap / SFP Confirmation (Key Entry Condition)Watch for price to break below 100,300 (previous low) and reject sharplyLook for a swing failure pattern (SFP) or false breakout wickEntry is valid only if price closes back above the trap zone📌 Rule:Never enter just because price is at supportOnly enter after trap wick + bullish candle confirmation📊 4. Volume ConfirmationLook for a spike in volume at the trap wickConfirms real interest and activity from institutional participants📌 Rule:A proper reversal setup includes price trap + volume confirmationAvoid setups with low or flat volume during the move🎯 5. Entry PlanComponentDetailsBuy Zone100,300 – 100,600EntryAfter confirmation: trap wick + bullish candleStop LossBelow the trap wick (example: 99,800)Take Profit106,400 (prior resistance / supply zone)R:R RatioMinimum 1:3, depending on execution📌 Rule:SL must be based on trap invalidation, not random distanceTP should be at the next key structure, not a fixed pip target✅ Execution ChecklistStepCheckDaily bias aligns or neutral?✅Market Structure reviewed?✅Trap / SFP occurred?🔲Volume spike confirmed?🔲Bullish PA confirmation?🔲SL placed correctly?✅TP set at logical structure?✅📌 SummaryThis is a high-probability counter-trend long setup from a key liquidity zone.Success depends entirely on:A clean trap/SFP wickVolume spike at the lowBullish price action confirmationWithout these, avoid entering.Stick to the rules, and let the market come to you — don’t force the trade.
tienbmdev97
SHORT BTC

✅ Trading Plan Review (Chart Image You Provided)🧠 Setup SummaryType: Short EntryConcept: Trap + SFP (Swing Failure Pattern) at a Key Supply LevelVolume Reaction: Confirmed by high-volume candle (likely from session open)Entry Point: After price sweeps previous high and sharply rejects (fake breakout)SL (Stop Loss): Placed above the swing high / trap wickTP (Take Profit): Risk:Reward approx. 1:3, but not visually tagged on structure📌 Evaluation Based on Trading Rules✅ 1. Market Structure (MS)❓Missing: You did not clarify higher-timeframe MS (H1/H4/D1).Rule: Always analyze Market Structure from top-down (D1 → H4 → M15) to confirm if you're trading with the trend or taking a reversal.✅ Fix Suggestion: Mark clear swing high/low breaks to confirm bearish structure before entering short.✅ 2. Trap/SFP Logic🟢 Your setup shows a clear SFP: price swept liquidity above a prior high, formed a long wick, then closed back inside → classic trap.Rule: Entry must follow a visible trap. The trap defines your SL level. Find SL first, then define the entry.✅ 3. Volume Confirmation🟢 You entered after a strong volume spike. This is ideal when:Price is at a key levelVolume surge occurs during active session (Asia, London, or NY)Rule: Each trading session usually gives one key volume candle — use it for confirmation.✅ 4. Risk Management✅ SL placement is precise (above the trap wick) — this is a valid structural SL, not a random buffer.Rule: SL must be based on price structure or trap logic, not on fixed pips.⚠️ Areas for ImprovementIssueSuggestion🔸 No bias from Daily chartAnalyze D1 candles (e.g. Engulfing / Inside Bar / 3-bar reversal) to define trend bias🔸 TP level unclearDefine exit by structure (e.g. next swing low, demand zone), not just a fixed R-multiple🔸 No session infoAlways specify which session (Asia, London, NY) to confirm volume context📋 Clean Checklist for Each TradeRead Daily Chart (D1)🔹 Candle pattern? (Engulfing / Inside Bar / 3-bar reversal)🔹 Where is price? At resistance/support?Market Structure (H1/M15)🔹 Is structure bullish or bearish?🔹 Are you trading with or against the structure?Trap / SFP🔹 Is there a clean liquidity sweep?🔹 Did price fake out and return?Volume Confirmation🔹 Is there a session-volume candle?🔹 Does volume confirm the trap?Entry / SL / TP✅ Entry after trap wick closes✅ SL above/below wick✅ TP at next support/resistance level or structure swing✅ ConclusionYour trade is well-timed, with a clean trap and good volume confirmation.To improve and fully align with a structured trading approach:Include higher-timeframe bias (via Daily and MS)Define your TP structurally (not just with R)Specify session for volume context
tienbmdev97
Short BTC

1. Daily Bias (D1): SELLD1 in downtrendRSI weak (under 60)Price under resistance (111.9)✅ Bias: SELL confirmed2. Market Structure (M15)Price formed LH-LLCurrent move = pullback to previous supply✅ Structure supports short plan3. Trap / SFP ZoneExpected trap near 107.2Waiting for confirmation before selling✅ Trap setup planned4. Entry & Risk Plan (From Chart)Entry: ~106,378Stop Loss (SL): 107,276Take Profit (TP): 103,399Reward/Risk (R:R): ≈ 3:1✅ Logical levels✅ Good R:R✅ Entry based on confirmation
tienbmdev97
Short AAVE/USD

AAVE/USDT – Sell Setup1. Daily Bias: SELLDowntrend confirmedRSI breaking downPrice under resistance (282)✅ Valid to look for sell2. Trap / SFPPrice spiked above 253–255 then failedClassic trap (SFP) setup✅ Trap confirmed3. Market Structure (M15)Lower Highs & Lower LowsEntry after pullback✅ Structure supports sell4. SL & TPSL: Above trap high (254.99)TP1: 237.52TP2: 231.53✅ SL & TP are logicalEntry Note:Wait for confirmation (SFP, rejection, M5 signal).❌ Do not use limit order blindly.Summary:Daily Bias: ✅Trap: ✅Structure: ✅SL/TP: ✅—Let me know if you want this version saved or exported!
tienbmdev97
LONG BTC

🧠 Trade Concept Summary – BTC/USDT LONGYou're planning a long entry on pullback to the high-volume demand zone (105.8k – 106k), targeting a breakout toward previous highs.✅ Key Confirmations1. Volume Profile (Key Volume Zone)Strongest POC volume base lies in the 105.8–106.0k zone.This level marks a major accumulation breakout, acting as institutional support.Price returning here is likely a retest = buy opportunity.2. Market StructureD1: Still bullish – series of higher highs / higher lows.M15/H1: After a pullback, price is forming higher lows, confirming trend continuation.3. RSI ConfirmationRSI (D1) around 69 → Overbought but not diverging, meaning momentum remains strong.RSI (M15) has cooled down (~40s), giving room for bounce once price hits demand.
Disclaimer
Any content and materials included in Sahmeto's website and official communication channels are a compilation of personal opinions and analyses and are not binding. They do not constitute any recommendation for buying, selling, entering or exiting the stock market and cryptocurrency market. Also, all news and analyses included in the website and channels are merely republished information from official and unofficial domestic and foreign sources, and it is obvious that users of the said content are responsible for following up and ensuring the authenticity and accuracy of the materials. Therefore, while disclaiming responsibility, it is declared that the responsibility for any decision-making, action, and potential profit and loss in the capital market and cryptocurrency market lies with the trader.