
theeonlydave
@t_theeonlydave

What symbols does the trader recommend buying?
Purchase History
پیام های تریدر
Filter
theeonlydave
سقوط ترامپ و خیزش انفجاری: راز الگوی صعودی پنهان در نمودار خطی!
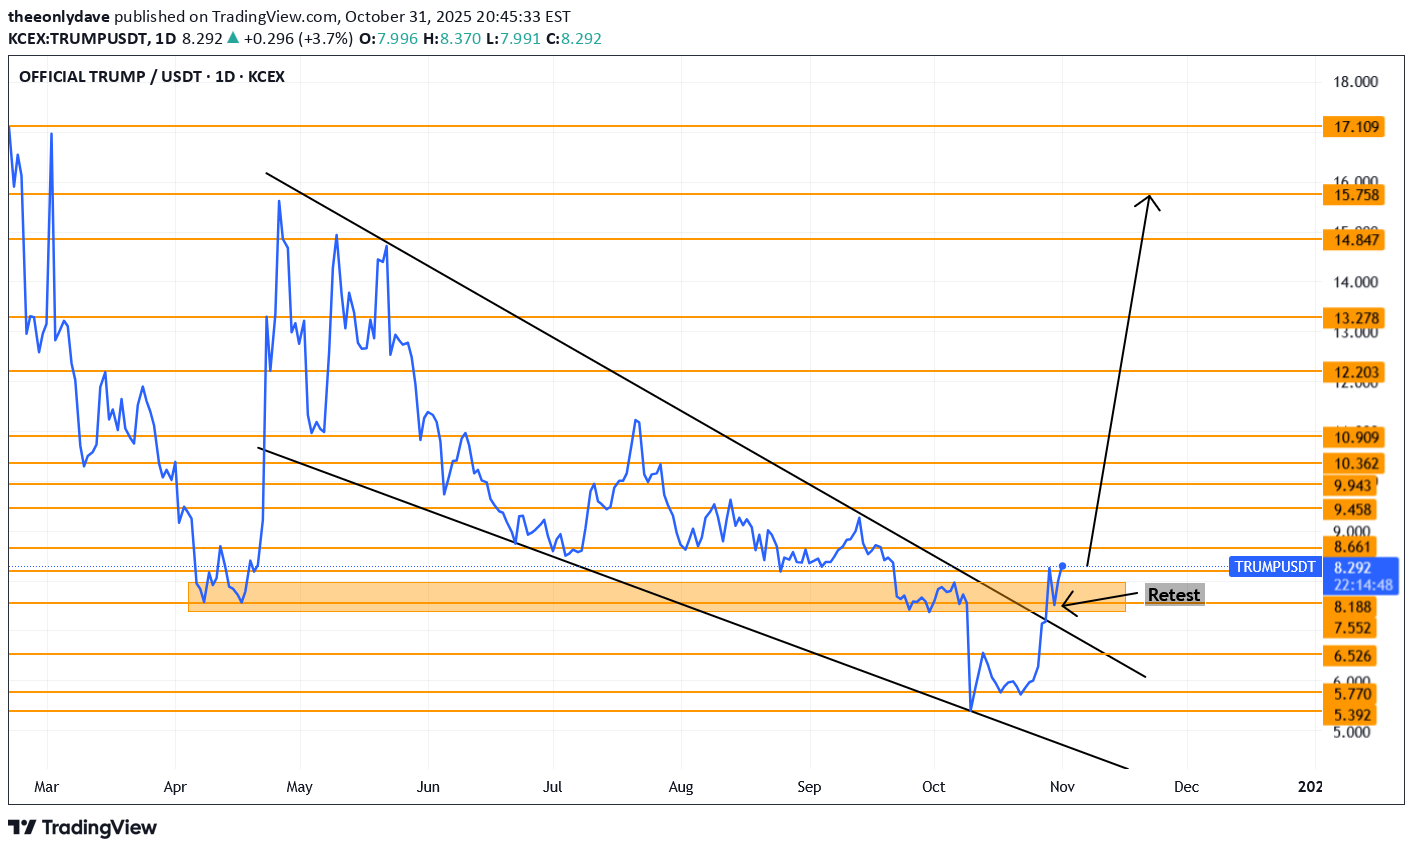
TRUMP had a huge fall which it recovered from almost immediately by starting a bullish move upwards. When you switch from candle stick mode to line chart, you are able to eliminate the noise of the wick and there after see the bullish wedge pattern that has been formed. There was a clear retest at 8.188 and one can take there but position now and set their take profit to 15.758.
theeonlydave
فرصت خرید طلا: استراتژی ورود، حد ضرر و سود در قیمتهای کلیدی!
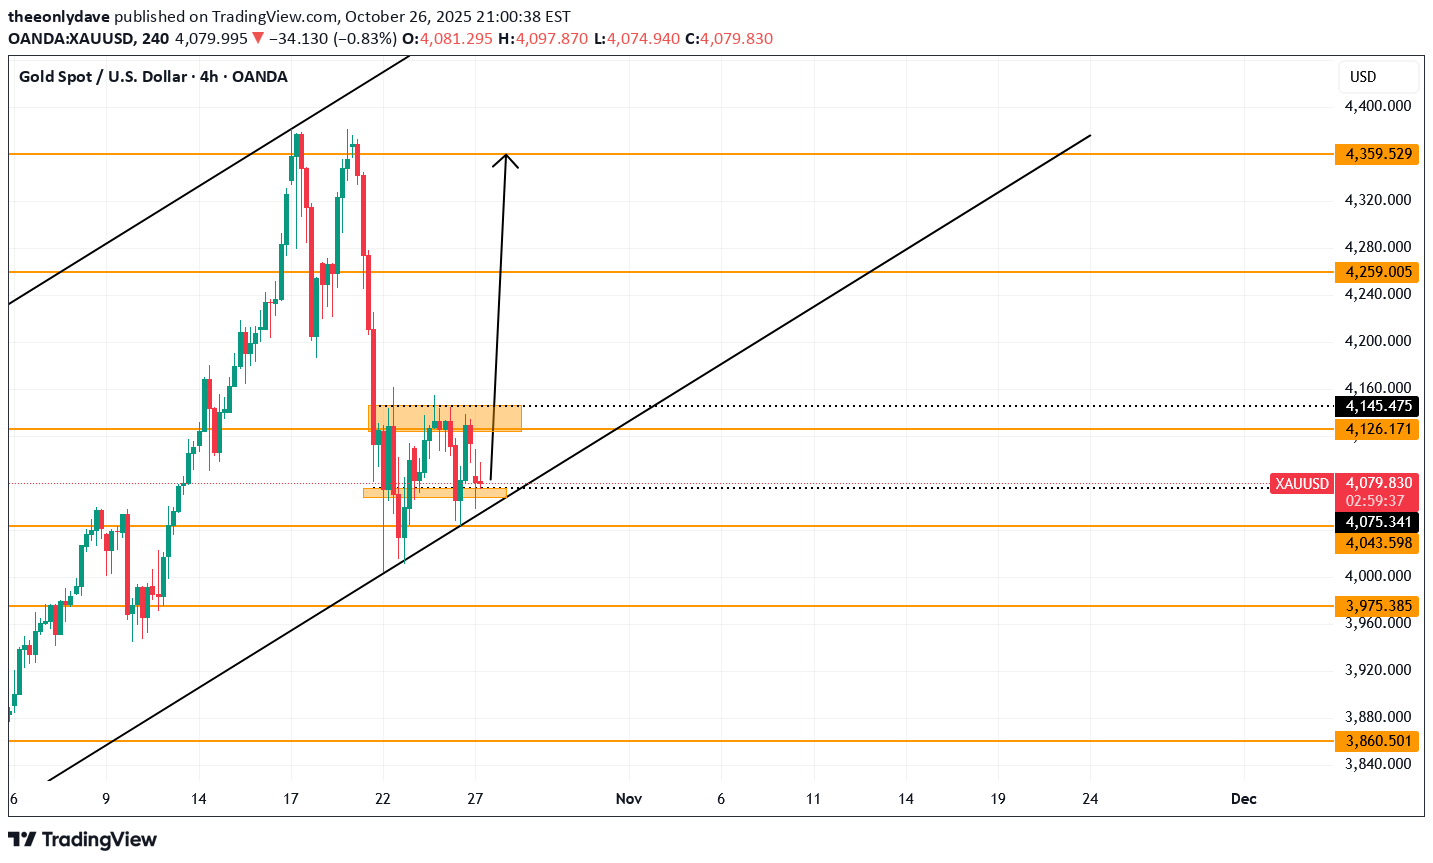
Gold seems to have formed a W pattern and the best entry would have been at 4075.341 but and it can still be taken currently for an aggressive trader or wait until 4145.475 and take your buy as price continues upwards. The take profit is 4359.529 and the stop loss below 4043.598.
theeonlydave
پیشبینی انفجاری قیمت PEPE: آیا این الگوها آماده صعود هستند؟

PEPE has price form several patterns that all signal a move upward.Such as: - The "bullish pennant" as the major structure. - The "Short formed W" that, is forming as a supporting pattern and ; - Finally the descending channel formed from the first supporting pattern. Directions - Once the candle closes above the diagonal resistance trendine then one can enter a trade to TP1(0.00001144). - Alternatively,hold until price passes TP1,breaks through the diagonal resistance trendline of the major structure until TP2(0.00001969). (Note: this is NFP week and things sometimes play out in a funny manner)
theeonlydave
خرید ریپل (XRP): پیشبینی جهش بزرگ به سمت 4.46 دلار؛ استراتژی ورود برای معاملهگران!

XRP has being moving within a bullish structure and also has a trend in trends of a inverse head & Shoulders within it. There is also a clear retest above the diagonal resistance trend-line, so if the candle closes above the trend-line above the retest point(3.0136) then, we expect a huge move upwards all the way to that take profit which is 4.4636. If you are an aggressive trader, you can enter now.If you are a conservative trader and need an extra confirmation, you can wait until the current candle closes and then enter then.
theeonlydave

theeonlydave
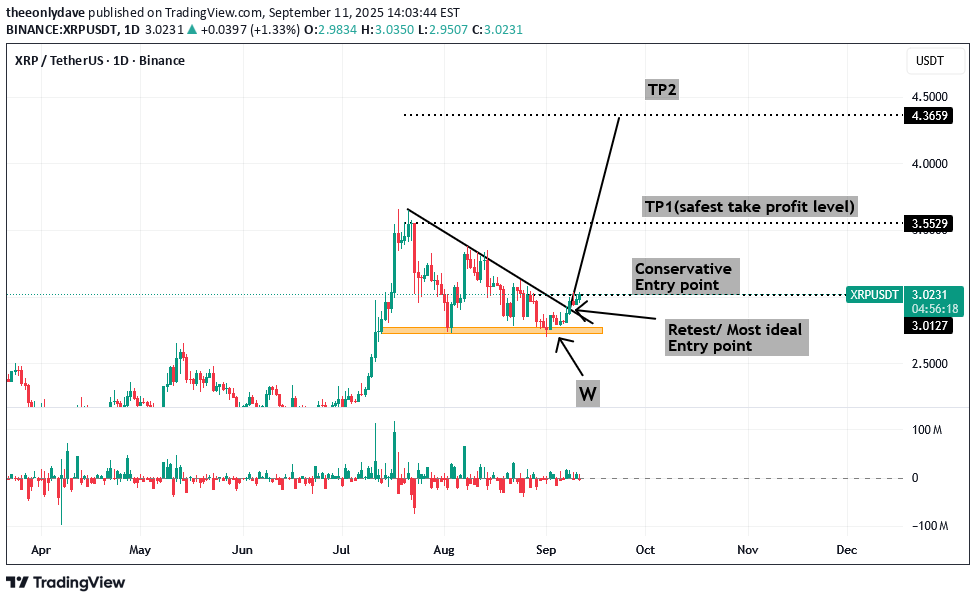
XRP/USD has a clear W formation within a trend in trends where the main structure is a clear bullish structure to the upside. Price has already moved past the ideal point of entry and is at the conservative point(3.0127) which means that your stop loss will be a bit bigger than that which would have been at the ideal point. TP1 is 3.5529 and tp2 is 4.3659
theeonlydave
theeonlydave
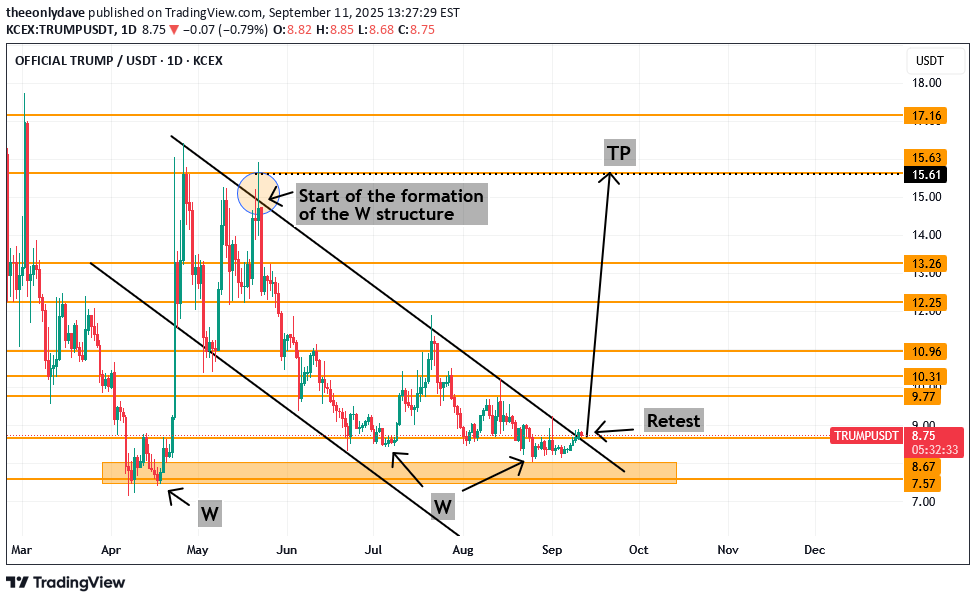
A clear bullish flag is seen as TRUMP/USD has been selling for a while but, there is a trend in trends where there is also a clear W formation visible within the bullish flag and the clear retest at 8.68. which is the ideal point of entry for a BUY. The TP (15.68) is also the point at which the W formation will end and the safest take profit level.
theeonlydave
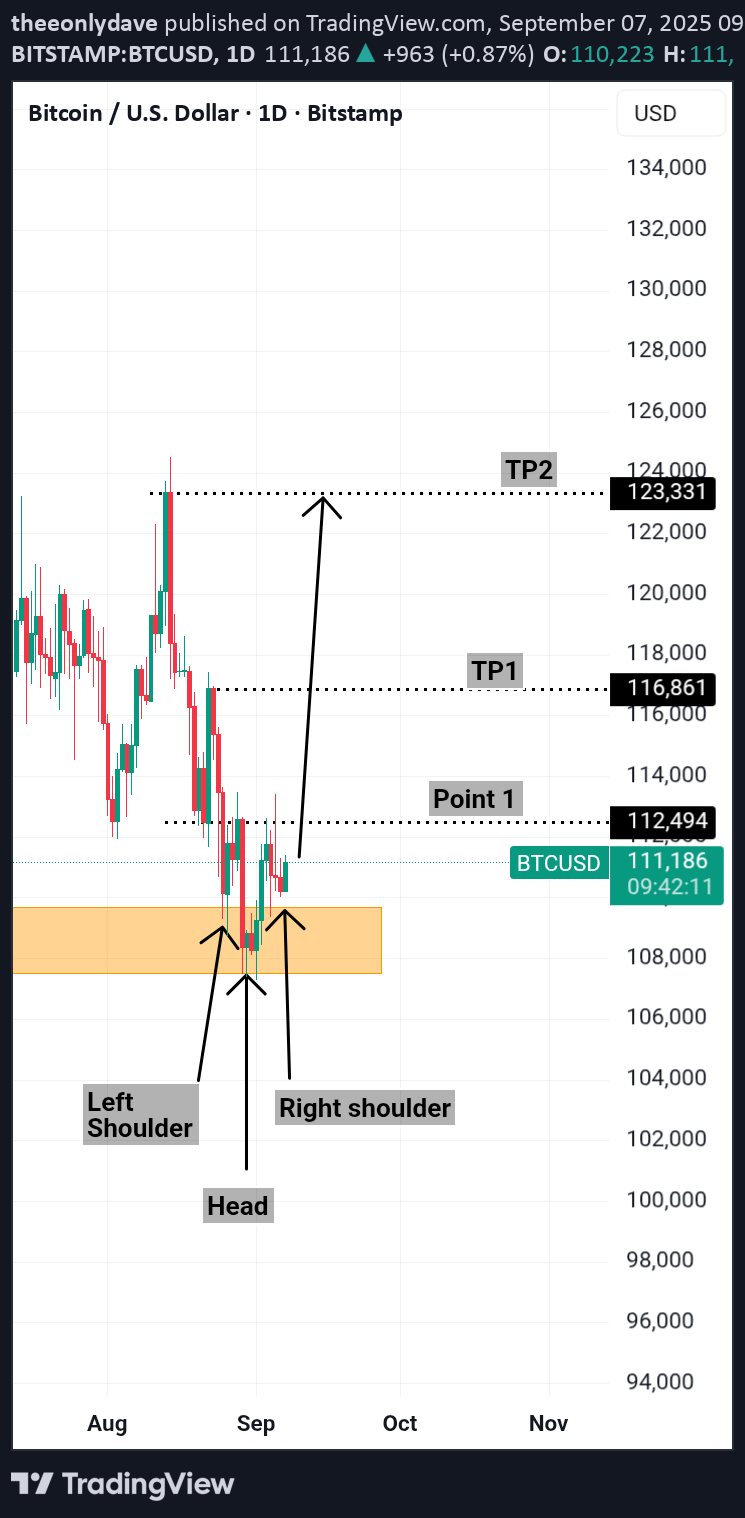
There is a clear inverse head and shoulders (IH&S) with the best entry point for an aggressive trader being right now. But if you are a conservative trader,you can enter at point 1. The safe or obvious TP1 at 116861 and TP2 at 123331
theeonlydave
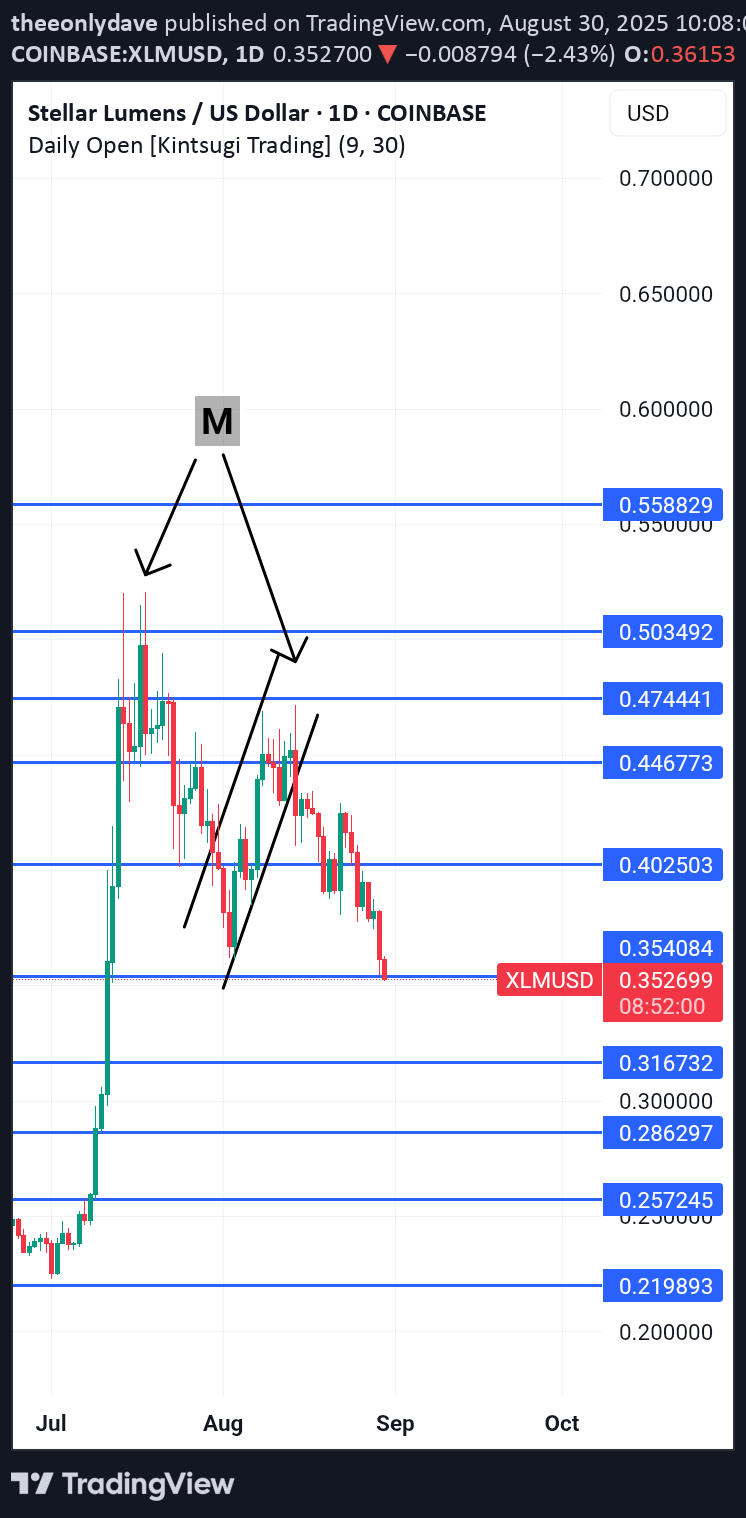
According to my previous analysis that had indicated a massive SELL, we continue to enjoy the movement downwards as we watch out for our ultimate tp to be hit.
Disclaimer
Any content and materials included in Sahmeto's website and official communication channels are a compilation of personal opinions and analyses and are not binding. They do not constitute any recommendation for buying, selling, entering or exiting the stock market and cryptocurrency market. Also, all news and analyses included in the website and channels are merely republished information from official and unofficial domestic and foreign sources, and it is obvious that users of the said content are responsible for following up and ensuring the authenticity and accuracy of the materials. Therefore, while disclaiming responsibility, it is declared that the responsibility for any decision-making, action, and potential profit and loss in the capital market and cryptocurrency market lies with the trader.