
the_paradox
@t_the_paradox

What symbols does the trader recommend buying?
Purchase History
پیام های تریدر
Filter
the_paradox
صعود گاو در طلا: ورود احتیاطی با هدف مقاومت 4 ساعته!
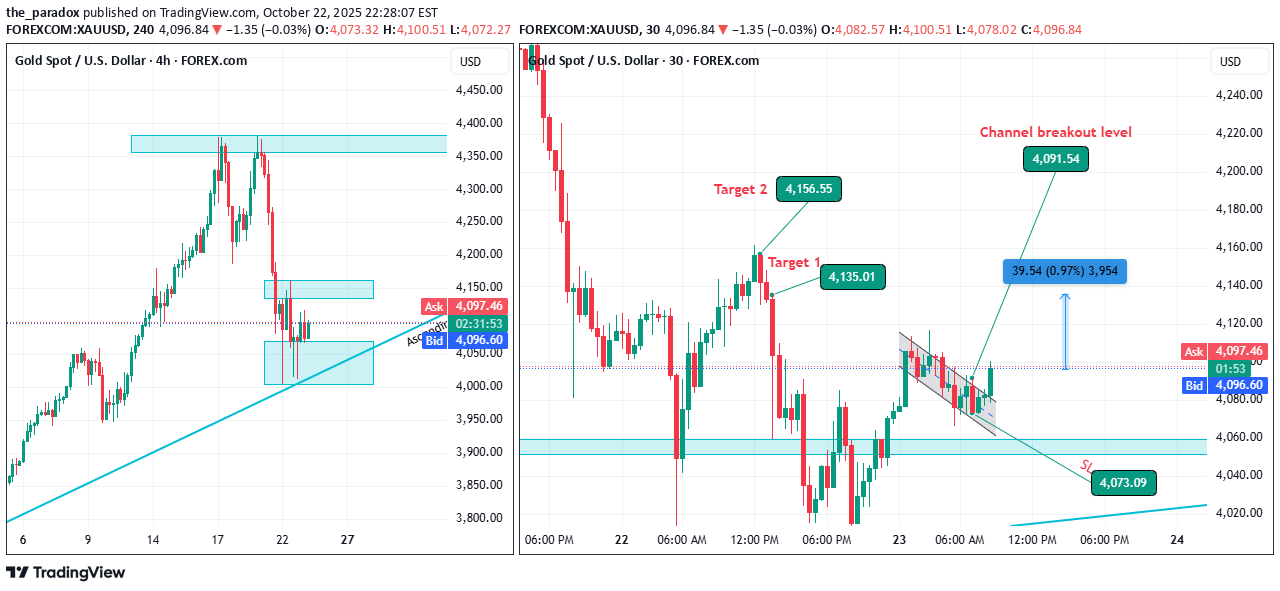
4H is in range bound. the lower timeframe is bull i.e, the market is trying to move up from the lower side of the range bound of 4H. Once the channel breaks out, small bull run can be expected till the 4H resistance. The target and SL details are in the chart. as the market in range bound in 4H, so the bull trade must be made with caution, have a tight SL.channel broketarget 1 hit
the_paradox
Bullish flag re-test | Swing trade

At 4H timeframe the bullish flag patter got a breakout. Now the market is retesting the support 2032. The swing marked in black is a swing now, if a 1H candle closes above 2045.05 then is a indication of impulse of the swing. The target and SL is marked in the chart. Risk: Reward ratio 1:2.73The market went down for the further correction. Lets wait for the level 2045.05 to break in 1H time frame.
the_paradox
Falling wedge | Bullish Flag | Swing | Trend line

Gold weekly is in bull(Impulse wave already in move). 4H timeframe :: There is falling wedge pattern Falling Wedge :: TP : 2091.10 SL : 2013.39 D timeframe :: There is a swing and bullish flag. bullish flag :: TP : 2166.70 SL : 2013.39 Swing :: TP : 2133.75 SL : 2013.39 The CMP has taken support of 4H ascending trend line pattern.
the_paradox
Inverted H&S pattern | Bulls in the market

Daily time frame has swing breakout and Inverted H&S pattern as well. the Inverted H&S pattern has 1:1.69 as risk reward ratio.
the_paradox
Bull trend in gold

hi traders, The current swing of the XAUUSD in daily time frame got delicious risk: reward ratio. If the 4H candle closes above 2041.29, the impulse wave of the swing starts. SL : 2009.96 Target : 2228.13 Risk : Reward => 1:6.07There is a inverted H&S pattern in Daily time frame. Will post a video on that and link here.
the_paradox
BEAR dominance

The gold is still in the control of the BEARS, now it's in the correction rally. If a 4H candle closes below 1910.35, the BEARS will dominate.
the_paradox
Gold's critical level 1932.14

1932.14 is a critical level in gold, if a daily candle closes below 1932.14 can expect a strong bears in the market. The market can fall up to 1875.37 after daily candles closes below 1932.14.
the_paradox
Double top in daily time frame

hi fellas., The previous descending triangle pattern in 1H time frame SL has hit, which turned out to the DT in daily time frame.Now in daily, if the DT neckline breaks can expect the bears in control to hit level 1890.19.
the_paradox
Descending triangle breakout in 1H

There was a descending triangle breakout, we can expect a gold to fall more by 22 $ further.Have explained on how to trade on the descending triangle pattern as well.Please post your suggestion or feedback or doubts in the comments section & and do support on YouTube as well.:-(
the_paradox
What can we expect next in XAUUSD ?

There is a double top pattern in daily time frame and currently the market price is below the neckline.If the Daily candle closes below the neckline expect a BEARS in gold.The gold can bounce from the support of ascending trend line/support and go for the impulse from thereDaily time frame DT neckline has broke.
Disclaimer
Any content and materials included in Sahmeto's website and official communication channels are a compilation of personal opinions and analyses and are not binding. They do not constitute any recommendation for buying, selling, entering or exiting the stock market and cryptocurrency market. Also, all news and analyses included in the website and channels are merely republished information from official and unofficial domestic and foreign sources, and it is obvious that users of the said content are responsible for following up and ensuring the authenticity and accuracy of the materials. Therefore, while disclaiming responsibility, it is declared that the responsibility for any decision-making, action, and potential profit and loss in the capital market and cryptocurrency market lies with the trader.