
tex071173952
@t_tex071173952

What symbols does the trader recommend buying?
Purchase History
پیام های تریدر
Filter
tex071173952
تحلیل تکنیکال CRCL: سقوط قیمت تا ۸۰ دلار با شکست حمایت حیاتی ۱۱۹ دلار!
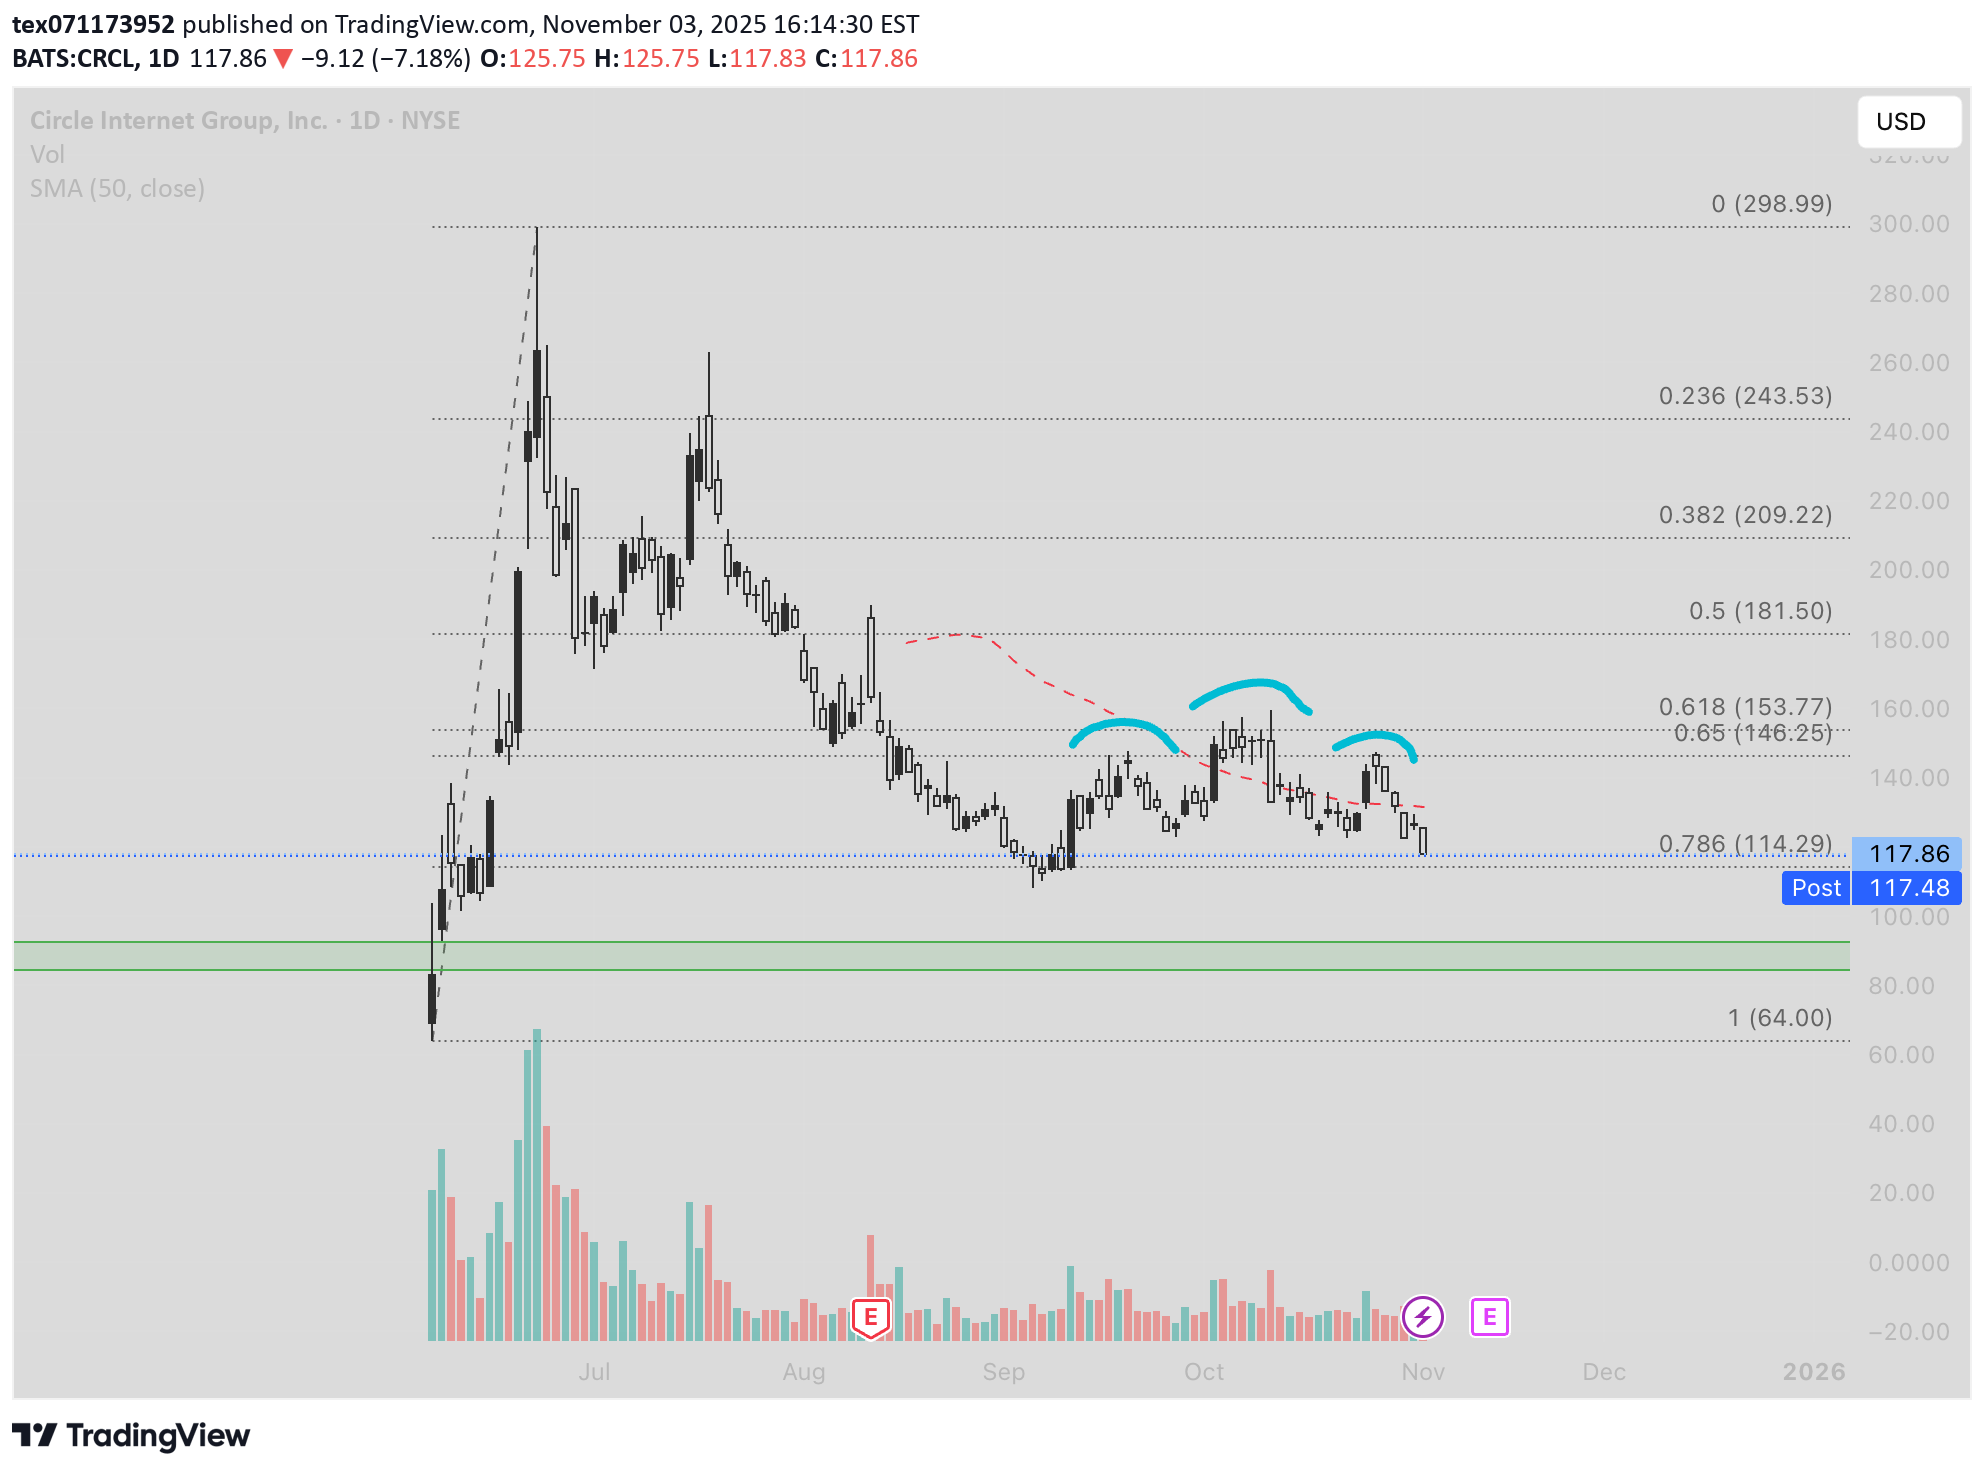
[size=16] CIRC – Bearish Continuation Below 0.786 Support [/size] Analysis based on daily candles. Price continues to form lower highs under the 0.618–0.65 retrace near $150. The structure shows H&S symmetry within a broader downtrend, suggesting continuation rather than reversal. Structure Left Shoulder: early September high Head: October peak near 0.618 Fib (~$154) Right Shoulder: late October lower high (~$135) Neckline support: $119–120 (0.786 Fib) Key Levels Support: 119–114 (neckline / 0.786 Fib) Resistance: 135, 146, 154 Breakdown target: ~$80 zone (measured move) Holding below $119 confirms bearish continuation; reclaiming $135 would soften pressure short term.
tex071173952
تسلای تسلا (TSLA): اندیکاتور RSI از آغاز چرخه صعودی قدرتمند خبر میدهد؛ هنوز به قله نرسیدهایم!
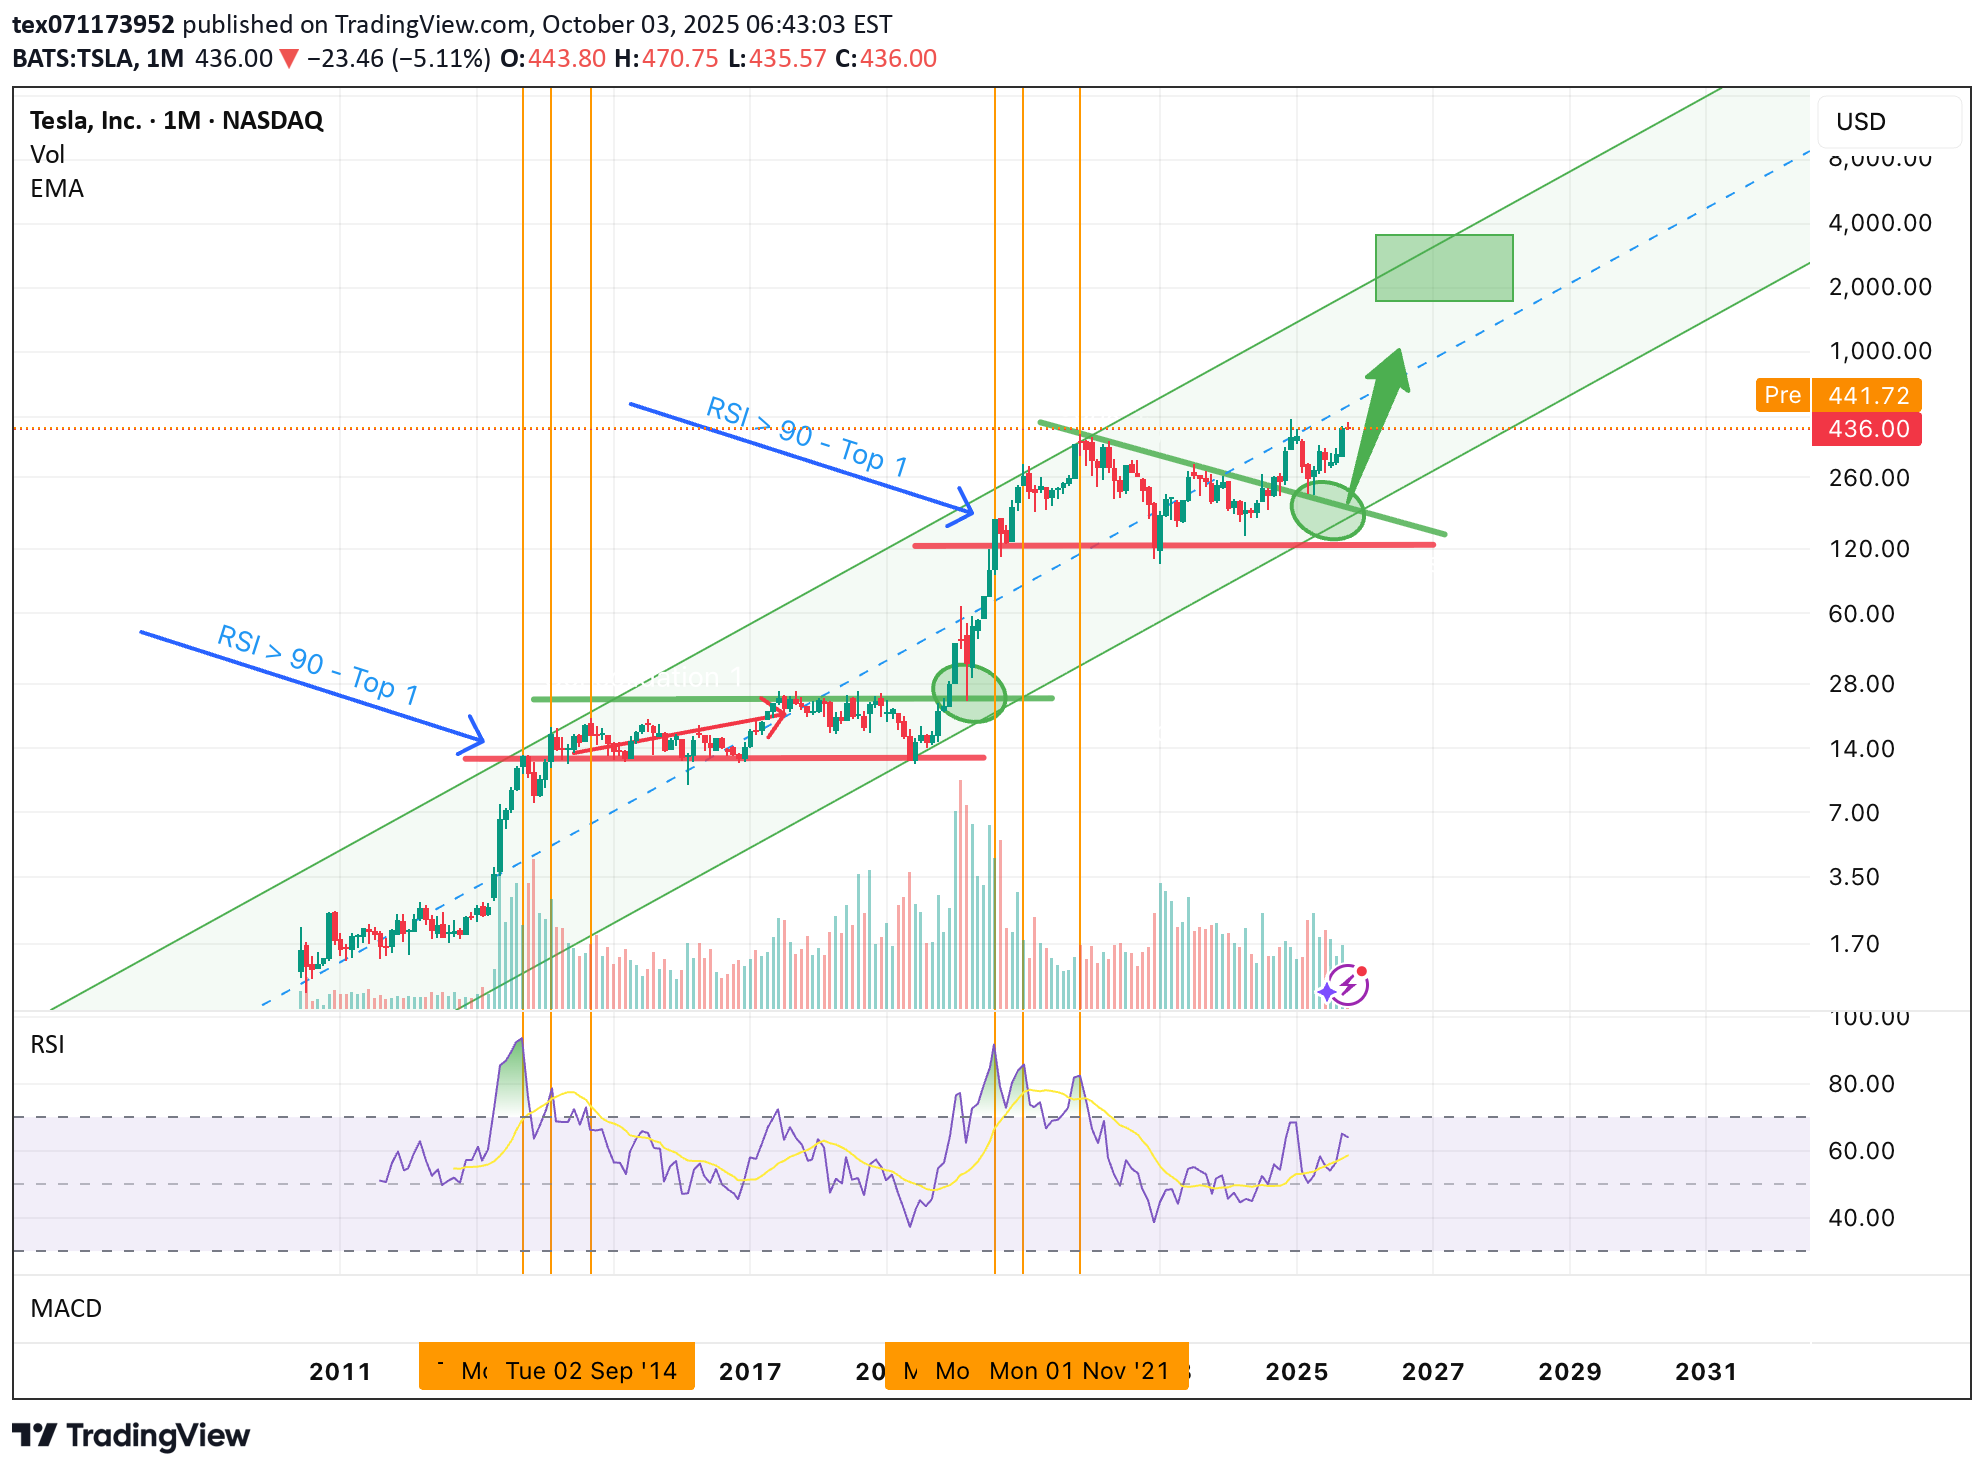
Technical View: Trend intact. Momentum constructive. Cycle still maturing. The RSI roadmap suggests the story is far from over — and the most explosive phase may still lie ahead. Summary: Back in April , we identified the $270–$320 region as a decisive long-term support zone — a confluence of the 0.382–0.5 Fibonacci retracement levels and the lower boundary of Tesla’s decade-long rising channel. That analysis has played out perfectly: TSLA retested this zone, built a solid base, and resumed its uptrend. Today, with the stock trading above $430 and advancing toward the channel median — already within proximity of the next resistance zone around $480–$500 — the most powerful signal comes from momentum rather than price. The monthly RSI tells us something crucial: we are not near a cycle top. In fact, historical patterns suggest Tesla is entering the expansion phase of a new multi-year bull cycle , with much higher prices still ahead. RSI and Market Cycles: What History Tells Us Tesla’s two previous major bull markets — in 2013–2014 and 2019–2021 — followed a remarkably similar script before topping out: The first euphoric peak of each cycle coincided with a monthly RSI above 90 , not in the middle of the channel but as price pushed into — and slightly above — the upper boundary. After that first RSI > 90 event, the stock posted two higher highs with lower RSI peaks , a textbook sign of momentum exhaustion (bearish divergence). The result each time: a sharp correction of 45–75% . Today, RSI sits near 56 — nowhere close to overbought extremes. This strongly implies that Tesla is still in the mid-cycle expansion stage — a phase historically associated with sustained institutional accumulation, accelerating price gains, and multiple expansion. Even more importantly, if history repeats, RSI > 90 will not occur until price reaches the upper boundary or slightly breaks above it . Based on current channel geometry, that implies a potential first euphoric peak in the $1,200–$1,600 range — far above where the stock trades today. My Prediction and Trade Idea I believe Tesla is now in the second phase of a new multi-year bull cycle, likely playing out over the next 18–30 months . The technical setup — price structure, channel dynamics, and RSI behaviour — all point to continued upside. My base-case roadmap: Near-term: Tesla approaches the $480–$500 resistance area (upper half of the channel) in the coming months. Mid-term: A breakout above $500 could trigger a sustained expansion leg toward $650–$700. Late-cycle: As momentum peaks and RSI nears 90, price could accelerate into the $1,200–$1,600 zone — the area historically associated with euphoric tops. For long-term investors and swing traders, the current risk-reward profile remains compelling. As long as Tesla holds above the $320 accumulation zone, the path of least resistance remains higher. Profit Targets and Stop Loss First Target : $480–$500 (upper half of the channel) Second Target : $650–$700 (mid-cycle breakout extension) Third Target : $1,200–$1,600 (historical RSI > 90 / euphoric top zone) Stop-Loss Strategy: A sustained monthly close below $320 would invalidate the mid-cycle thesis and suggest a deeper corrective structure. For traders, this remains the technical “line in the sand.” Risks to Consider While the technical backdrop is bullish, several risks could challenge this thesis: Macro Shifts : Higher-for-longer rates or a global recession could compress growth multiples. Execution Risk : Delays in autonomy, robotics, or the energy business could dampen investor enthusiasm. Valuation Pressure : Tesla’s premium valuation makes it sensitive to changes in growth expectations. Momentum Signals : If RSI fails to advance significantly during the next leg higher, it may signal internal weakness and an earlier-than-expected cycle peak. Conclusion Tesla’s long-term uptrend remains robust, key support has held, and momentum indicators show we are still early in a powerful new bull cycle. Historical RSI behaviour strongly suggests that the first euphoric phase — where RSI exceeds 90 and a true cycle top begins to form — will occur at much higher levels , likely $1,200–$1,600 . Until then, price action, structure, and momentum all point to continued appreciation. As long as support holds above $320, the base-case scenario is clear: Tesla’s next major move is higher — and the market is still writing the early chapters of this bull cycle .
tex071173952

Hello traders! Let’s dive into a long-term analysis of Tesla (TSLA) on the monthly chart to understand where the stock might be headed next. I’ll walk you through my thought process, focusing on a comparison between the recent correction and a similar setup in 2020, while also analyzing the current correction’s alignment with the triangle formation from the 2021–2024 consolidation. My goal is to help you see the context of this setup and make an informed decision if you’re considering a trade. Step 1: Understanding the Big Picture and Historical Context Tesla has been in a strong uptrend since 2013, as evidenced by the ascending channel (highlighted in blue). This channel has guided the stock’s long-term trajectory, with the lower trendline providing support during pullbacks and the upper trendline acting as resistance during peaks. Within this uptrend, Tesla has experienced significant breakouts followed by corrections, and I’ve identified a compelling similarity between the current price action and a setup from 2020, alongside a key technical level from the recent consolidation. Step 2: Comparing the Recent Correction to 2020 In 2020, Tesla consolidated in a range between $12 and $24 (labeled "Consolidation 1" on the chart). It then broke out, rallying to a high of $64.60—a gain of about 169% from the upper end of the consolidation range. Following this breakout, Tesla experienced a sharp pullback, dropping to $23.37, which represents a 63.8% correction from the $64.60 high. After finding support at this level, Tesla resumed its upward trajectory, soaring to $166.71—a 613% increase from the pullback low. Now, let’s look at the current situation: Tesla broke out of "Consolidation 2" (around 2021–2024), rallying from $212.11 to a high of $488.54—a 130% increase. It has since corrected by 51%, dropping to the current price of $239.43. This 51% pullback is slightly less severe than the 63.8% correction in 2020, but the structure is similar: both followed significant breakouts from consolidation zones. Step 3: Current Price Action and the Triangle Retest Tesla is currently trading at $239.43, down 55% from its recent high of $488.54. If the correction deepens to around 60%, it would bring the price to approximately $195.42 (calculated as $488.54 × (1 - 0.60) = $195.42), which aligns perfectly with the upper trendline of the triangle formation from "Consolidation 2" and the "Retest support?" zone around $170–$200. This confluence suggests that the current correction could be setting the stage for a significant bounce, just as the 2020 correction did. If this $170–$200 level fails to hold, I’m watching for a deeper pullback to the "Retest support" zone around $138–$150, which aligns with the lower trendline of the ascending channel and has acted as support during previous pullbacks (e.g., in 2023). Step 4: My Prediction and Trade Idea Here’s where I put myself in your shoes: if I were trading Tesla, I’d be watching for a retest of the $170–$200 support zone as a potential buying opportunity, drawing from both the 2020 playbook and the current technical setup. Why? In 2020, Tesla found support at $23.37 after a 63.8% correction, which set the stage for a 613% rally to $166.71. Similarly, a 60% correction now would bring Tesla to the upper trendline of the Consolidation 2 triangle at $170–$200, a level that could act as a springboard for the next leg up. If Tesla holds this support, I expect a move back toward the $300–$339 range, where it faced resistance before the recent drop. A break above $339 could signal a continuation toward $488.54, retesting the recent high. Profit Targets and Stop Loss Entry: Consider buying around $170–$200 if the price retests this support and shows signs of reversal (e.g., a bullish candlestick pattern or increased volume). Profit Target 1: $300 (a conservative target based on recent resistance). Profit Target 2: $339 (a more aggressive target at the prior resistance zone). Stop Loss: Place a stop below $160 to protect against a breakdown of the $170–$200 support zone. This gives the trade a risk-reward ratio of up to 13:1 for the first target. Risks to Consider If Tesla fails to hold the $170–$200 support, we could see a deeper correction toward $138–$150, and potentially even $64–$90, another historical support level. Additionally, keep an eye on broader market conditions, as Tesla is sensitive to macroeconomic factors like interest rates and consumer sentiment in the EV sector. While the 2020 setup and the triangle retest provide a historical and technical parallel, the current 55% drop suggests heightened volatility, so be prepared for potential whipsaws around these key levels. Conclusion Tesla’s recent 55% correction from $488.54 to $239.43 echoes the 63.8% pullback in 2020 after the breakout from "Consolidation 1." If the correction deepens to 60%, it would retest the upper trendline of the Consolidation 2 triangle at $170–$200, suggesting a potential opportunity for a high-probability trade with clear profit targets and a defined stop loss. This setup could mirror the 2020 recovery, where Tesla rallied 613% after finding support. What do you think of this setup? Let me know in the comments—I’d love to hear your thoughts!
Disclaimer
Any content and materials included in Sahmeto's website and official communication channels are a compilation of personal opinions and analyses and are not binding. They do not constitute any recommendation for buying, selling, entering or exiting the stock market and cryptocurrency market. Also, all news and analyses included in the website and channels are merely republished information from official and unofficial domestic and foreign sources, and it is obvious that users of the said content are responsible for following up and ensuring the authenticity and accuracy of the materials. Therefore, while disclaiming responsibility, it is declared that the responsibility for any decision-making, action, and potential profit and loss in the capital market and cryptocurrency market lies with the trader.