
taika808
@t_taika808

What symbols does the trader recommend buying?
Purchase History
پیام های تریدر
Filter
taika808
تابآوری شگفتانگیز بیتتنزور (TAO): آیا آماده جهش بزرگ بعدی است؟
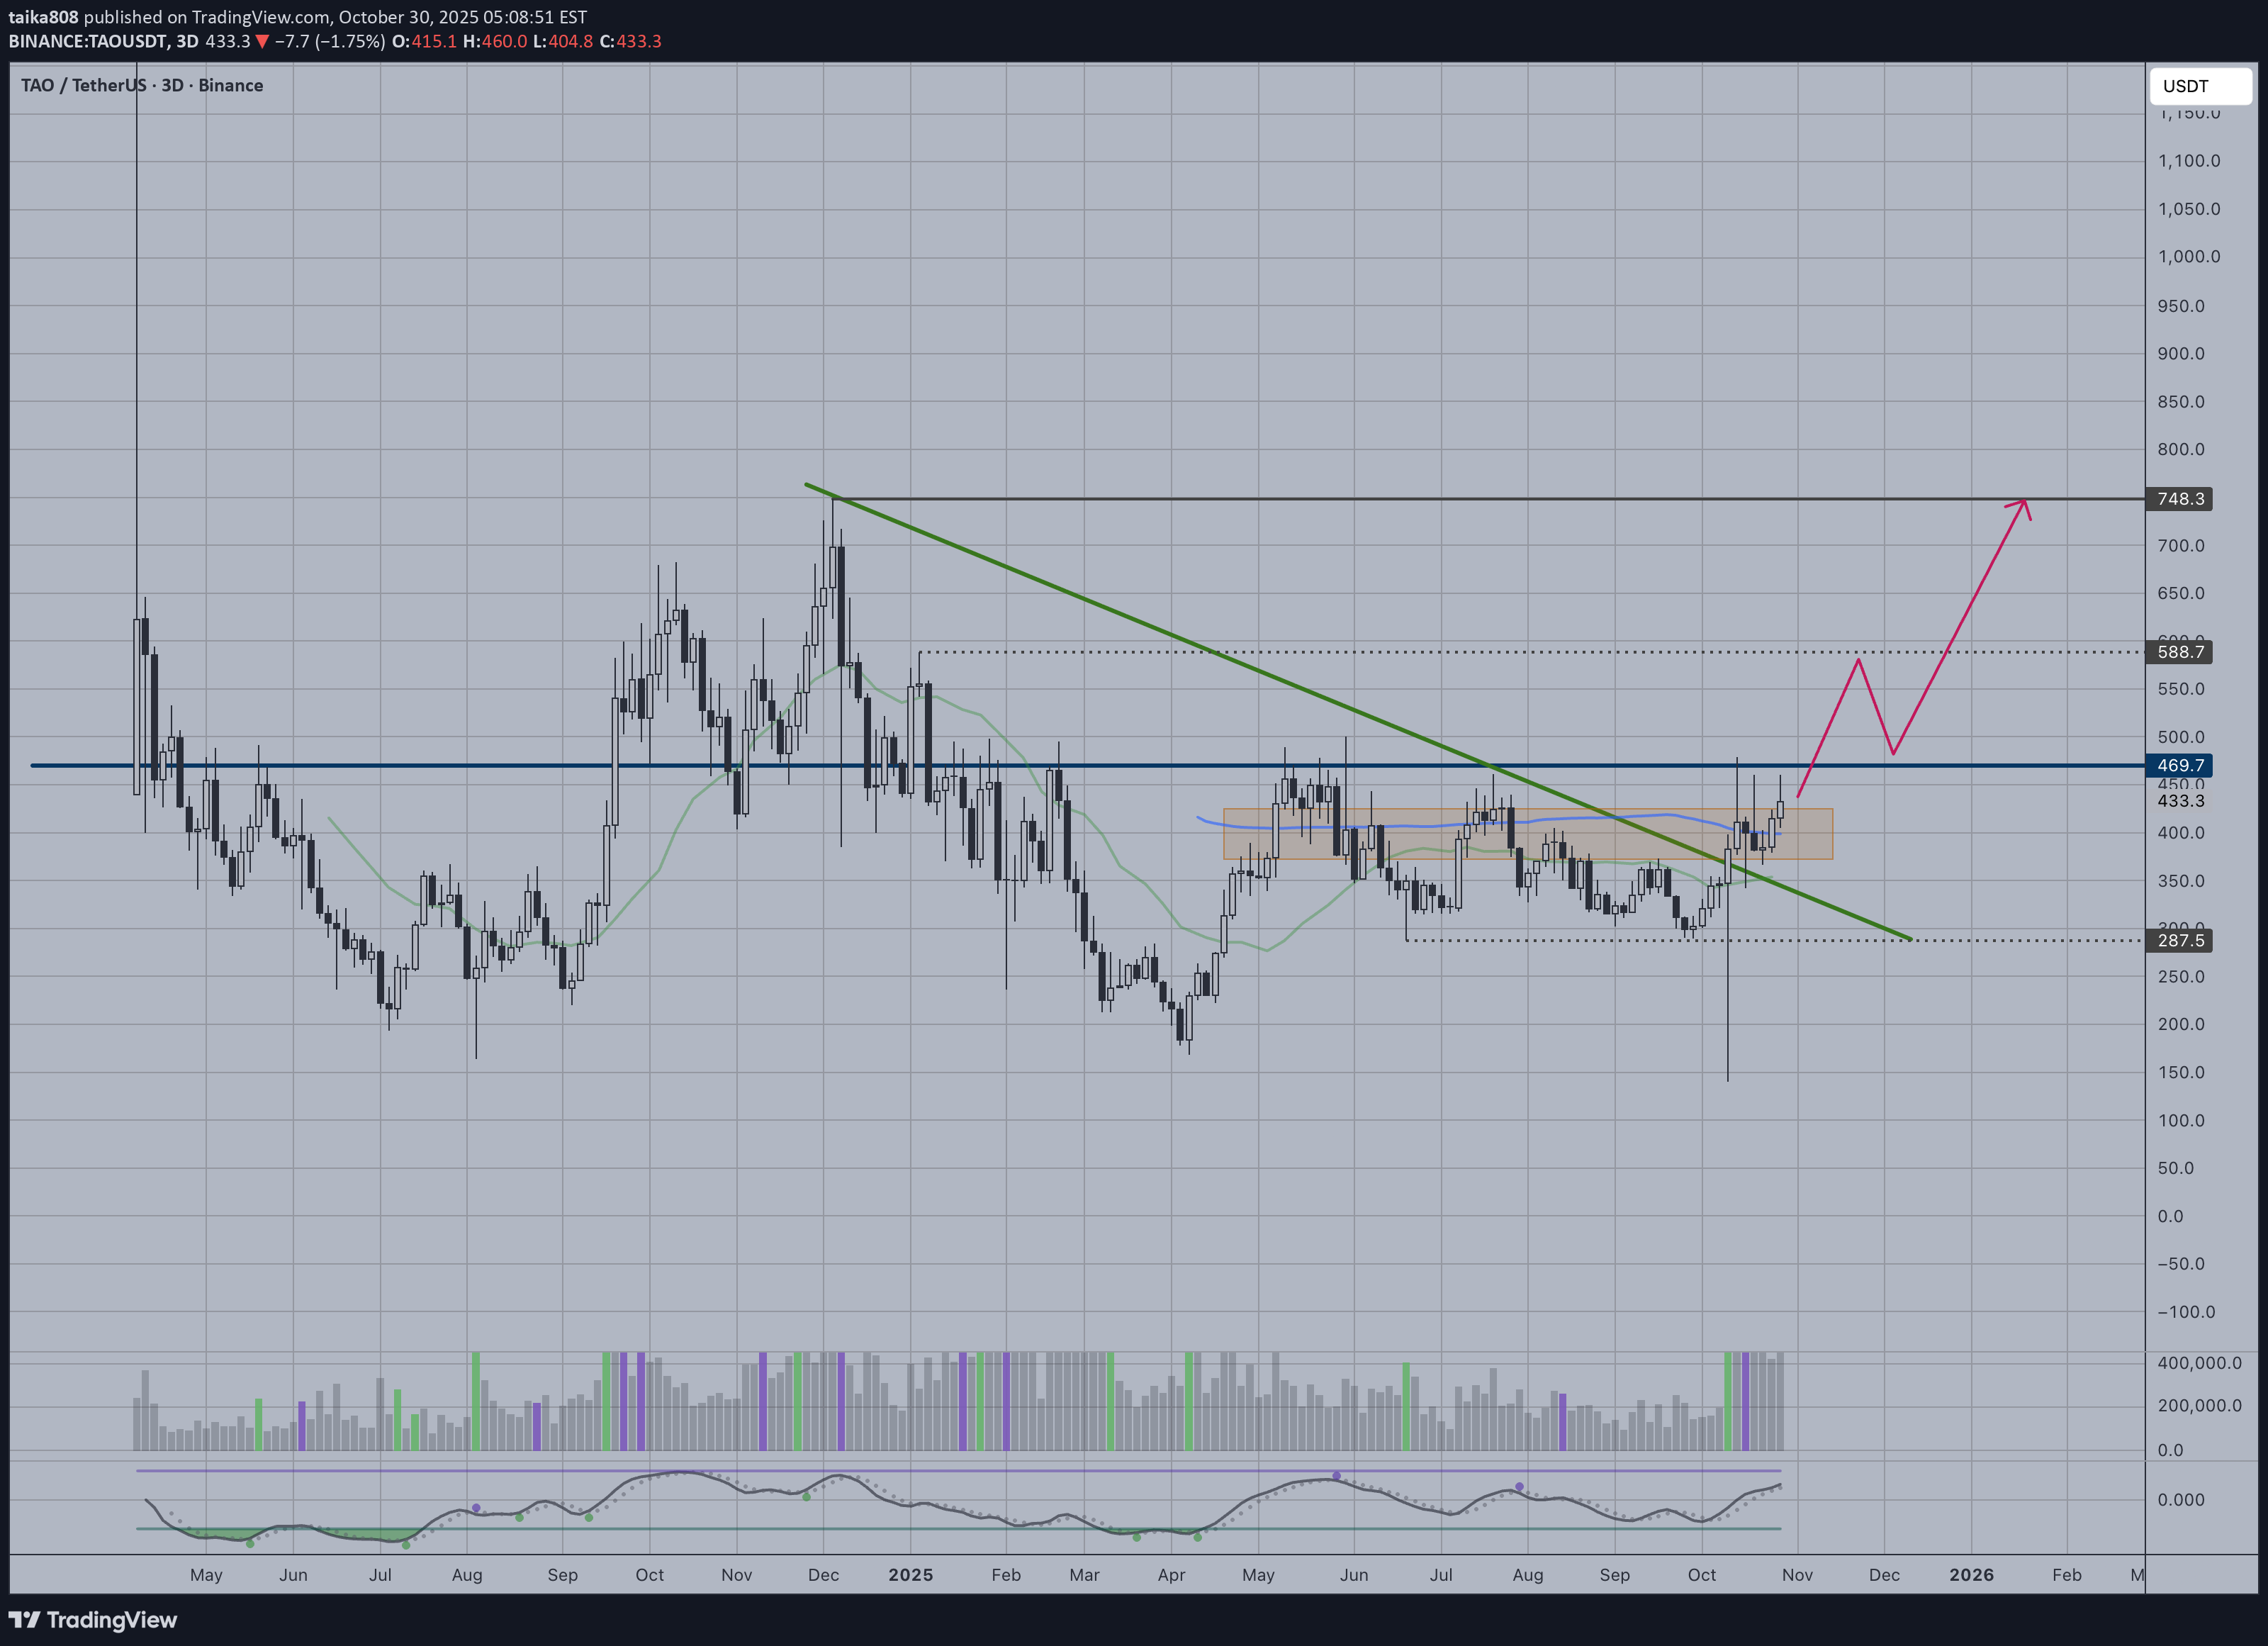
Bittensor is one of the projects which held better during the 10.10 dump. It's now consolidating right below its long-term resistance and has broken out of the diagonal resistance. If macro conditions are favorable, this could do very well. Their ecosystem is also waking up with multiple small-cap tokens on there doing 5-10x gains lately.
taika808
MNT | Up to new Highs
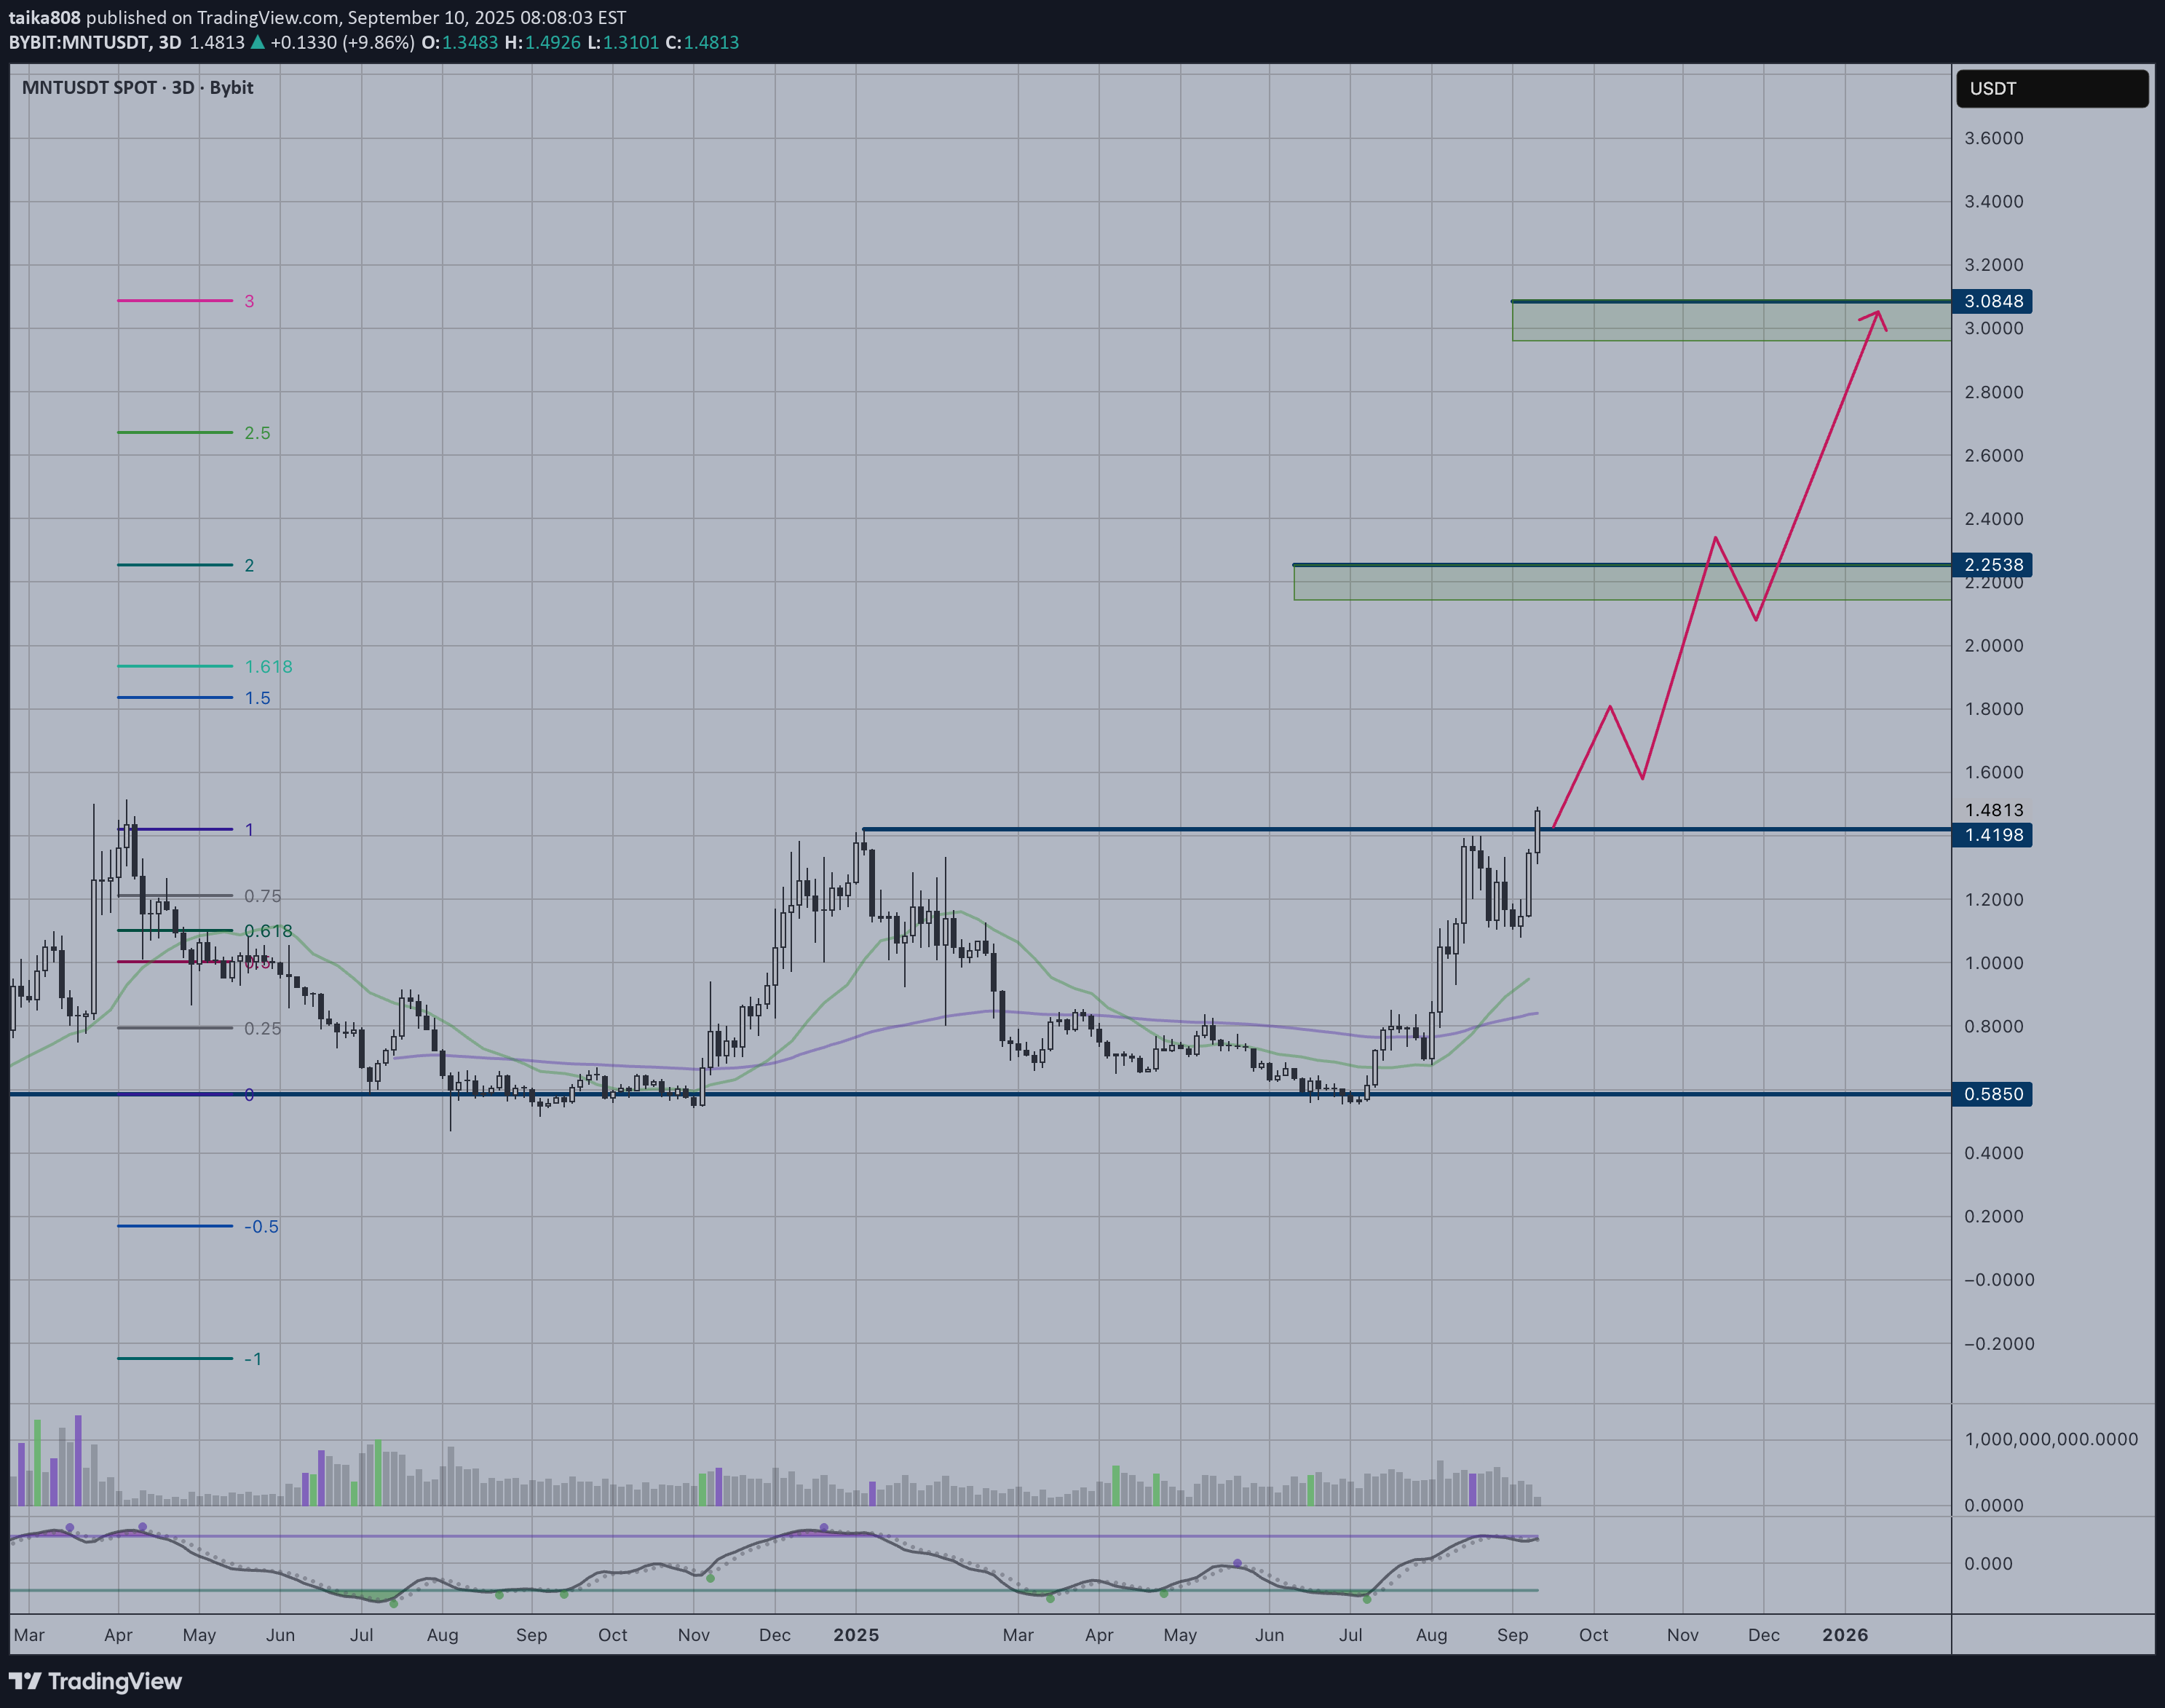
MNTUSDT is experiencing a powerful bullish breakout, pushing toward new all-time highs after a prolonged consolidation period. The price has successfully broken above the key resistance level at $1.41 and is now targeting the upper resistance zones. Key Observations: • Strong momentum following breakout from multi-month accumulation phase • Price trading well above major moving averages, confirming bullish trend • Clear break of previous resistance now acting as support Price Targets: • First resistance: $2.2538 (green zone) • Extended target: $3.0848 (upper green zone) Risk Considerations: • Potential pullback to retest the $1.41 breakout level as new support • Volume confirmation needed to sustain the rally • Overbought conditions may trigger short-term consolidation The projected path shows continued upside momentum, but traders should watch for any signs of exhaustion near the first target zone.
taika808
BONK | Good Entry
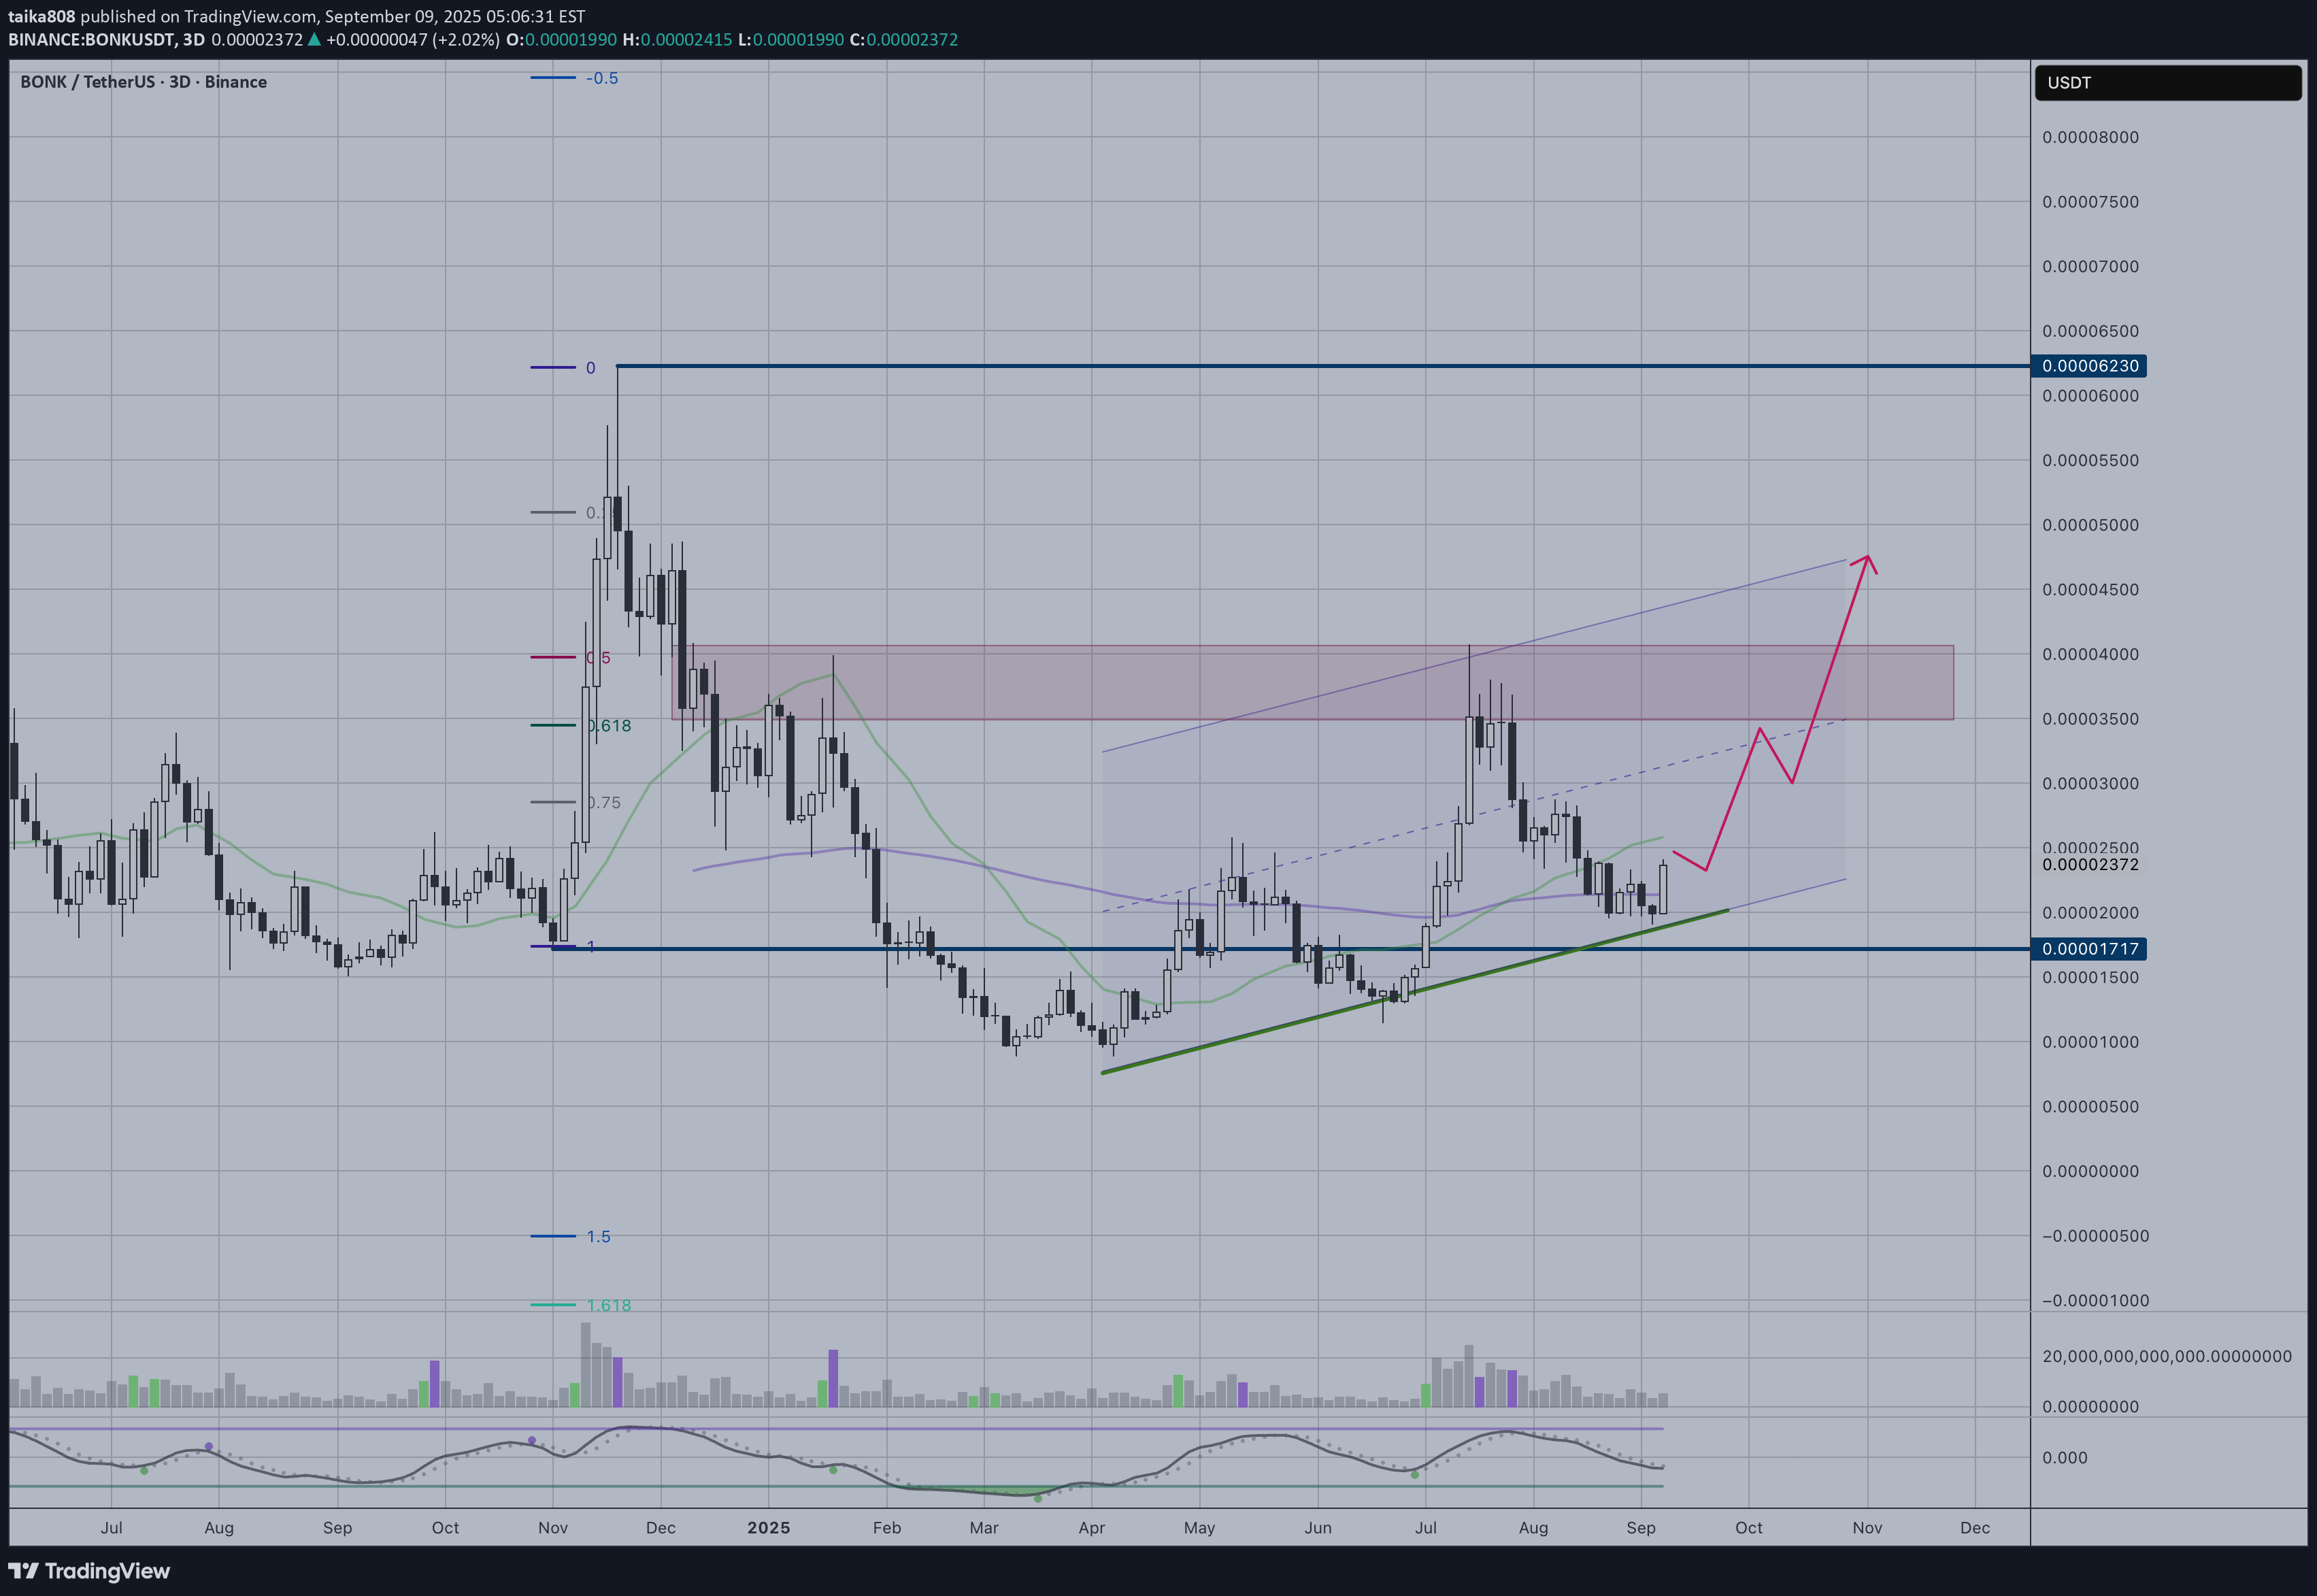
BONK presents a compelling bullish setup on the daily timeframe. The chart shows several positive technical developments: Key Bullish Signals: Currently trading above key moving averages, indicating momentum shift Strong bounce from the lower support zone around 0.000017 Volume confirmation supports the breakout move Entry Strategy: Current levels offer a good entry opportunity around 0.000024 Alternative entry on any pullback to the green trendline support Price Targets: 1st Target: 0.000035 (previous resistance zone) 2nd Target: 0.000040+ (upper resistance area marked in red) Risk Management: Stop loss below 0.000020 to protect against false breakout The projected path (pink arrow) suggests potential for significant upside The technical structure indicates BONK has completed its consolidation phase and could be entering a new bullish cycle. The risk-to-reward ratio appears favorable for long positions, though traders should manage position sizes appropriately given the volatile nature of meme coins.
taika808
ADA | Looking Promising
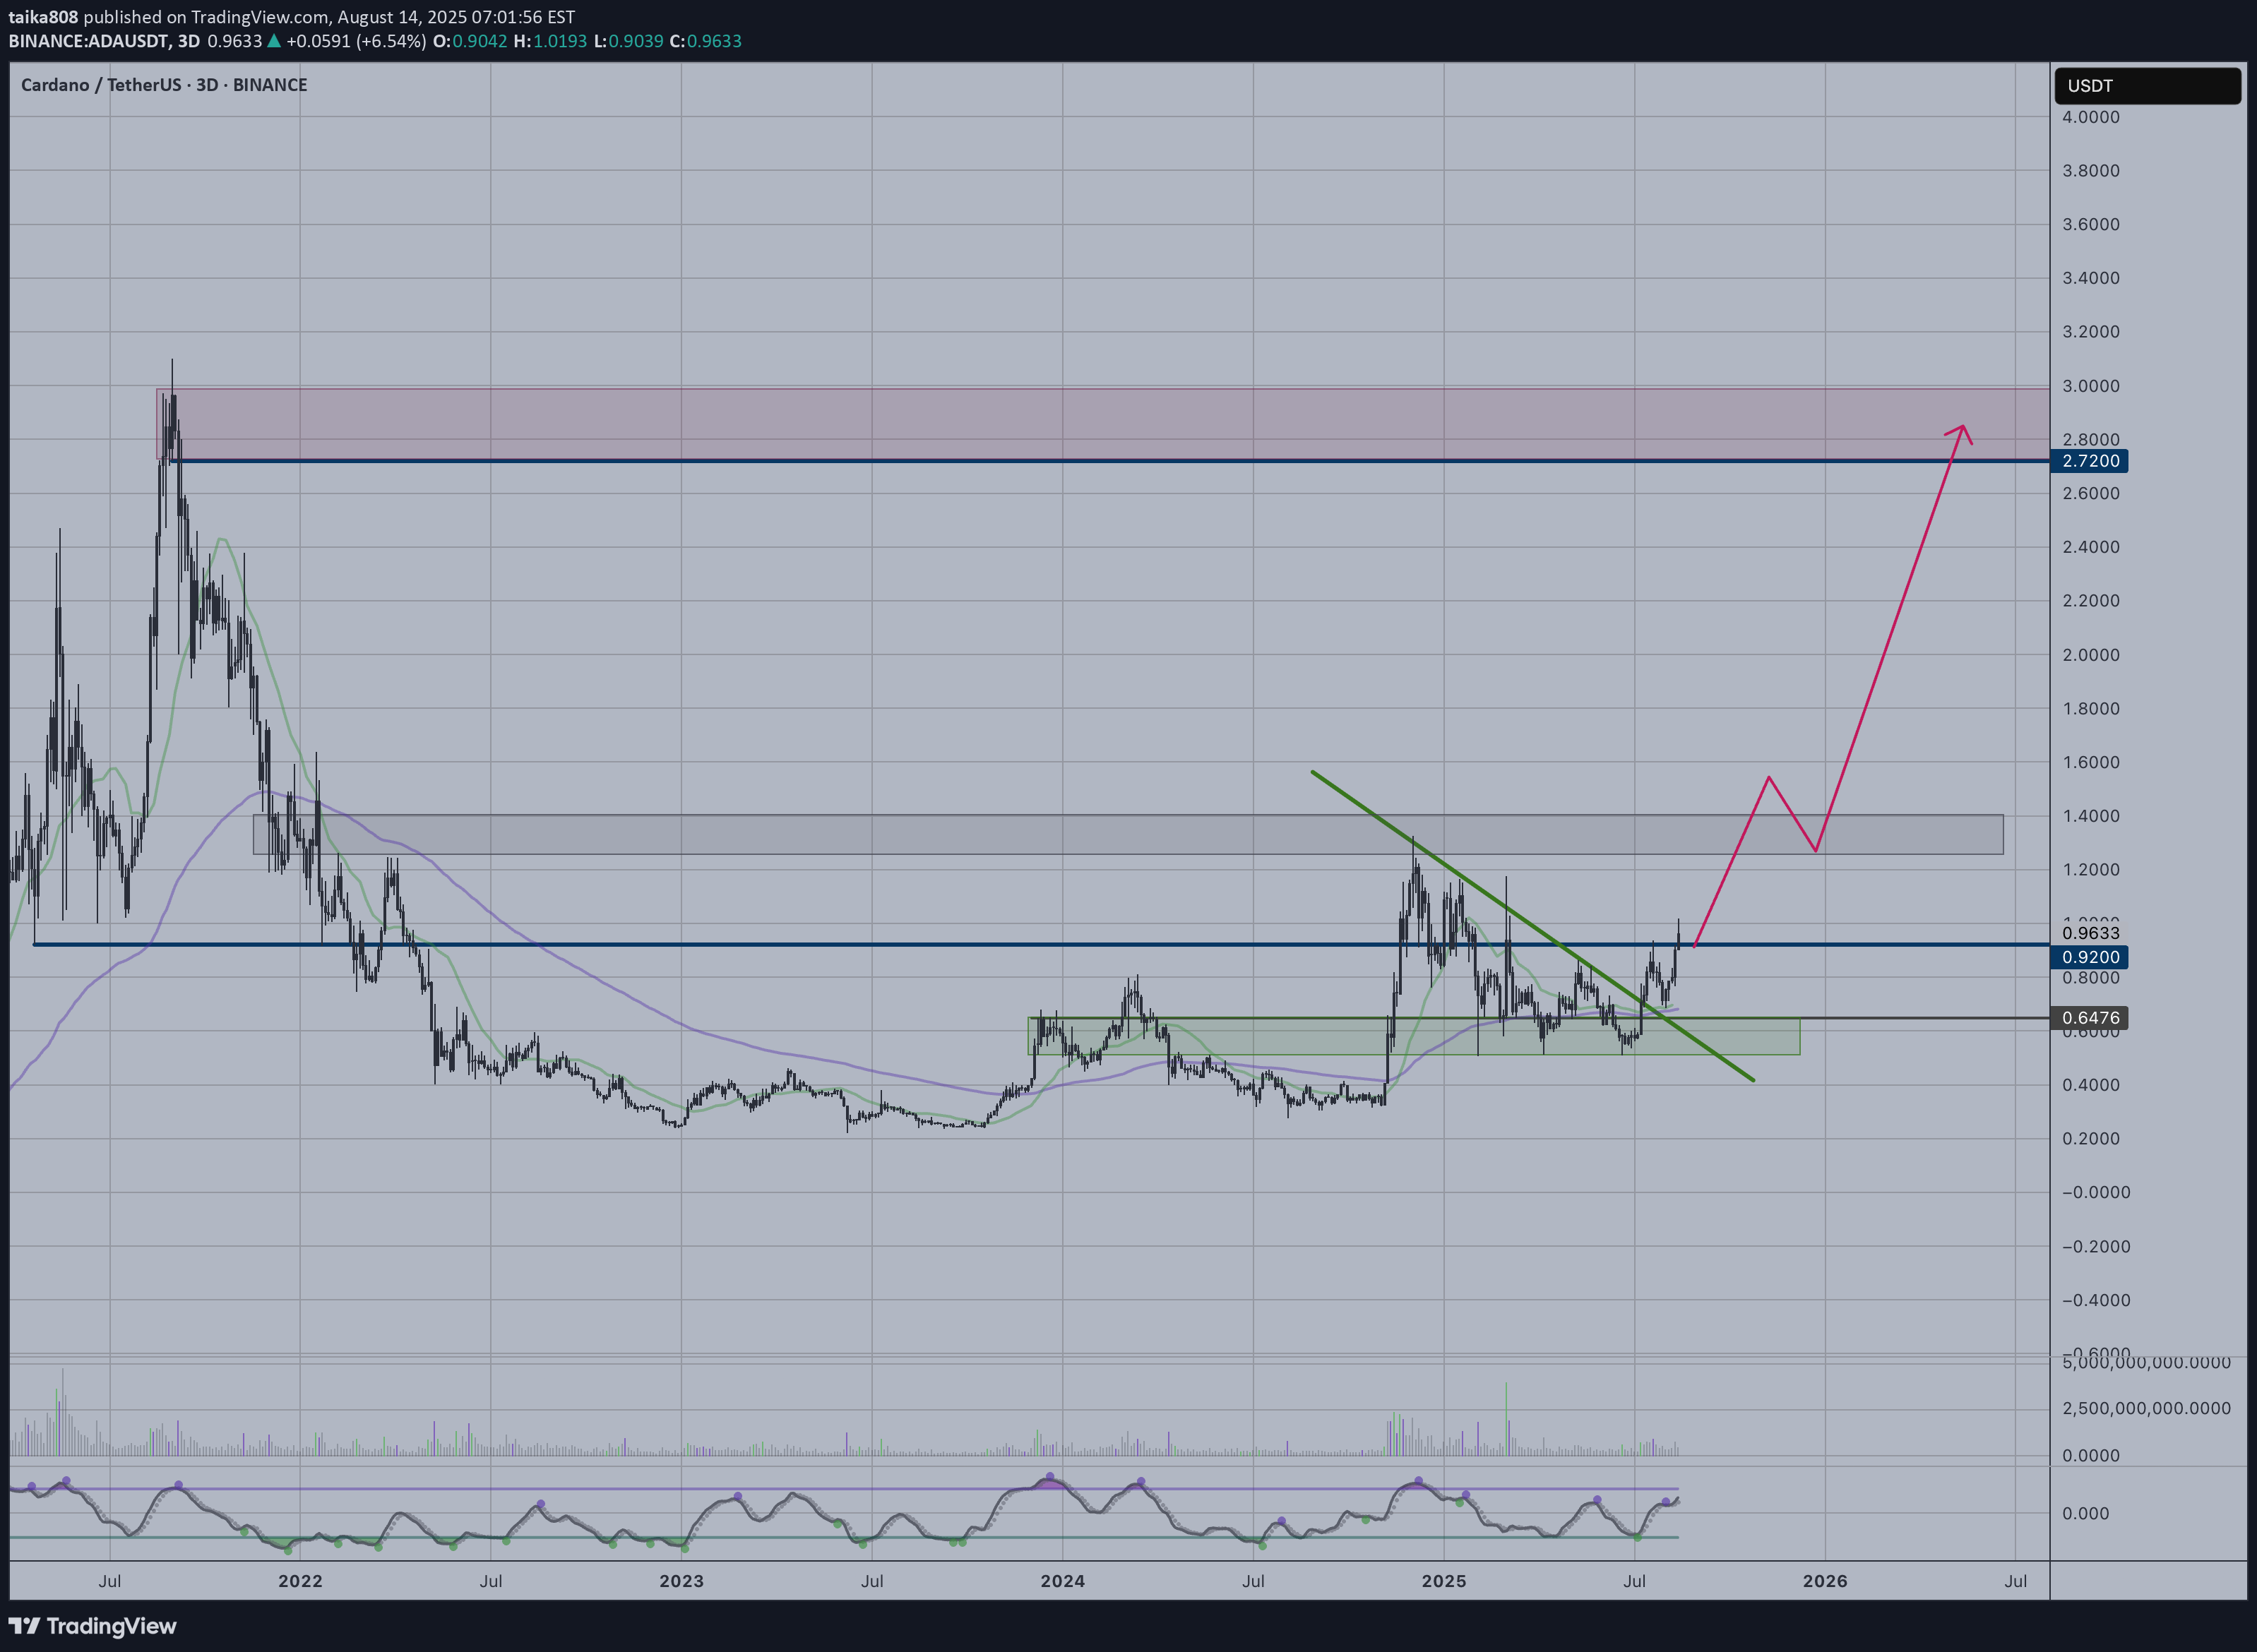
Cardano is showing strong bullish potential after breaking out from a long-term trendline that had been acting as resistance since 2022. The recent price action demonstrates a clear shift in momentum as bulls have successfully reclaimed control above key support levels. Key Technical Observations: Clean breakout from multi-year resistance zone Price holding above the green support zone around $0.64 Strong volume confirmation during the breakout phase RSI showing healthy momentum without being overbought Potential Long Setup: Entry: Current levels or on any pullback Target 1: $1.30 (previous resistance level) Target 2: $2.72 (major resistance zone marked in red) Stop Loss: Below $0.64 support Risk Considerations: The projected move to $2.72 represents significant upside but would require sustained buying pressure. Any failure to hold above the breakout level could signal a false breakout. The crypto market's volatility demands careful position sizing and risk management.
taika808
RAY | Rocket Ready to Launch
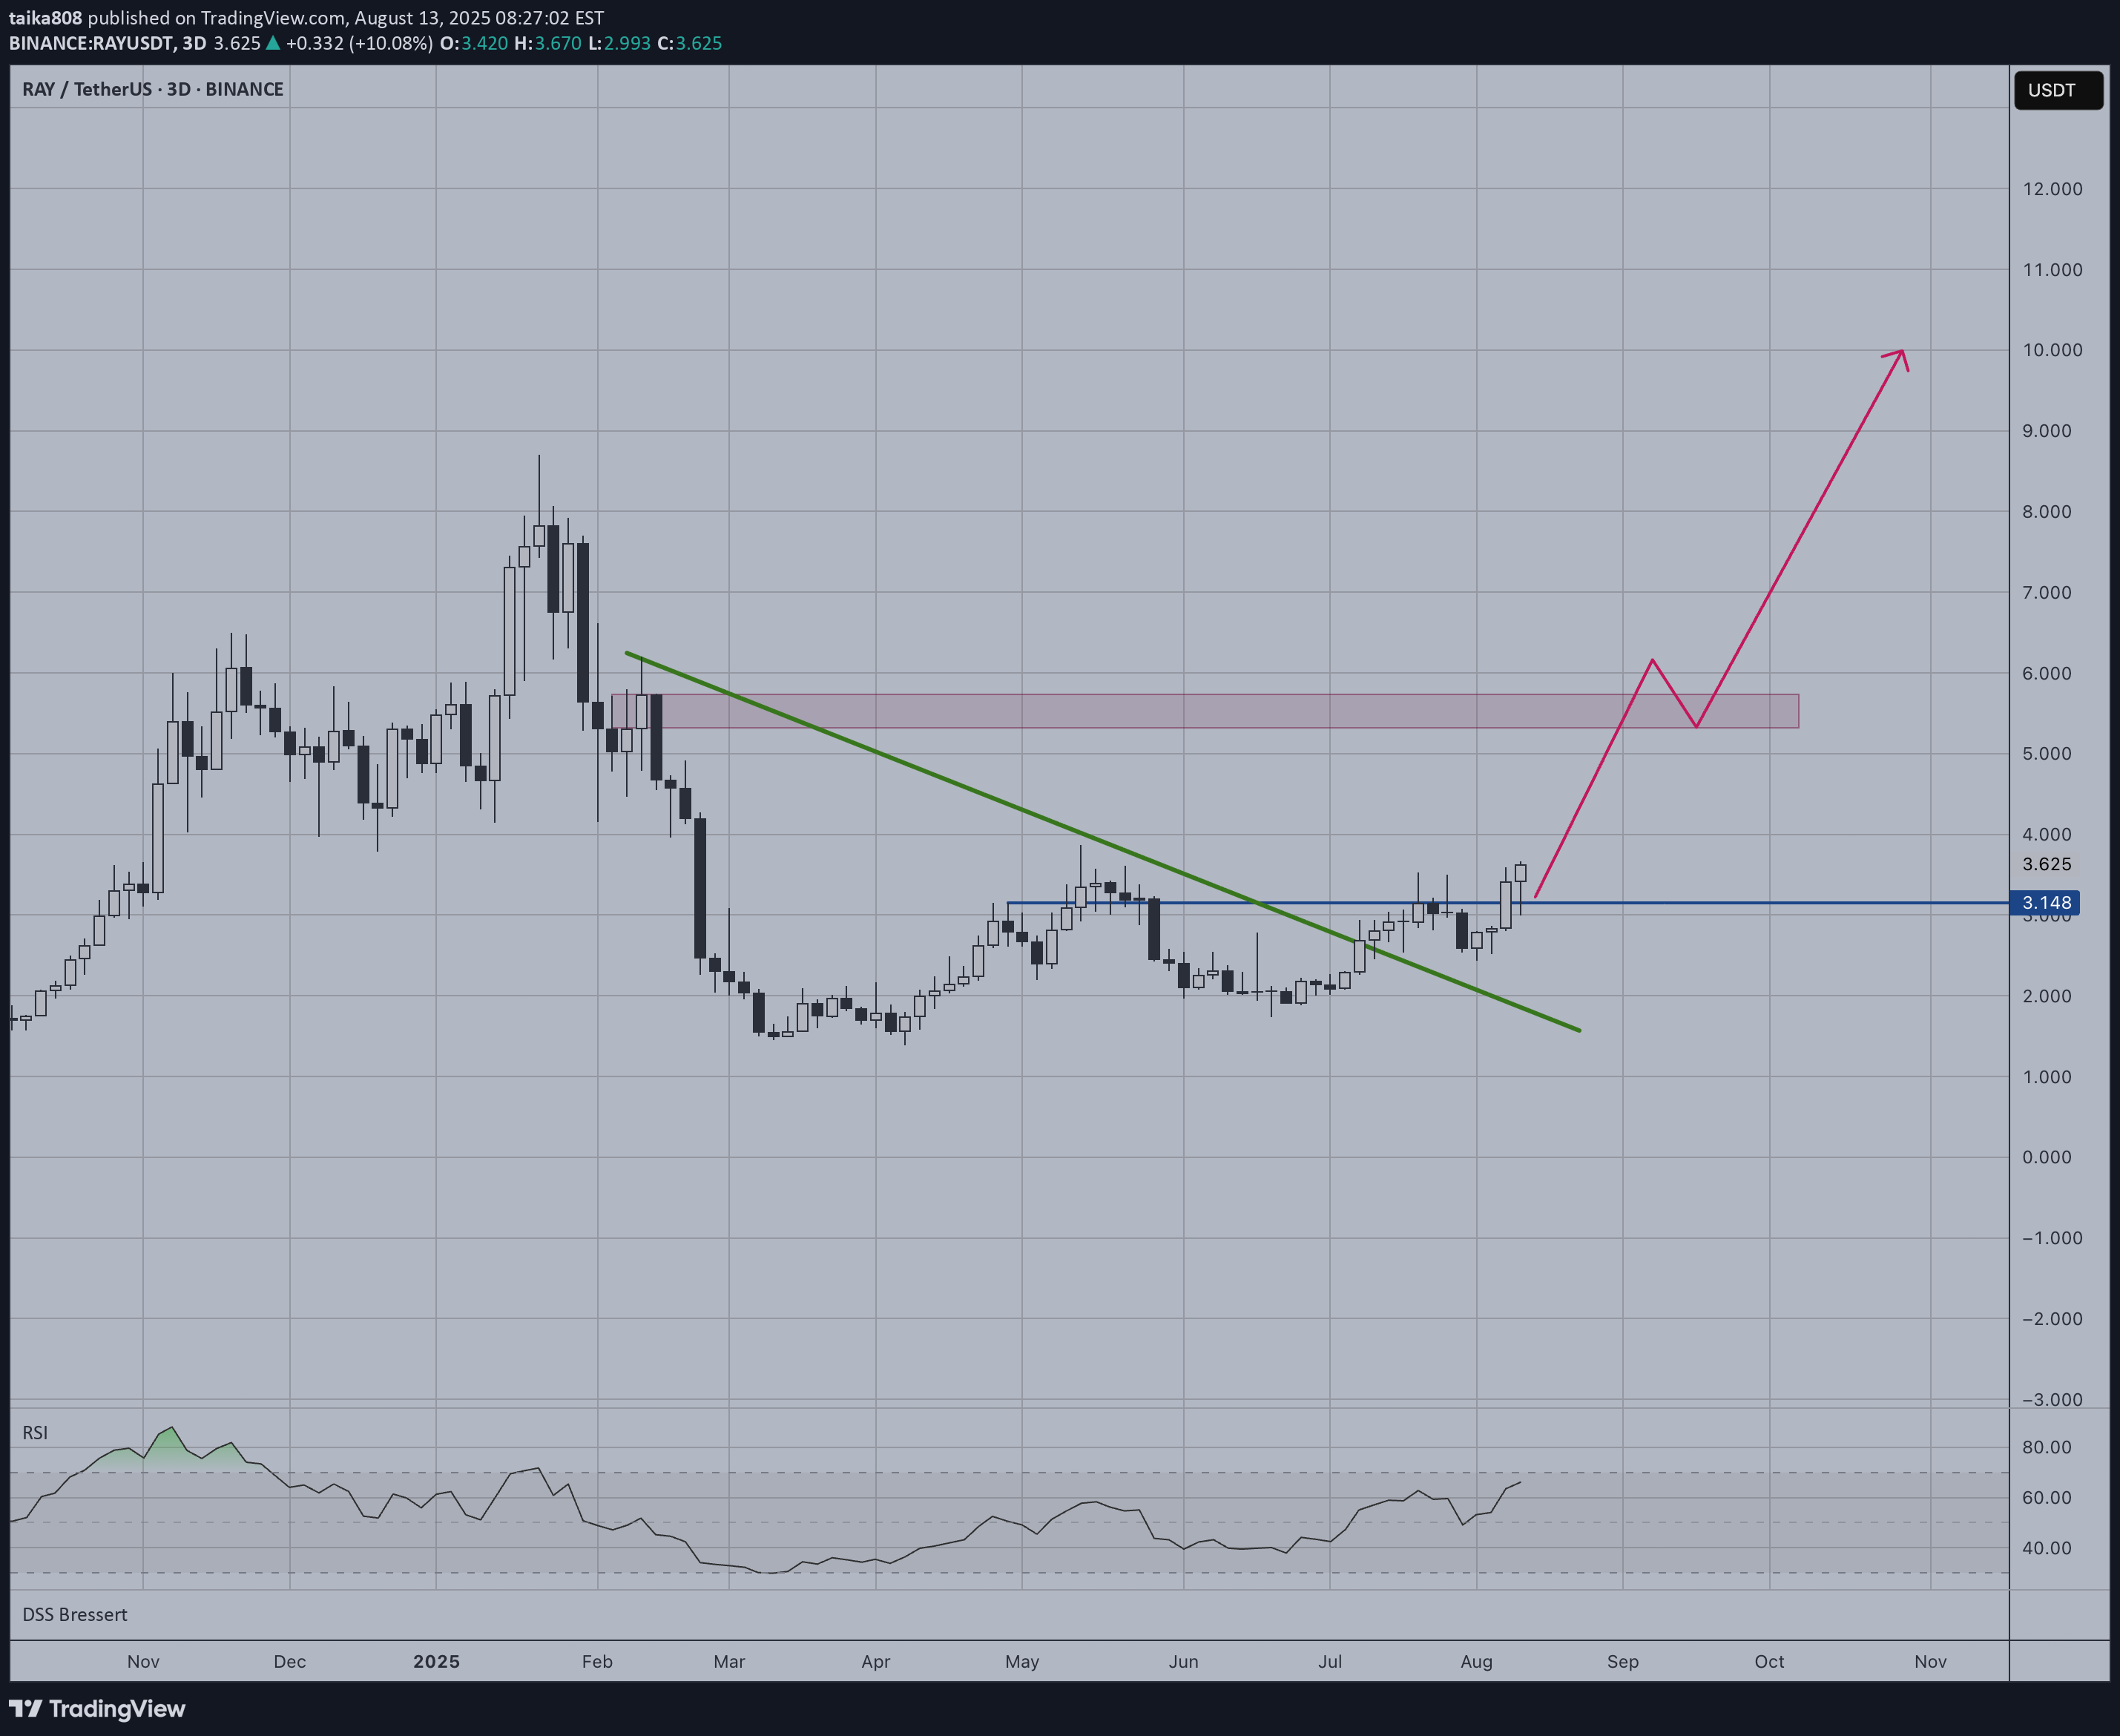
RAY appears primed for a potential rocket launch, having broken above a major descending trendline that has been suppressing price action since early 2025. The breakout is accompanied by strong bullish momentum and the RSI showing renewed strength after months of consolidation. Key Technical Signals: • Clean break above long-term resistance trendline • Price trading above current support zone around $3.14 • RSI indicating bullish momentum building • Volume profile suggests accumulation phase complete Potential Targets: • First resistance zone: $5.50-$6.00 (marked red box) • Extended target: $10.00+ following the projected path Risk Considerations: A failure to hold above the broken trendline (around $2.80-$3.00) would invalidate this bullish setup.
taika808
MNT | New All Time High Soon?
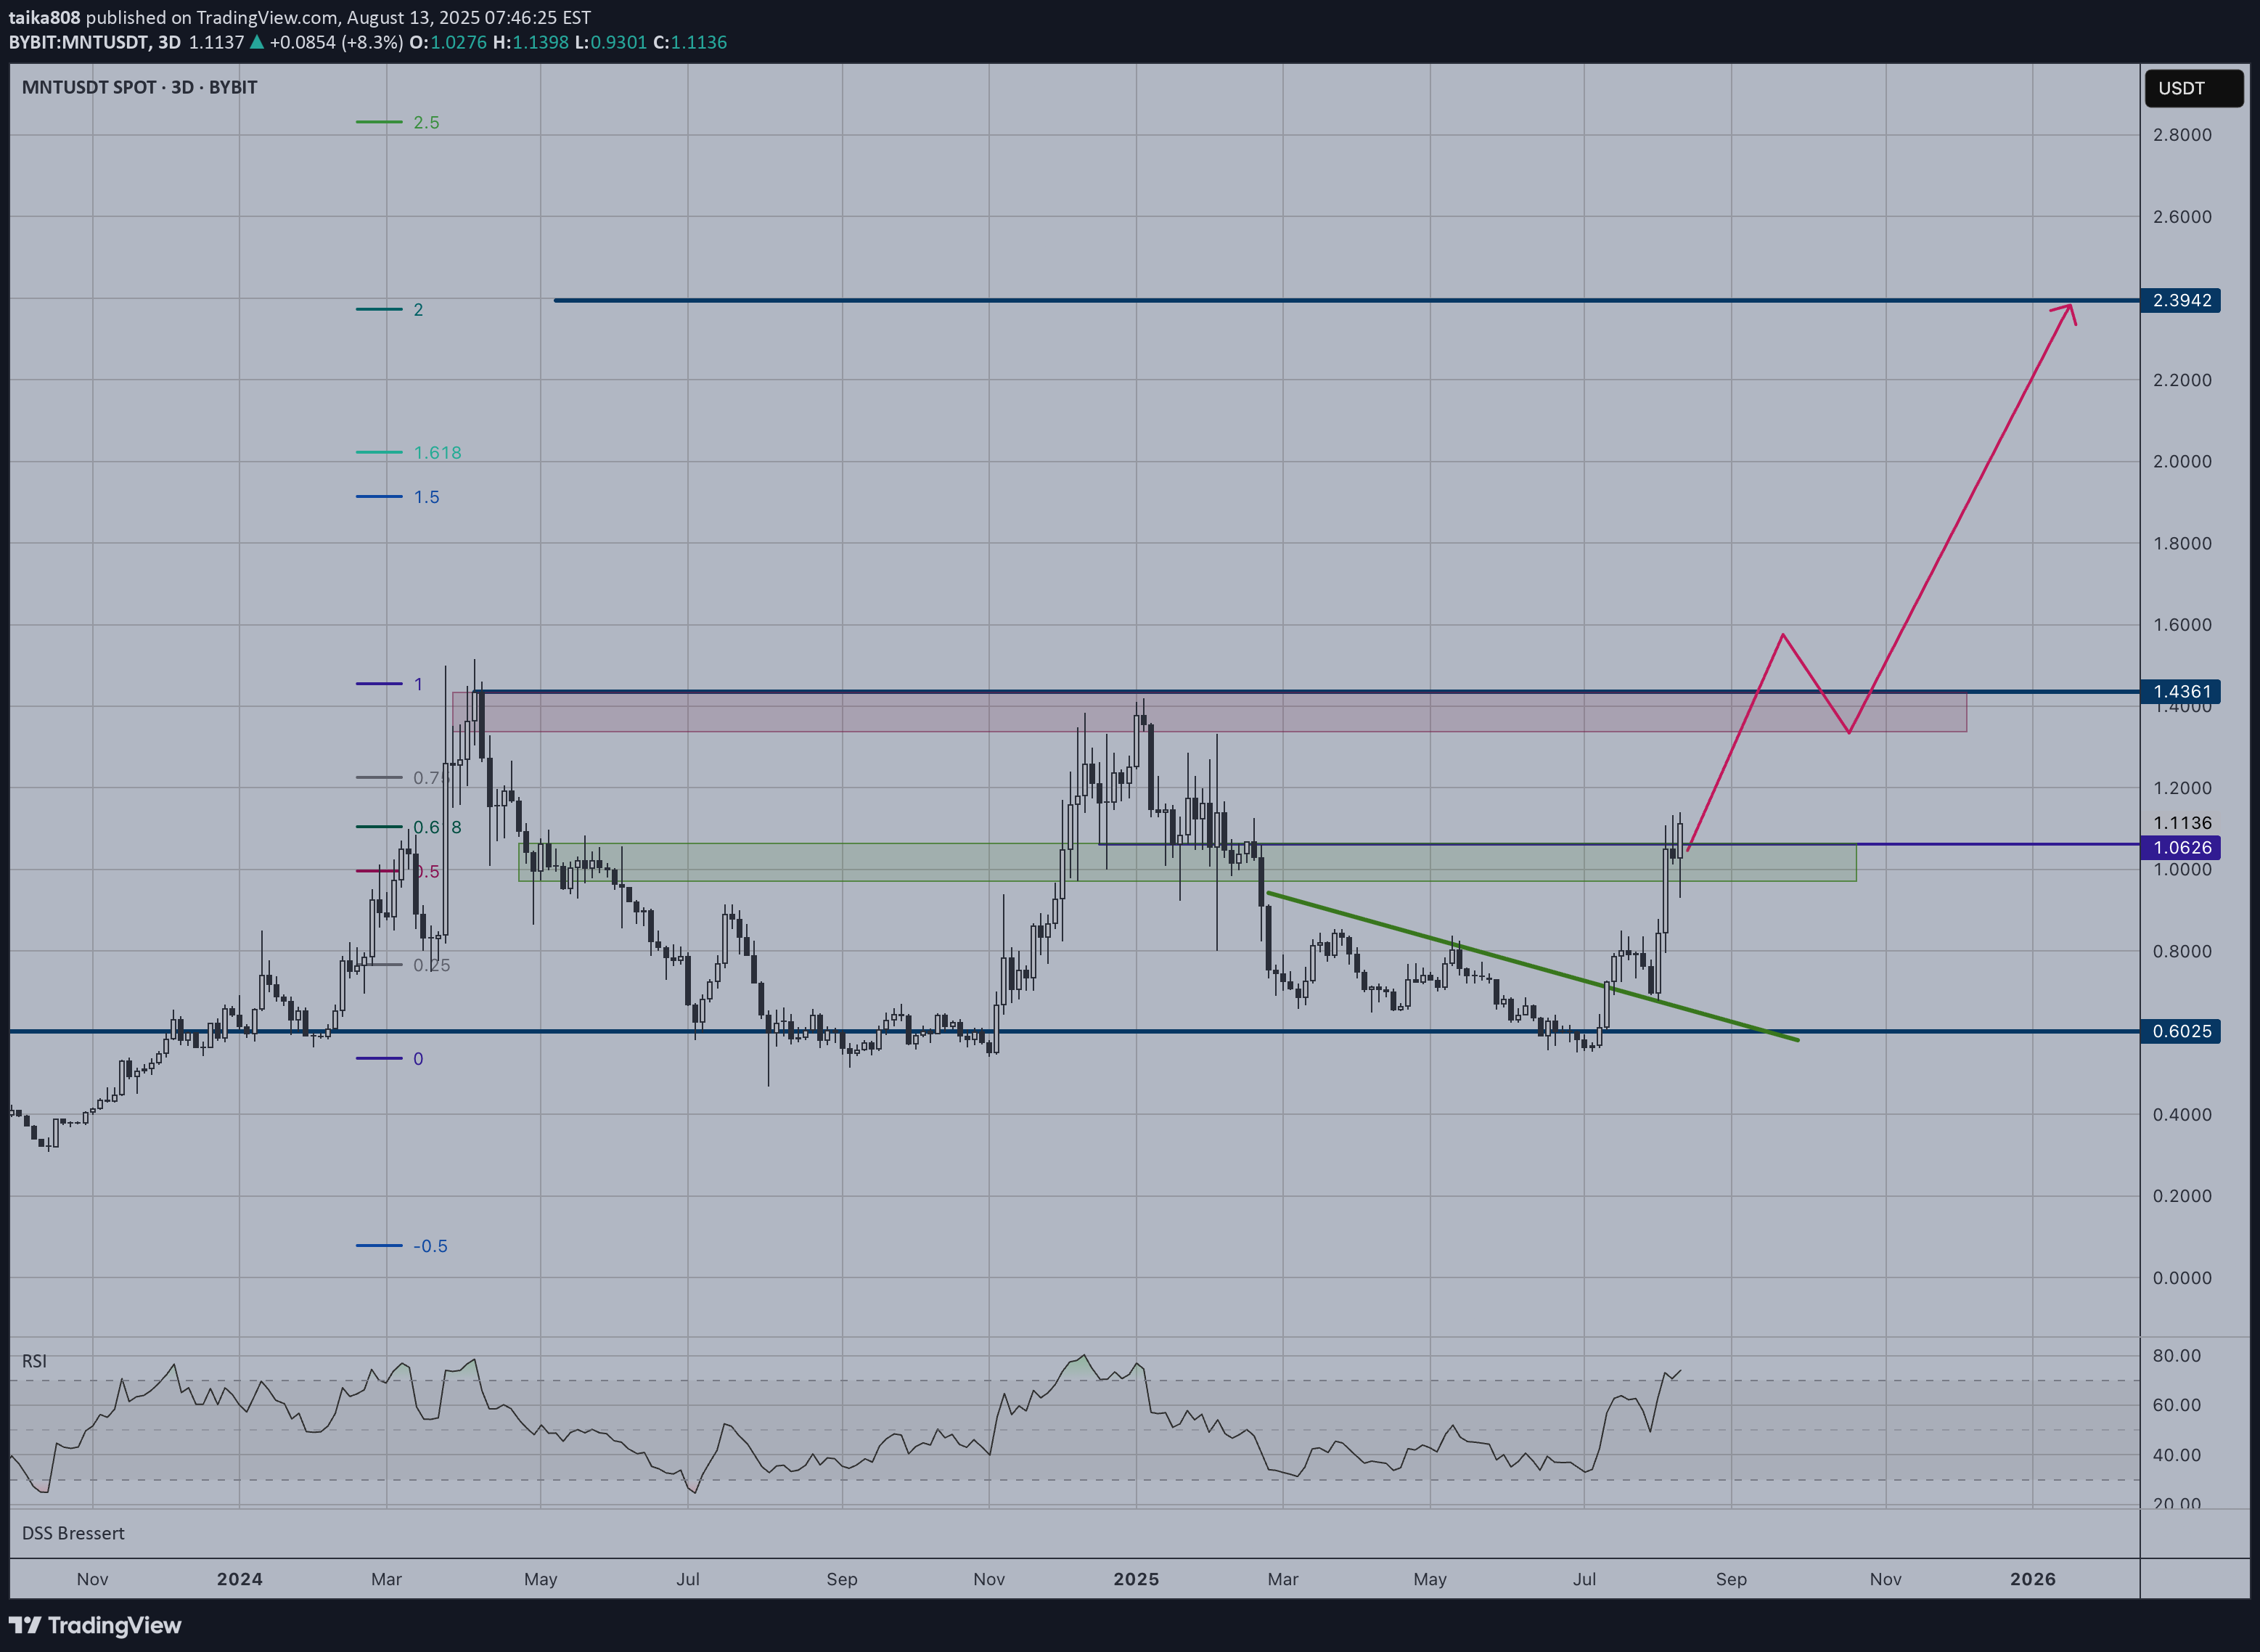
Mantle is showing strong bullish momentum after breaking above the descending trendline and clearing the key resistance zone around $1.10. The price action suggests a powerful reversal from the long-term downtrend. Key Technical Factors: • Clean breakout above descending resistance trendline • Price trading above the green support zone ($1.0626) • RSI climbing towards overbought territory, confirming momentum • Strong bullish candles indicating buyer conviction Price Targets: • First resistance: $1.4361 (previous high) • Extended target: $2.3942 (as indicated by the projected path) The setup aligns with a new ATH scenario, but traders should consider position sizing carefully given the ambitious targets.
taika808
LDO | Flipped Longe Term Resistance

LDO has achieved a significant technical milestone by breaking above its long-term descending resistance trendline that has been in place since early 2024. This breakout represents a major shift in market structure from bearish to potentially bullish sentiment. Key Technical Points: • Price successfully flipped the major resistance around $1.485 into support • The breakout occurred with strong momentum after months of consolidation • RSI is trending upward, confirming the bullish momentum shift Price Targets: • First resistance: $2.00 (previous consolidation high) • Major target: $3.50+ resistance zone (red box area) Risk Considerations: The projected path suggests a strong upward trajectory, but traders should watch for any rejection at the $2.00 level as a potential pause point.
taika808
MNT | Resistance Becomes Support

Mantle (MNT/USDT) has successfully broken above its major resistance trendline and converted it into support - a classic bullish reversal pattern. Key Technical Points: • Clean breakout above descending trendline • Former resistance now acting as support • RSI showing renewed bullish momentum • Price holding above the green support zone Bullish Targets: • First resistance: $1.41 (blue horizontal line) • Extended target: $2.31 (upper resistance zone) The pink arrow projection suggests a strong upward trajectory toward these levels. The breakout structure indicates buyers have regained control after months of consolidation. This setup presents an attractive risk-to-reward opportunity, with the converted support level providing a clear invalidation point below $0.85.
taika808
FARTCOIN | Out of Steam

FARTCOIN appears to be running out of steam after its impressive rally from the March lows. The chart shows a clear breakdown from the ascending trendline support that had been holding since early 2025. Key Technical Signals: Price has broken below the major ascending trendline RSI shows declining momentum, failing to maintain bullish territory Recent price action suggests exhaustion after the parabolic move Bearish Setup: A potential decline toward the green support zone around $0.40-$0.50. This represents the previous consolidation area that could act as strong support. Risk Considerations: Meme coins can be highly volatile and unpredictable Any sudden narrative shift could invalidate the bearish thesis Stop loss above the broken trendline would be prudent
taika808
RPL | Waiting to Reclaim Pivot
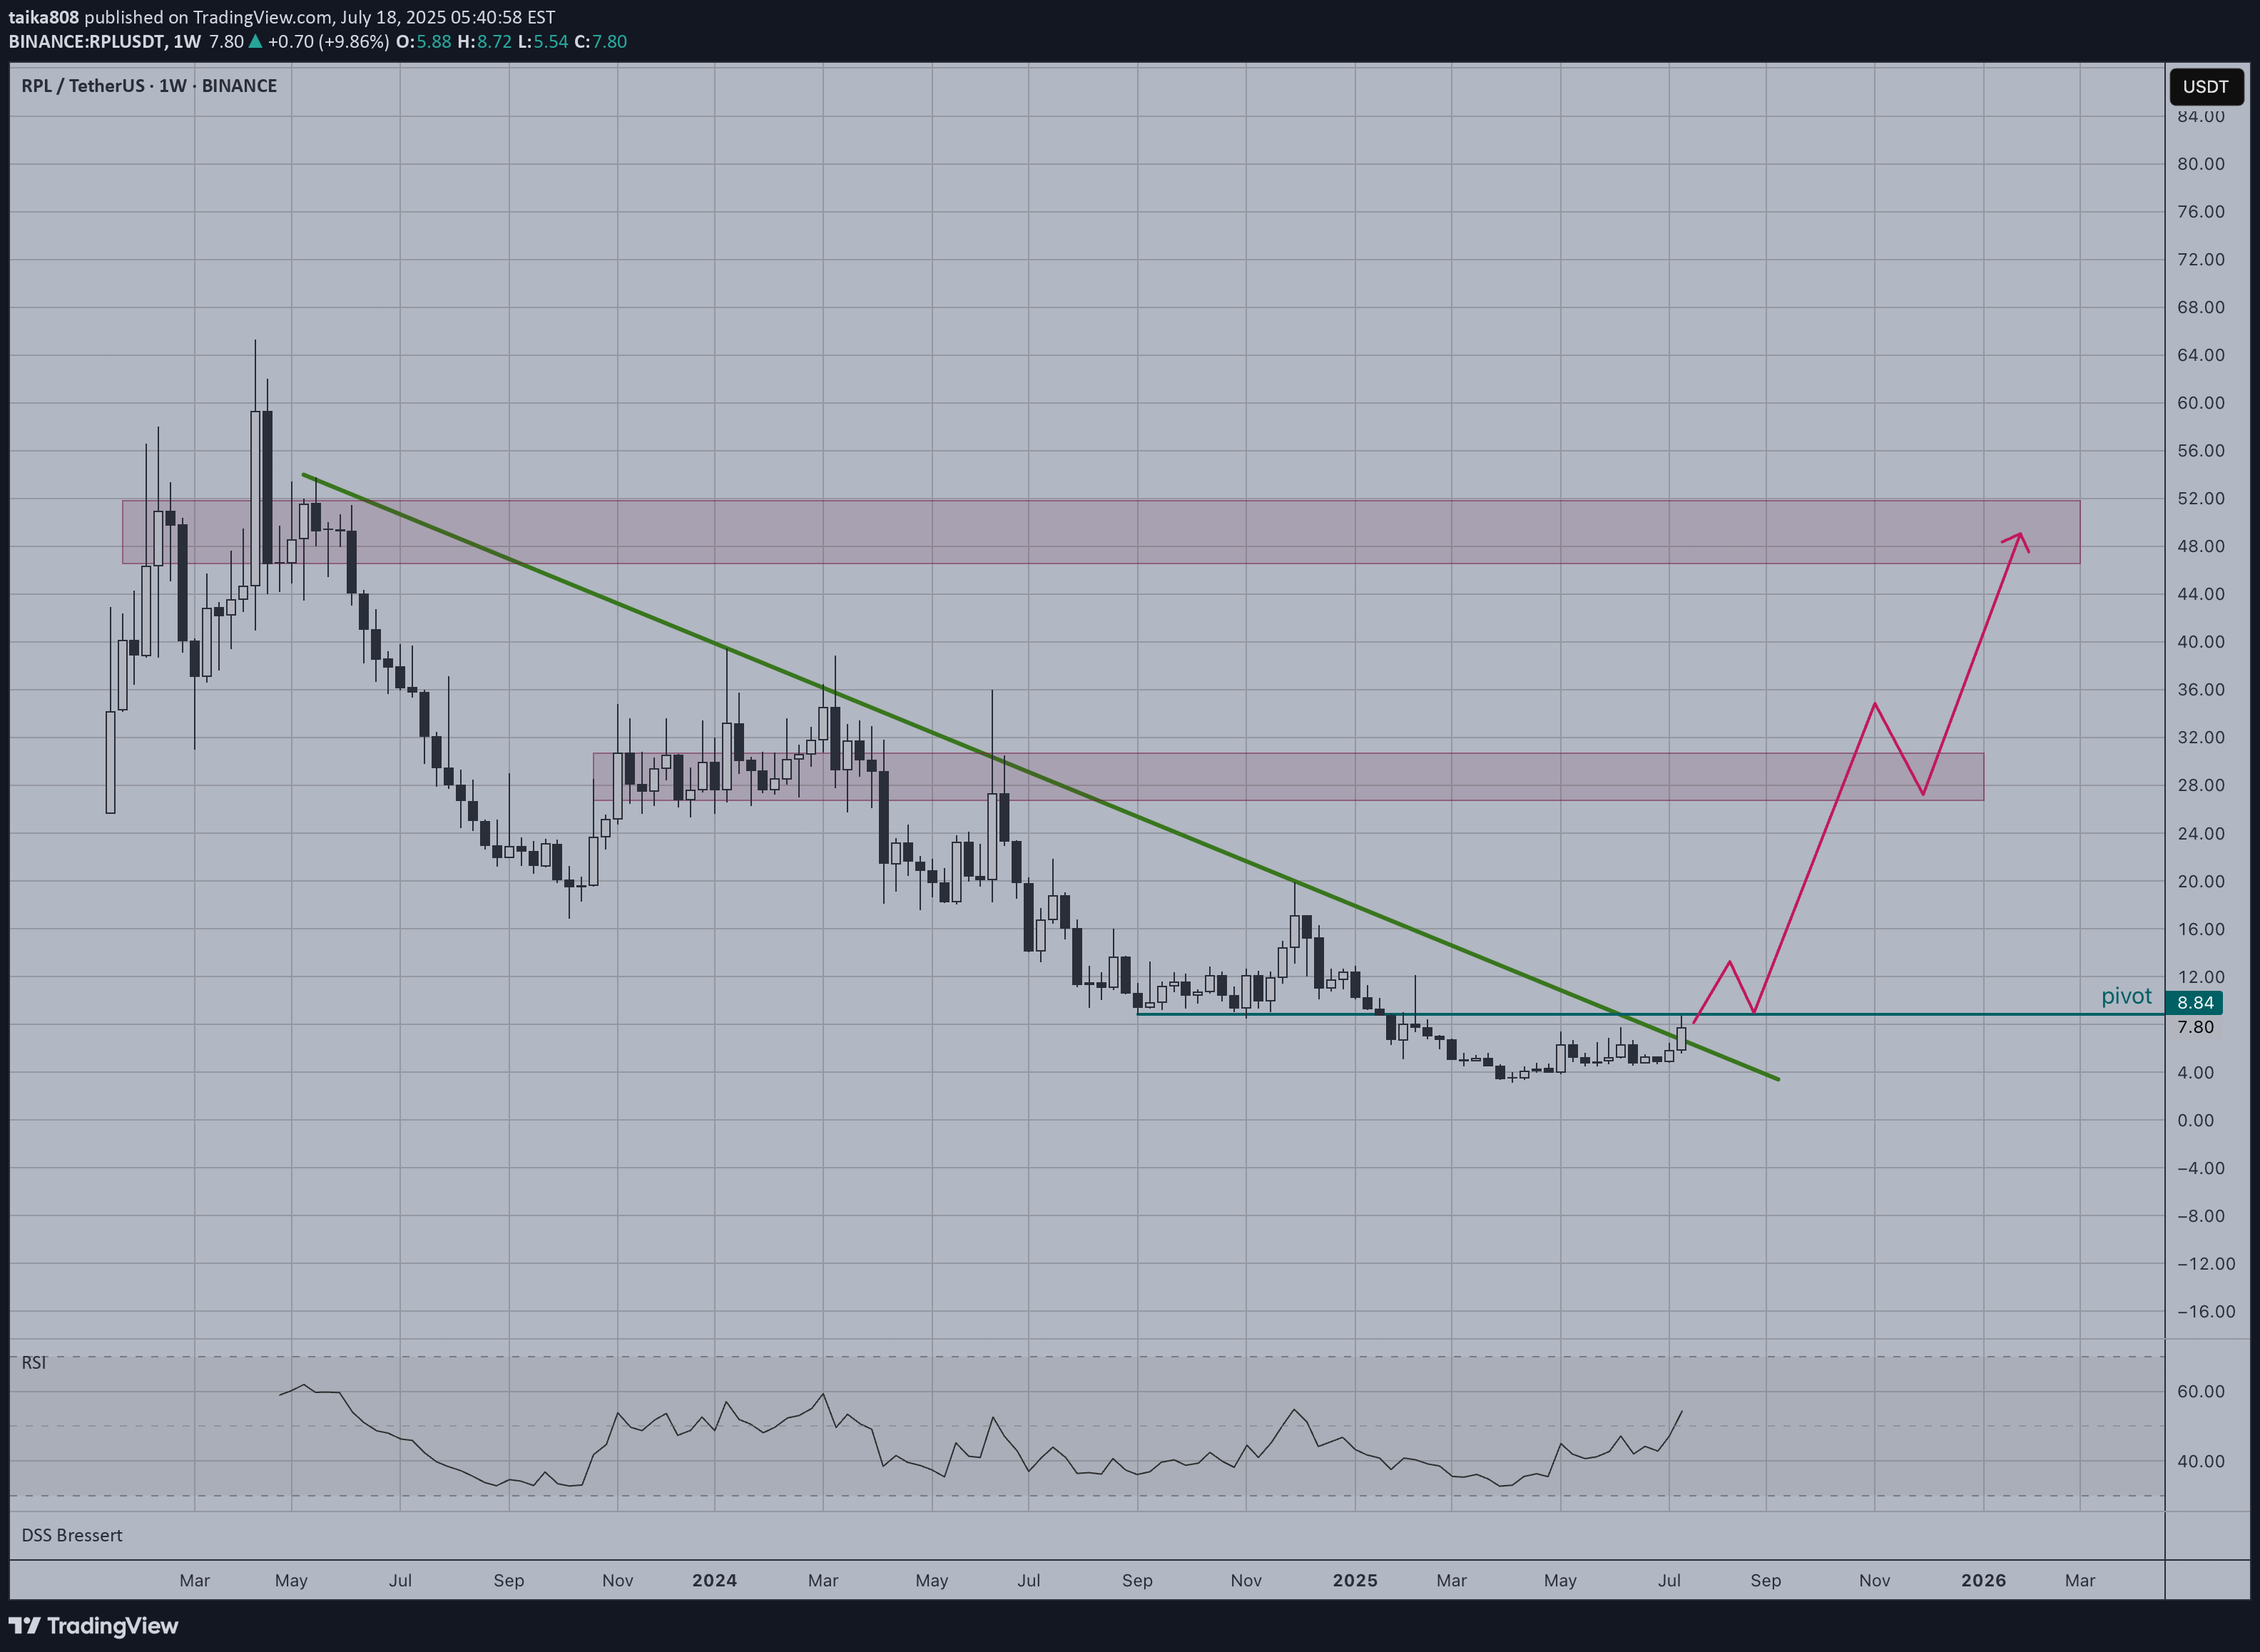
RPL appears to be at a critical juncture on the weekly timeframe, having recently broken below its long-term descending trendline. The price is currently consolidating near the pivot level, which represents a key technical inflection point. Current Setup: Price trading below descending trendline resistance RSI showing oversold conditions with potential for bounce Critical pivot level at acting as immediate resistance Bullish Scenario: Reclaim of the pivot could trigger the projected upward path Target the resistance zone around $28-32 (marked in red) A break above the descending trendline would confirm trend reversal Risk Factors: Failure to reclaim pivot could lead to further downside Overall crypto market sentiment remains a key factor The setup suggests RPL is waiting for a decisive move above the pivot to initiate the bullish trajectory outlined in the chart projection.
Disclaimer
Any content and materials included in Sahmeto's website and official communication channels are a compilation of personal opinions and analyses and are not binding. They do not constitute any recommendation for buying, selling, entering or exiting the stock market and cryptocurrency market. Also, all news and analyses included in the website and channels are merely republished information from official and unofficial domestic and foreign sources, and it is obvious that users of the said content are responsible for following up and ensuring the authenticity and accuracy of the materials. Therefore, while disclaiming responsibility, it is declared that the responsibility for any decision-making, action, and potential profit and loss in the capital market and cryptocurrency market lies with the trader.