
ssari
@t_ssari

What symbols does the trader recommend buying?
Purchase History
پیام های تریدر
Filter
ssari
تکنیک کامل تحلیل سهم SUI TA: راز موفقیت در معاملهگری با امواج الیوت و فیبوناچی!
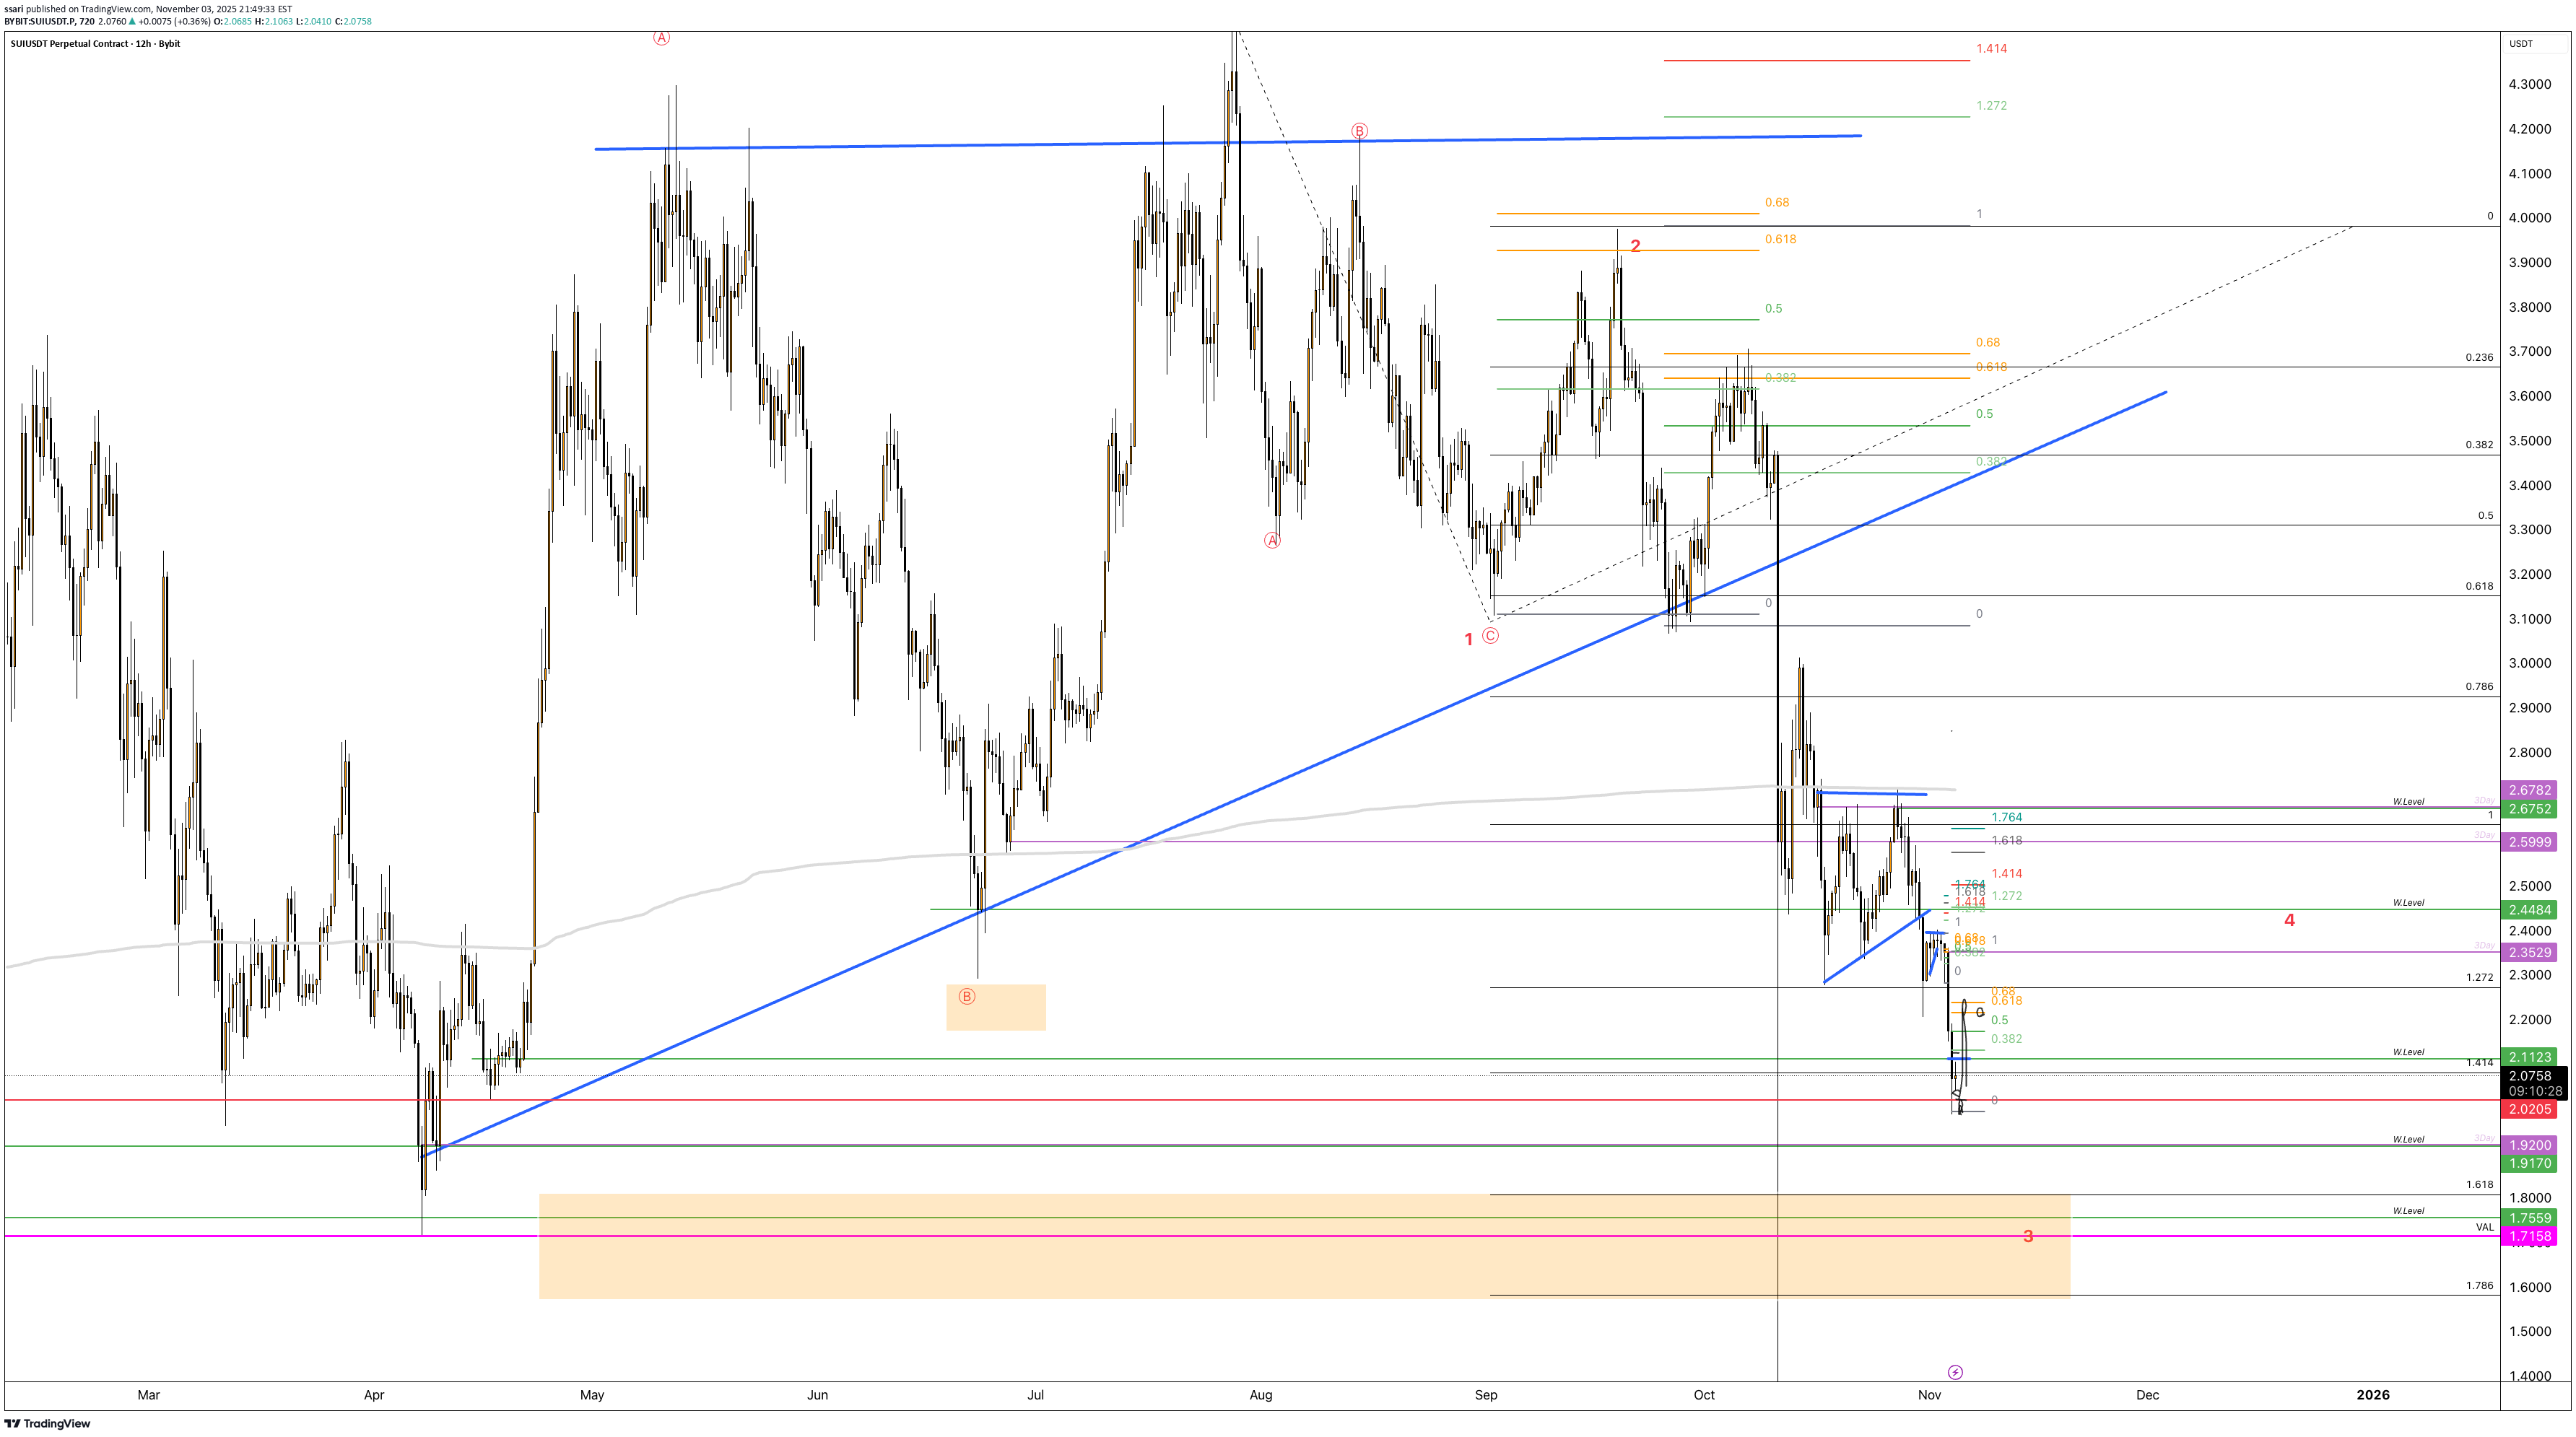
Hi Traders, Besides being an educational piece on how I approach the charts, we will dive into what is likely to play out from an Elliott Wave perpective and using support and resistance methods to find confluence with our fibonacci approach for levels to short and long. I promise you newbies or intermediates, master this and you will have much more success in your trading. Experience obviously takes time. All the best, S.SAriArea of interest to long scalp. I still think it will go lower Fib ext 1 for Wave c or Wave 3
ssari
حرکت بزرگ بعدی در بازار: استراتژی معاملاتی که باید بدانید!
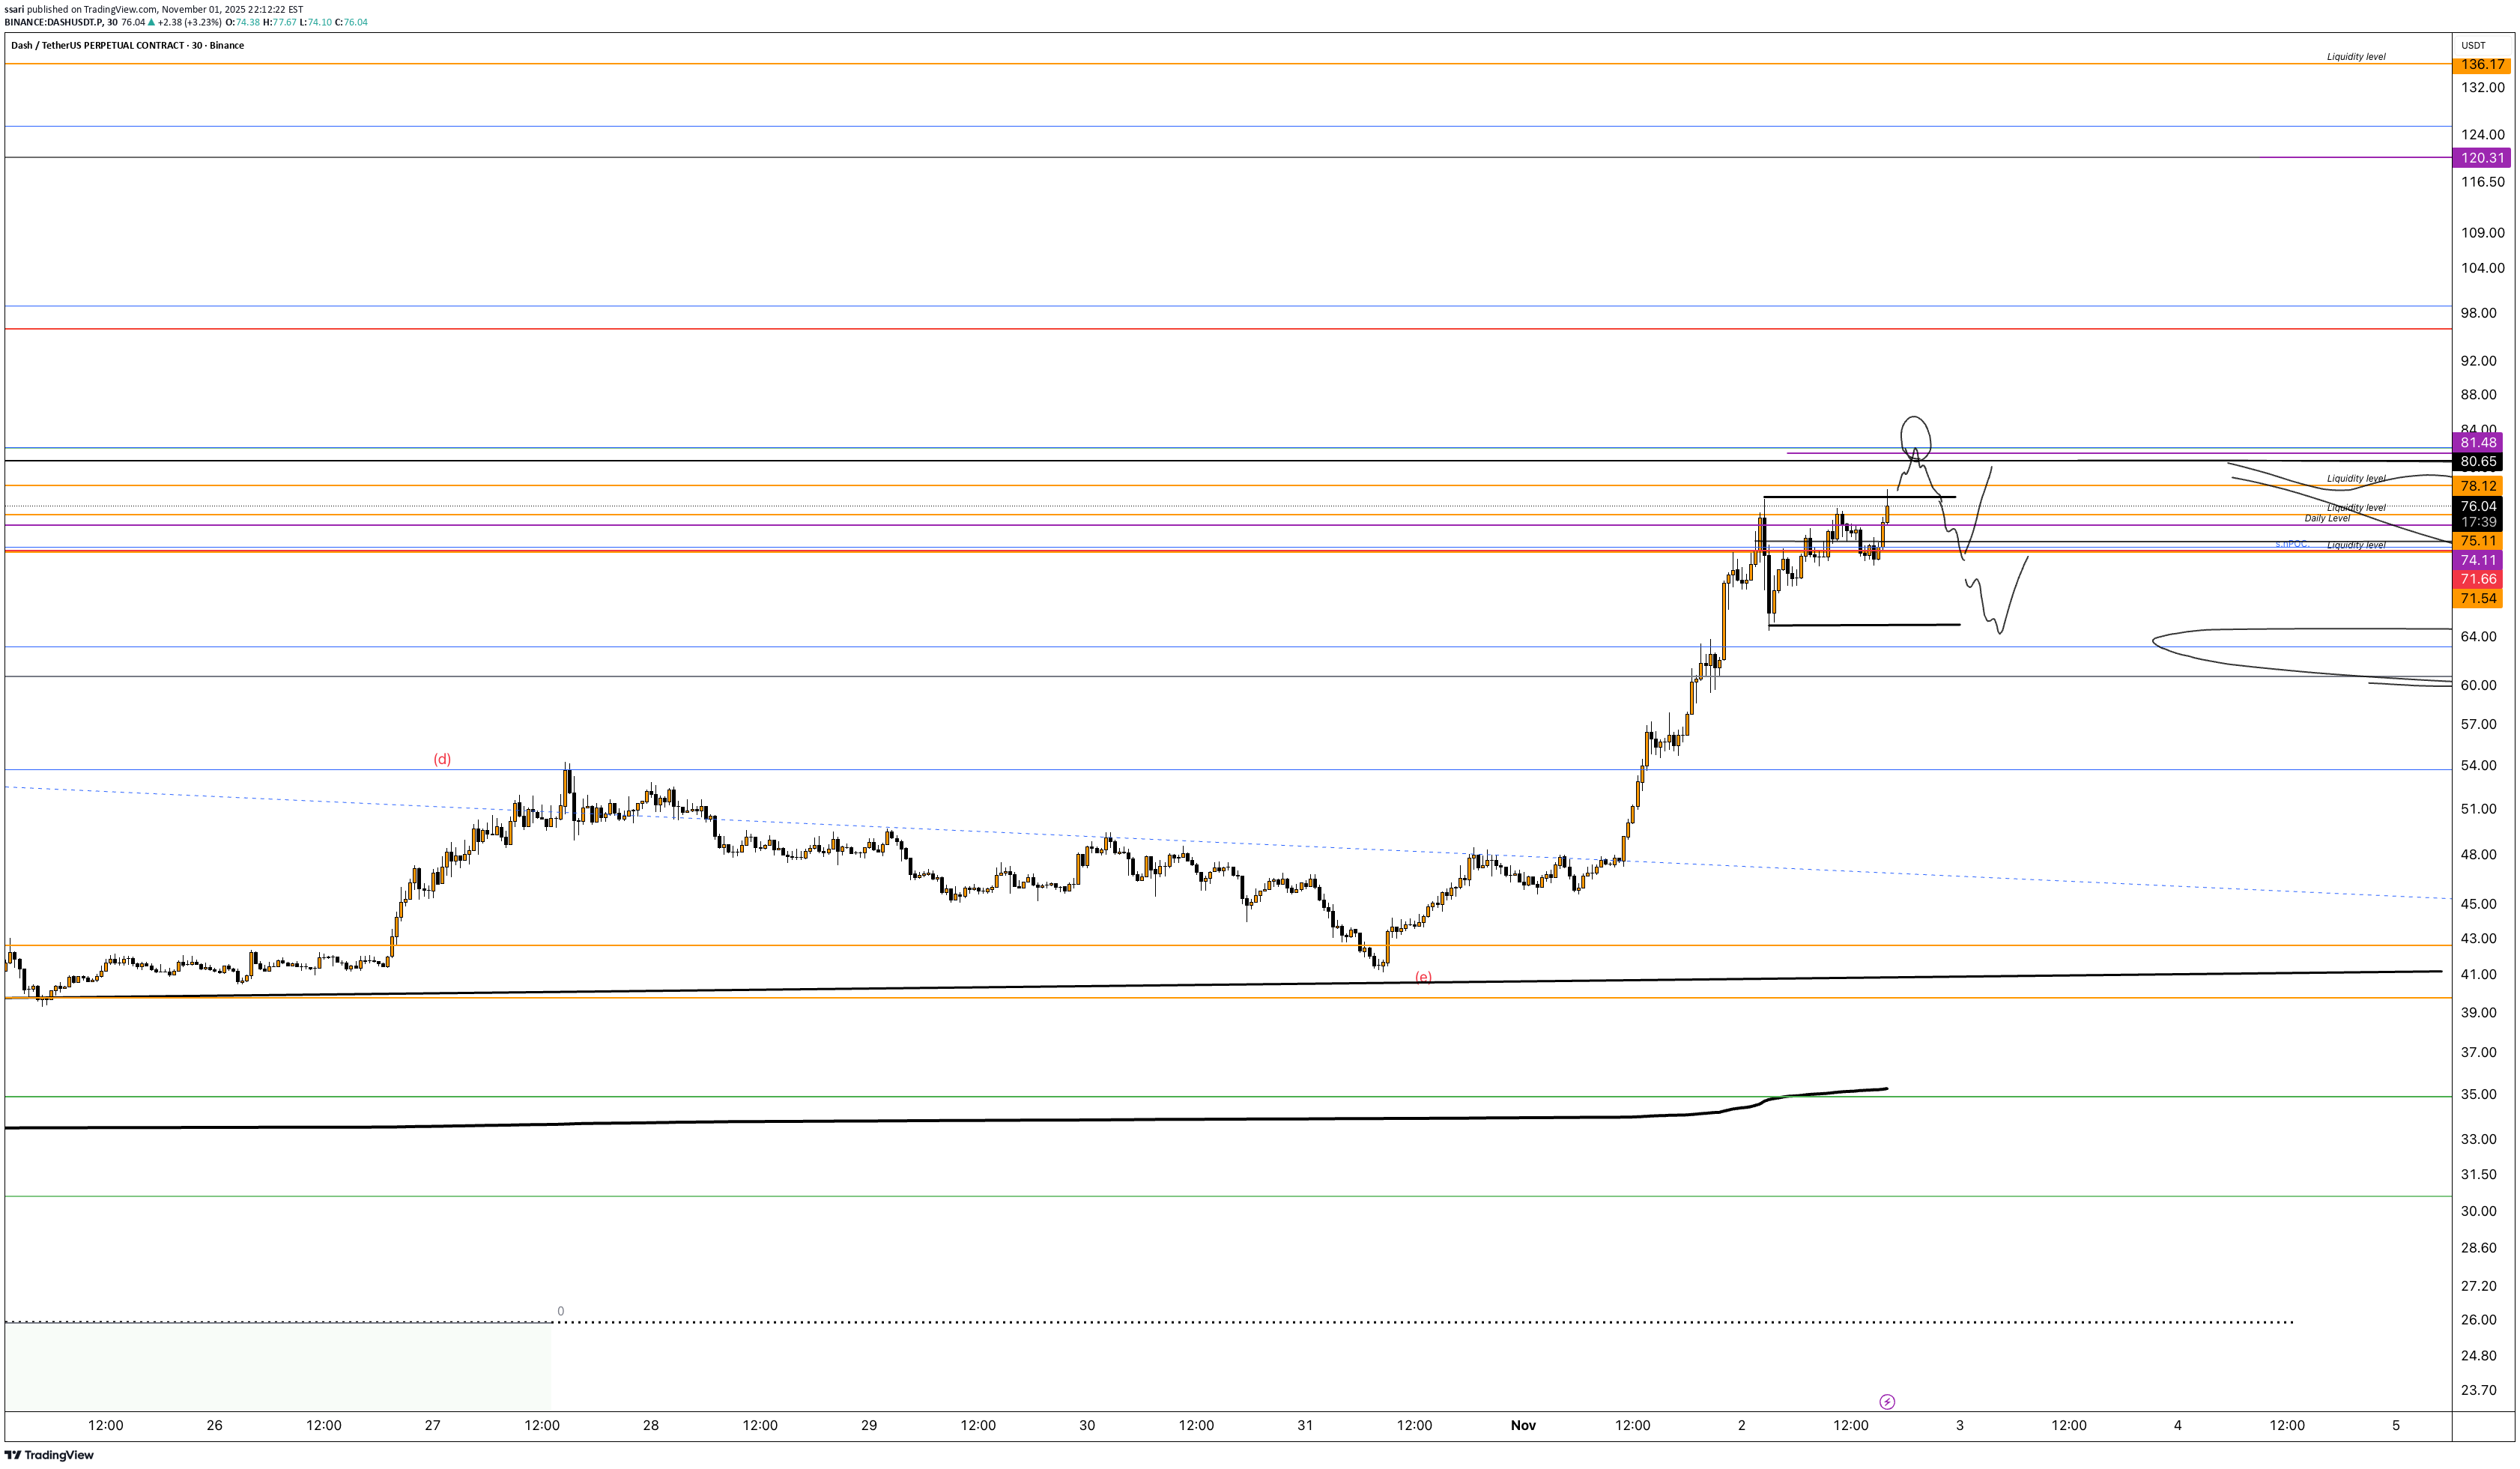
HI Traders, One can say this is an educational piece as well as the approach to trading it. If you like it or enjoy it, or not, please give your comments and a like and share. All the best, S.SAri
ssari
بیت کوین (BTC): آیا الگوی هارمونیک گرنتلی قیمت را به کجا میبرد؟
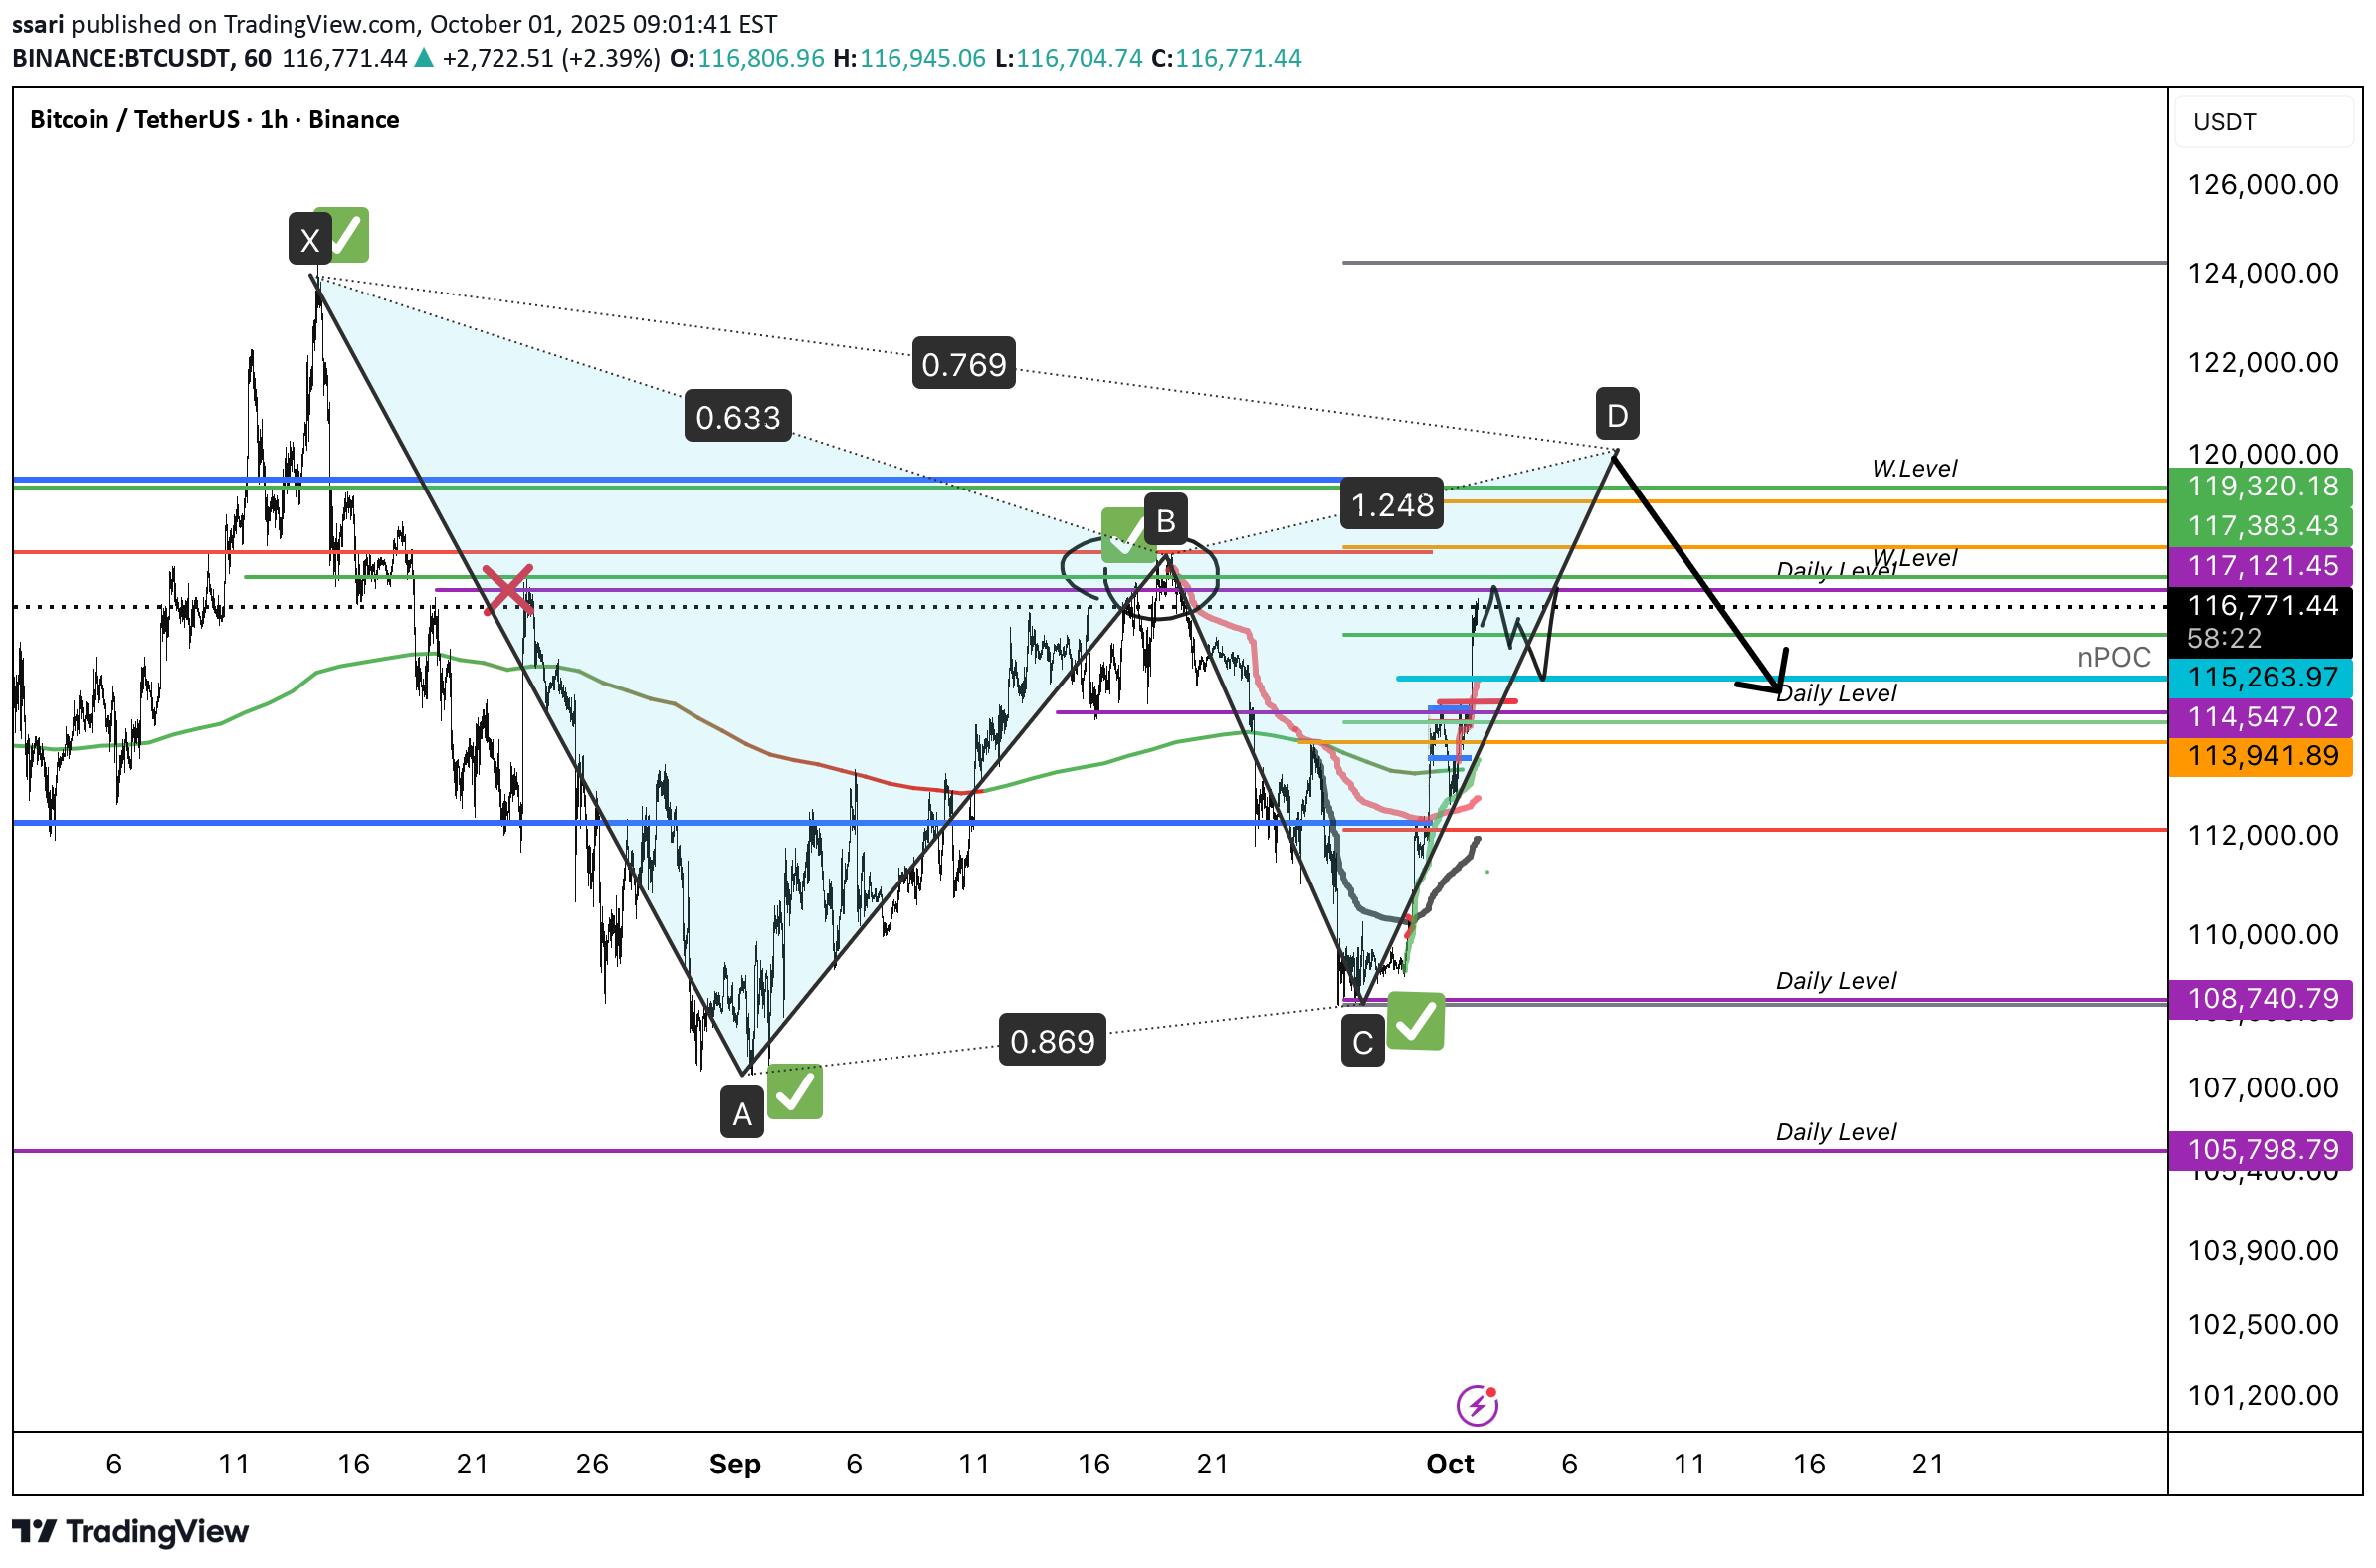
Hi traders, We are looking for more highs and in the short term, the daily level will likely be resistance and hence a shorting scalp opportunity is likely there. On the bigger picture, a Gantley harmonic could be the target as it will take out much of the liquidity. I was hoping for an ATH around 127k or more for the cup and handle target but we might not get that any time soon. I have tweeted many times that September will be bearish and October and November bullish. I don’t envision this time the Harmonic is a topping structure, but we can’t rule it out. All the best, S.SAri.
ssari

ssari
RUNE (Y25.P2.E1).Looking to short the macro
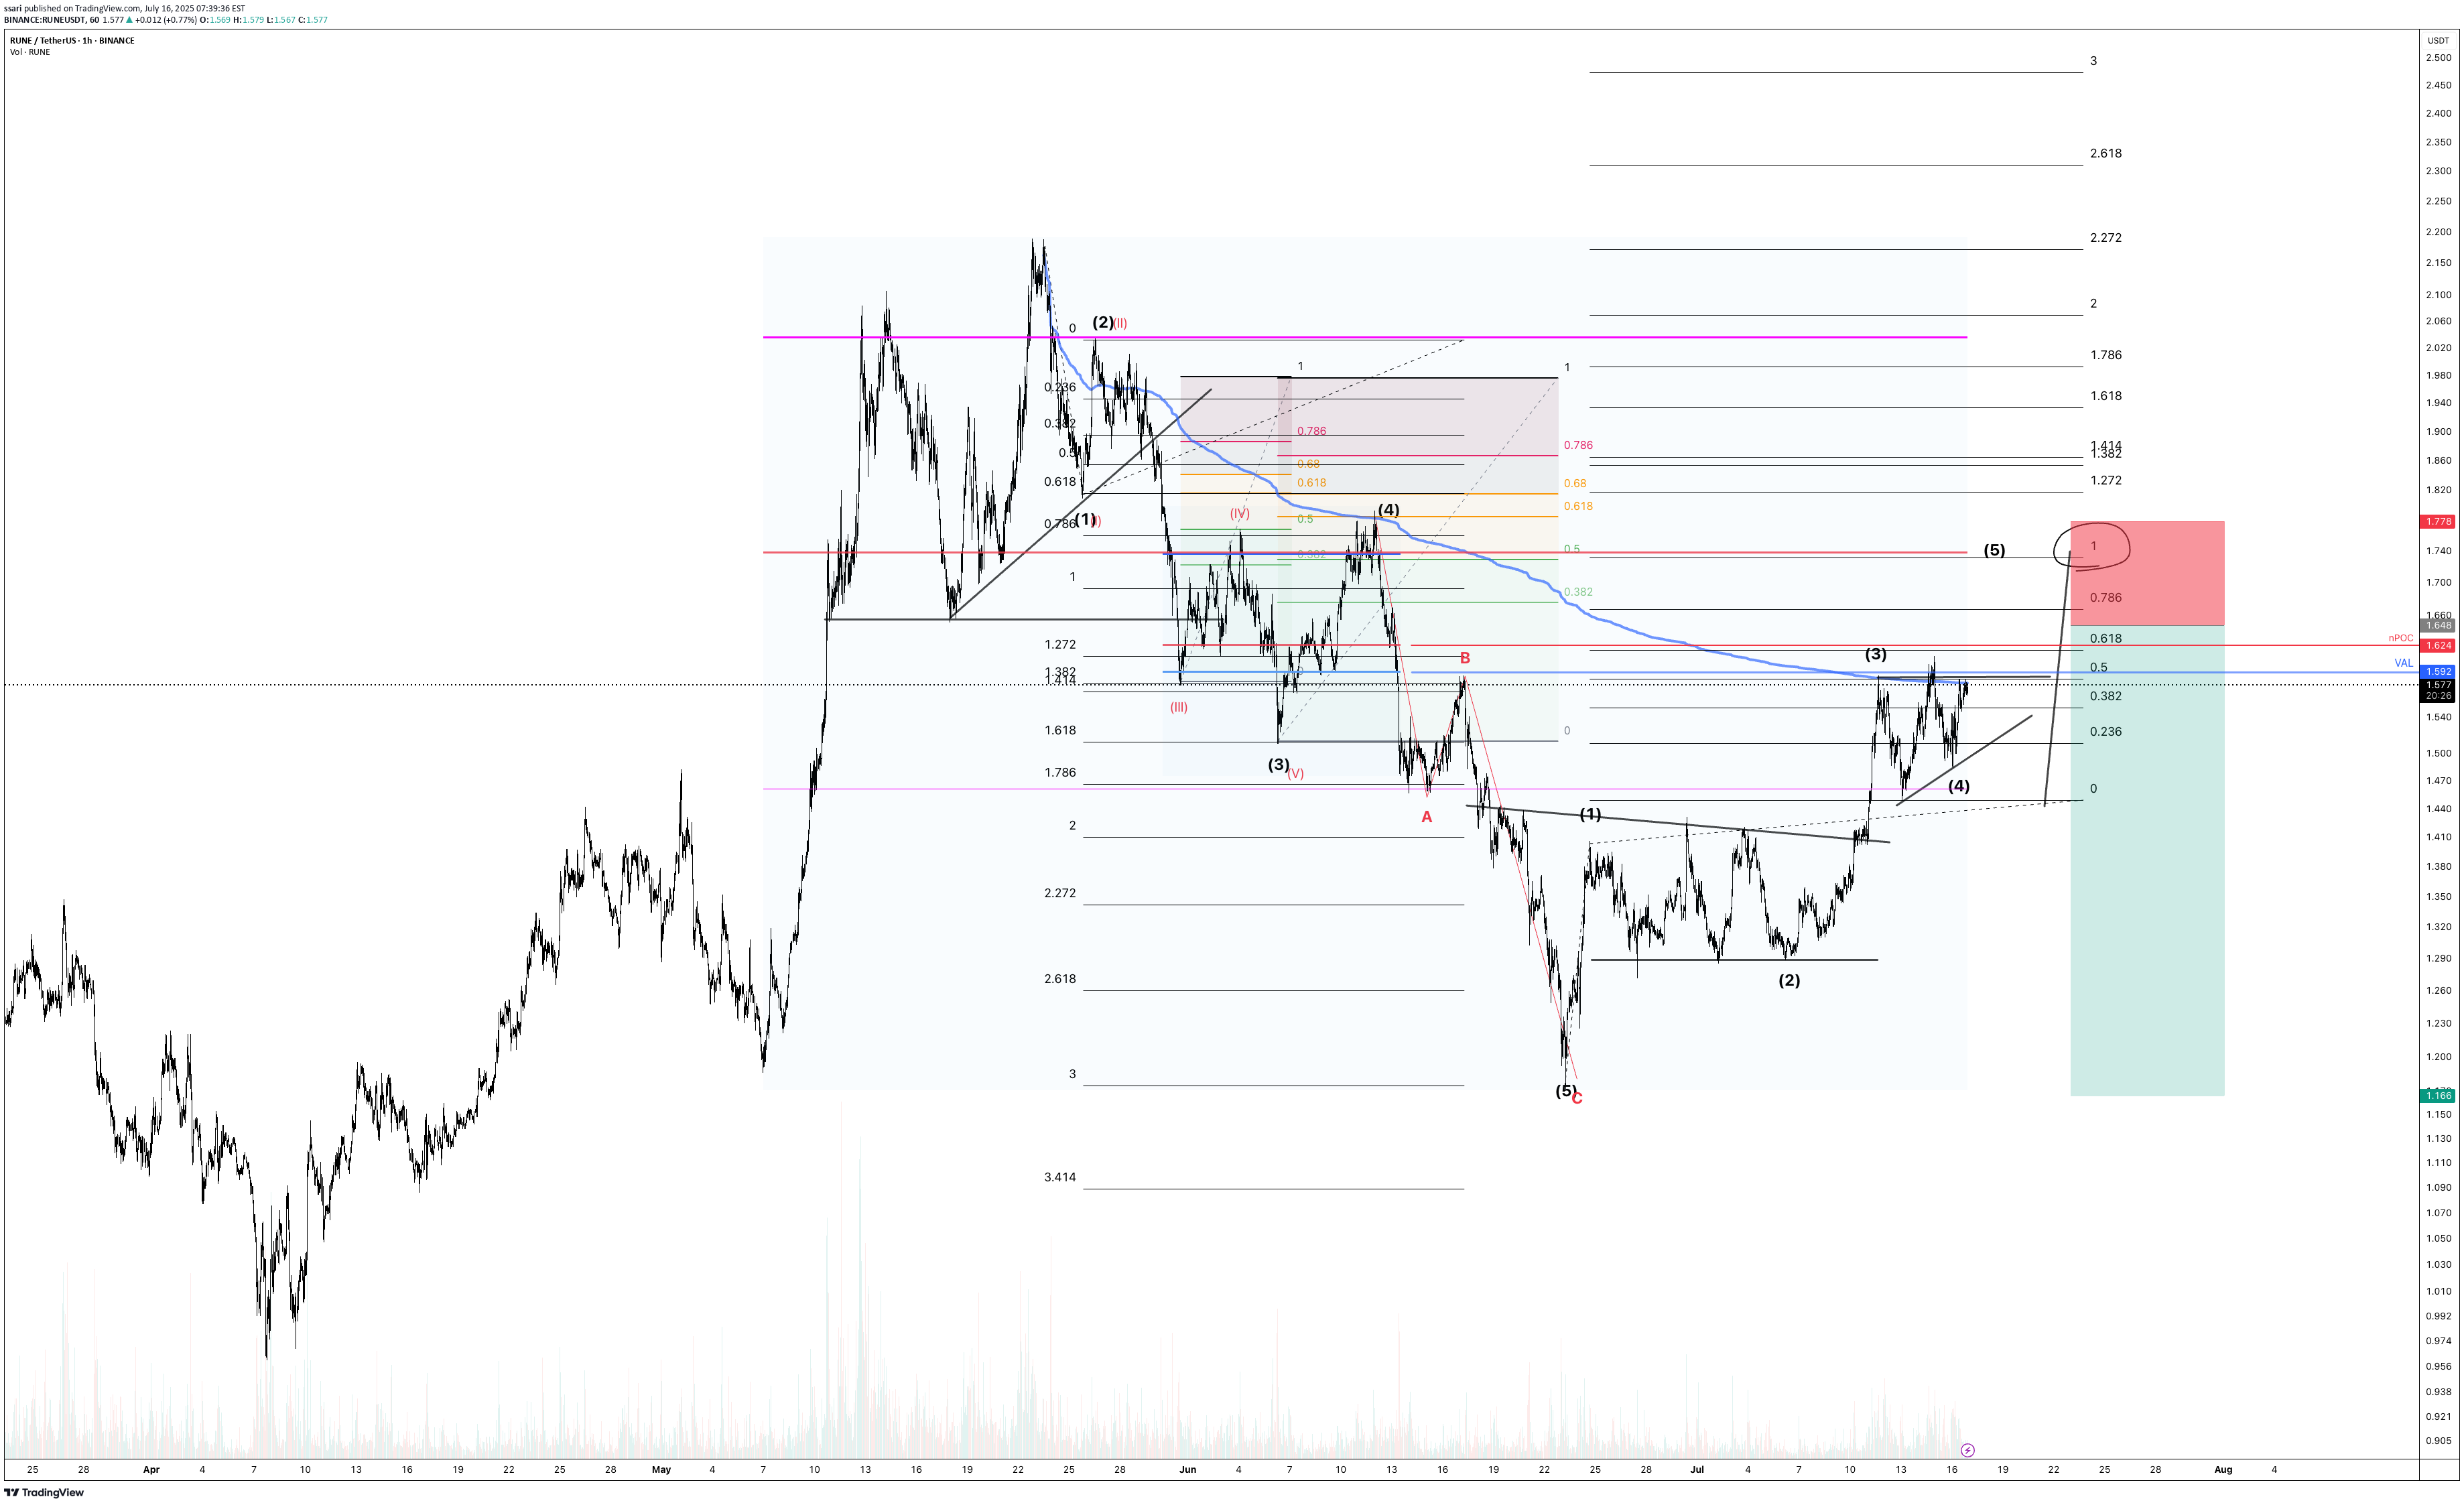
Hi Traders, RUNE has some more highs to do, however based on the structure, I would not bet it will go much. My interests is finding that trade to short when it comes to Alt coins. With my TA approach, Wave 5 might just equal Wave 1 length. Along with some confluences of FVP levels, we might just get this right. Time will time. All the best, Regards, S.SAri
ssari
BTC (Y25. P2.E3).AB=CD scenario
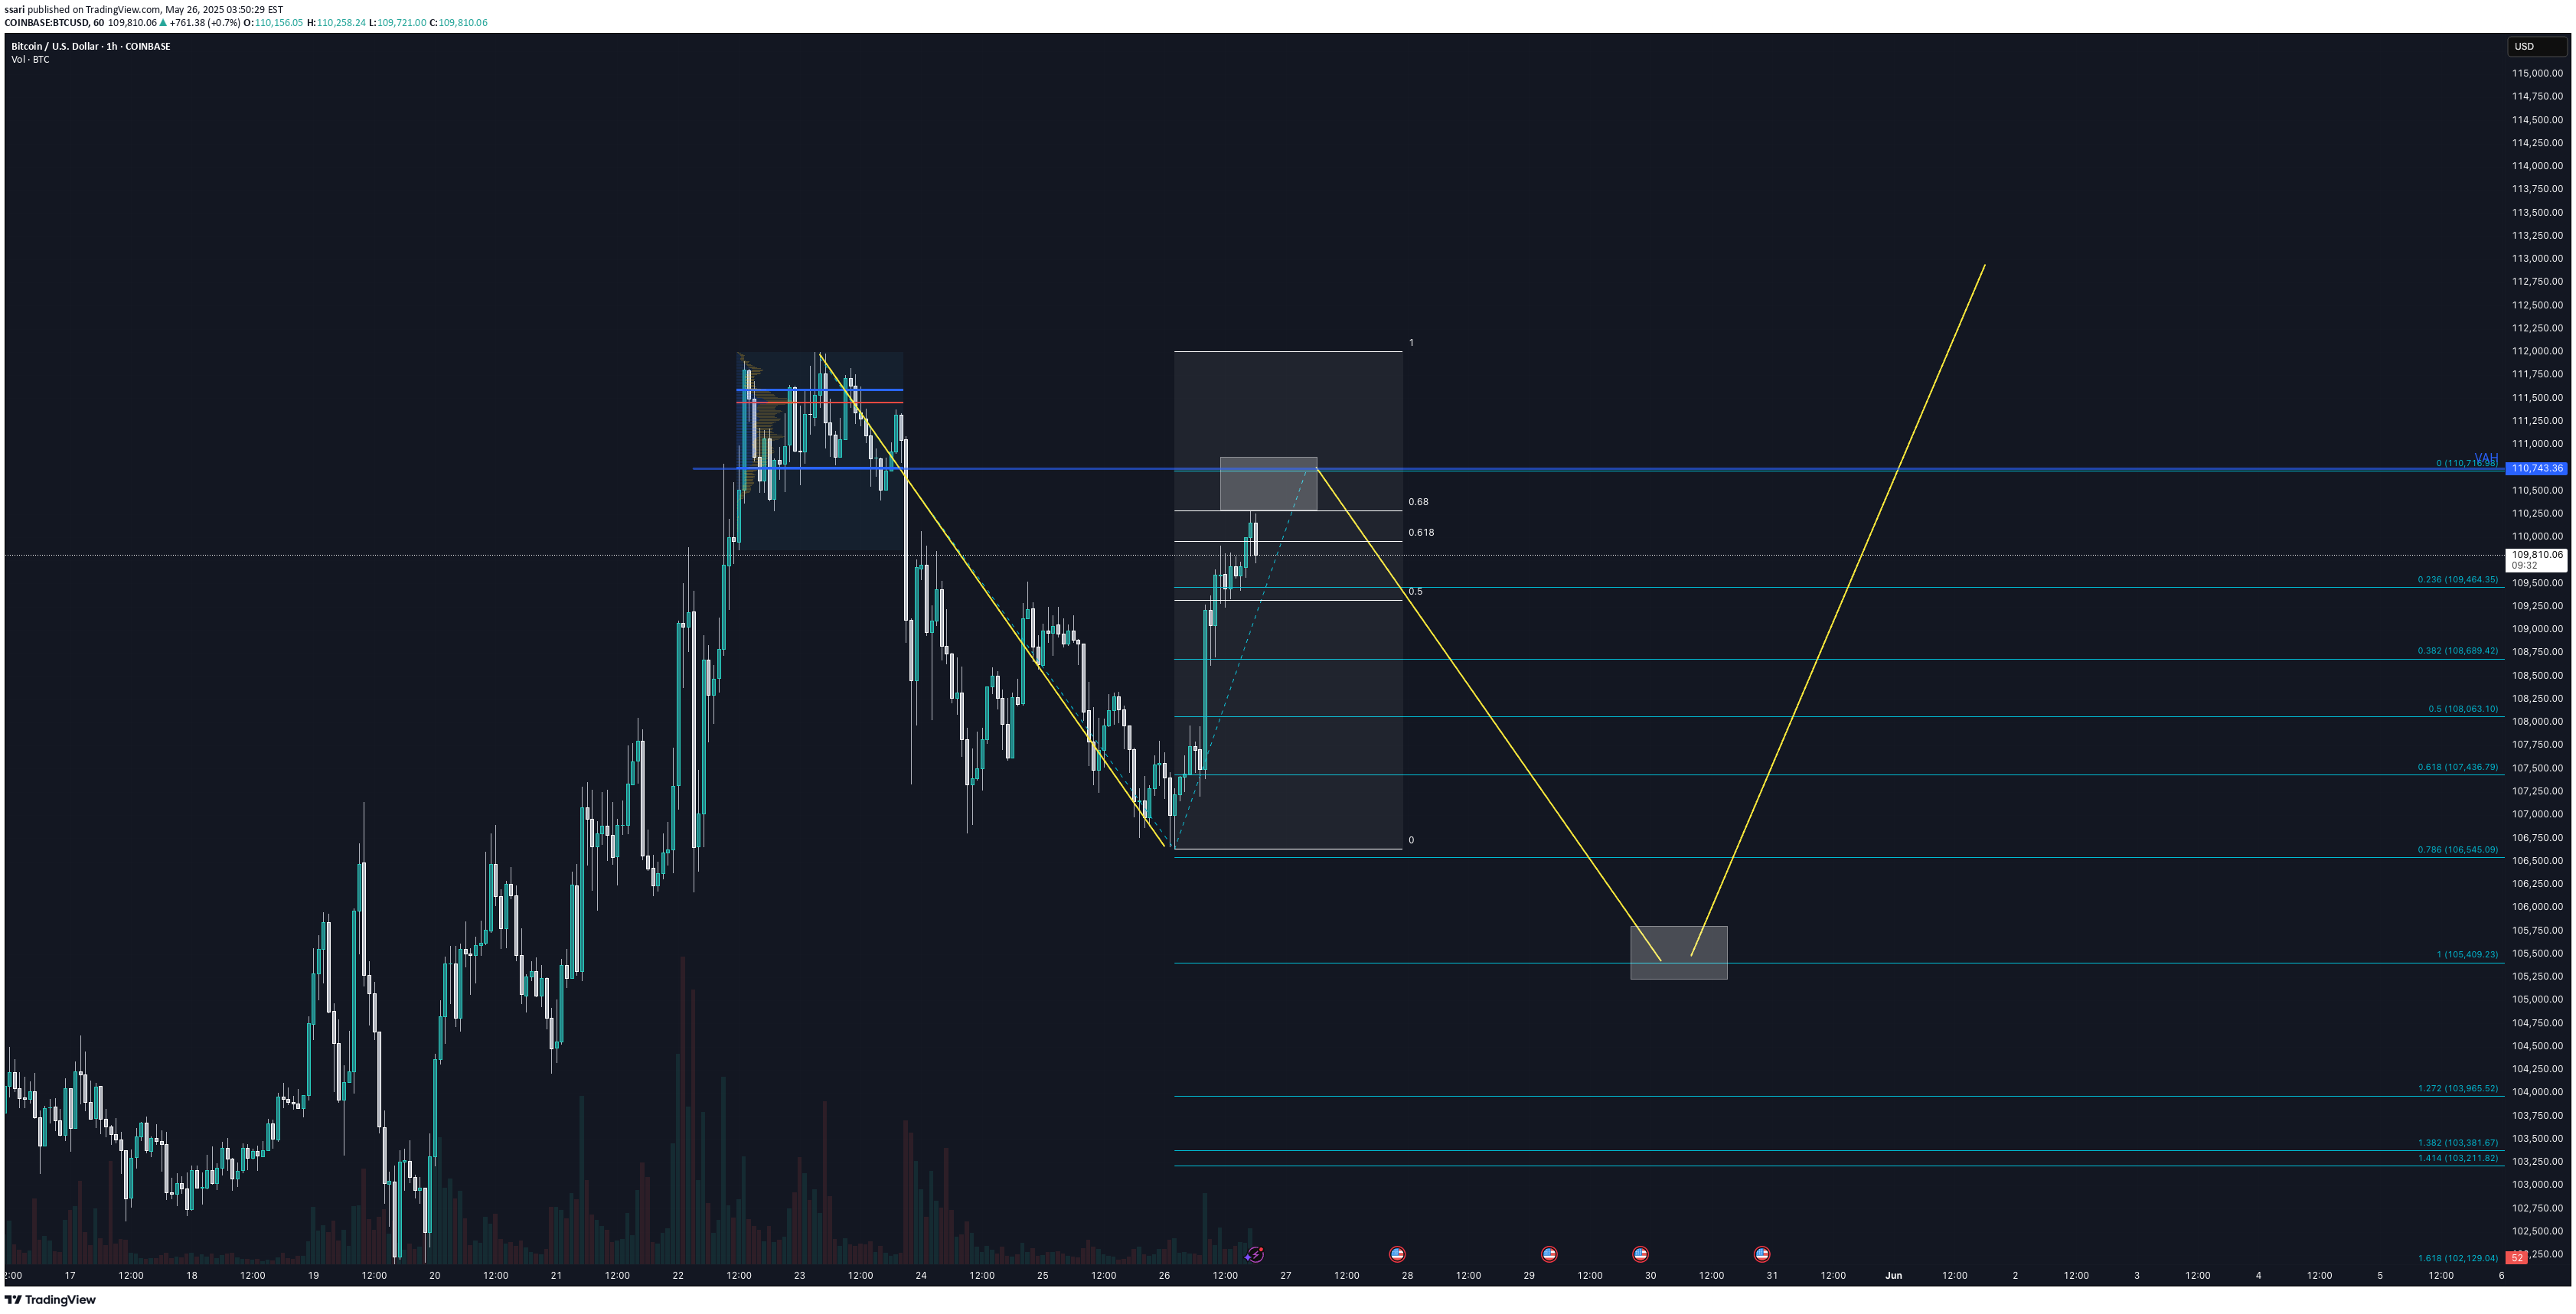
Hi traders, In the past, ATH's have made consistent pullbacks soon after with 14%. This time round I do expect the same, to shake out before we do new highs. Macro wise, I still have the Cup and Handle targets. Short term, this aligns well with my support levels. For now, the VAL or neckline is likely to be resistance. We had a obvious descending wedge breakout, its hit its target. and now we should range, consolidate here before price makes a decision. For more updates, come to our forum. All the best, S.SAri
ssari
BTC (Y25.P2.E1) Have 2 scenarios
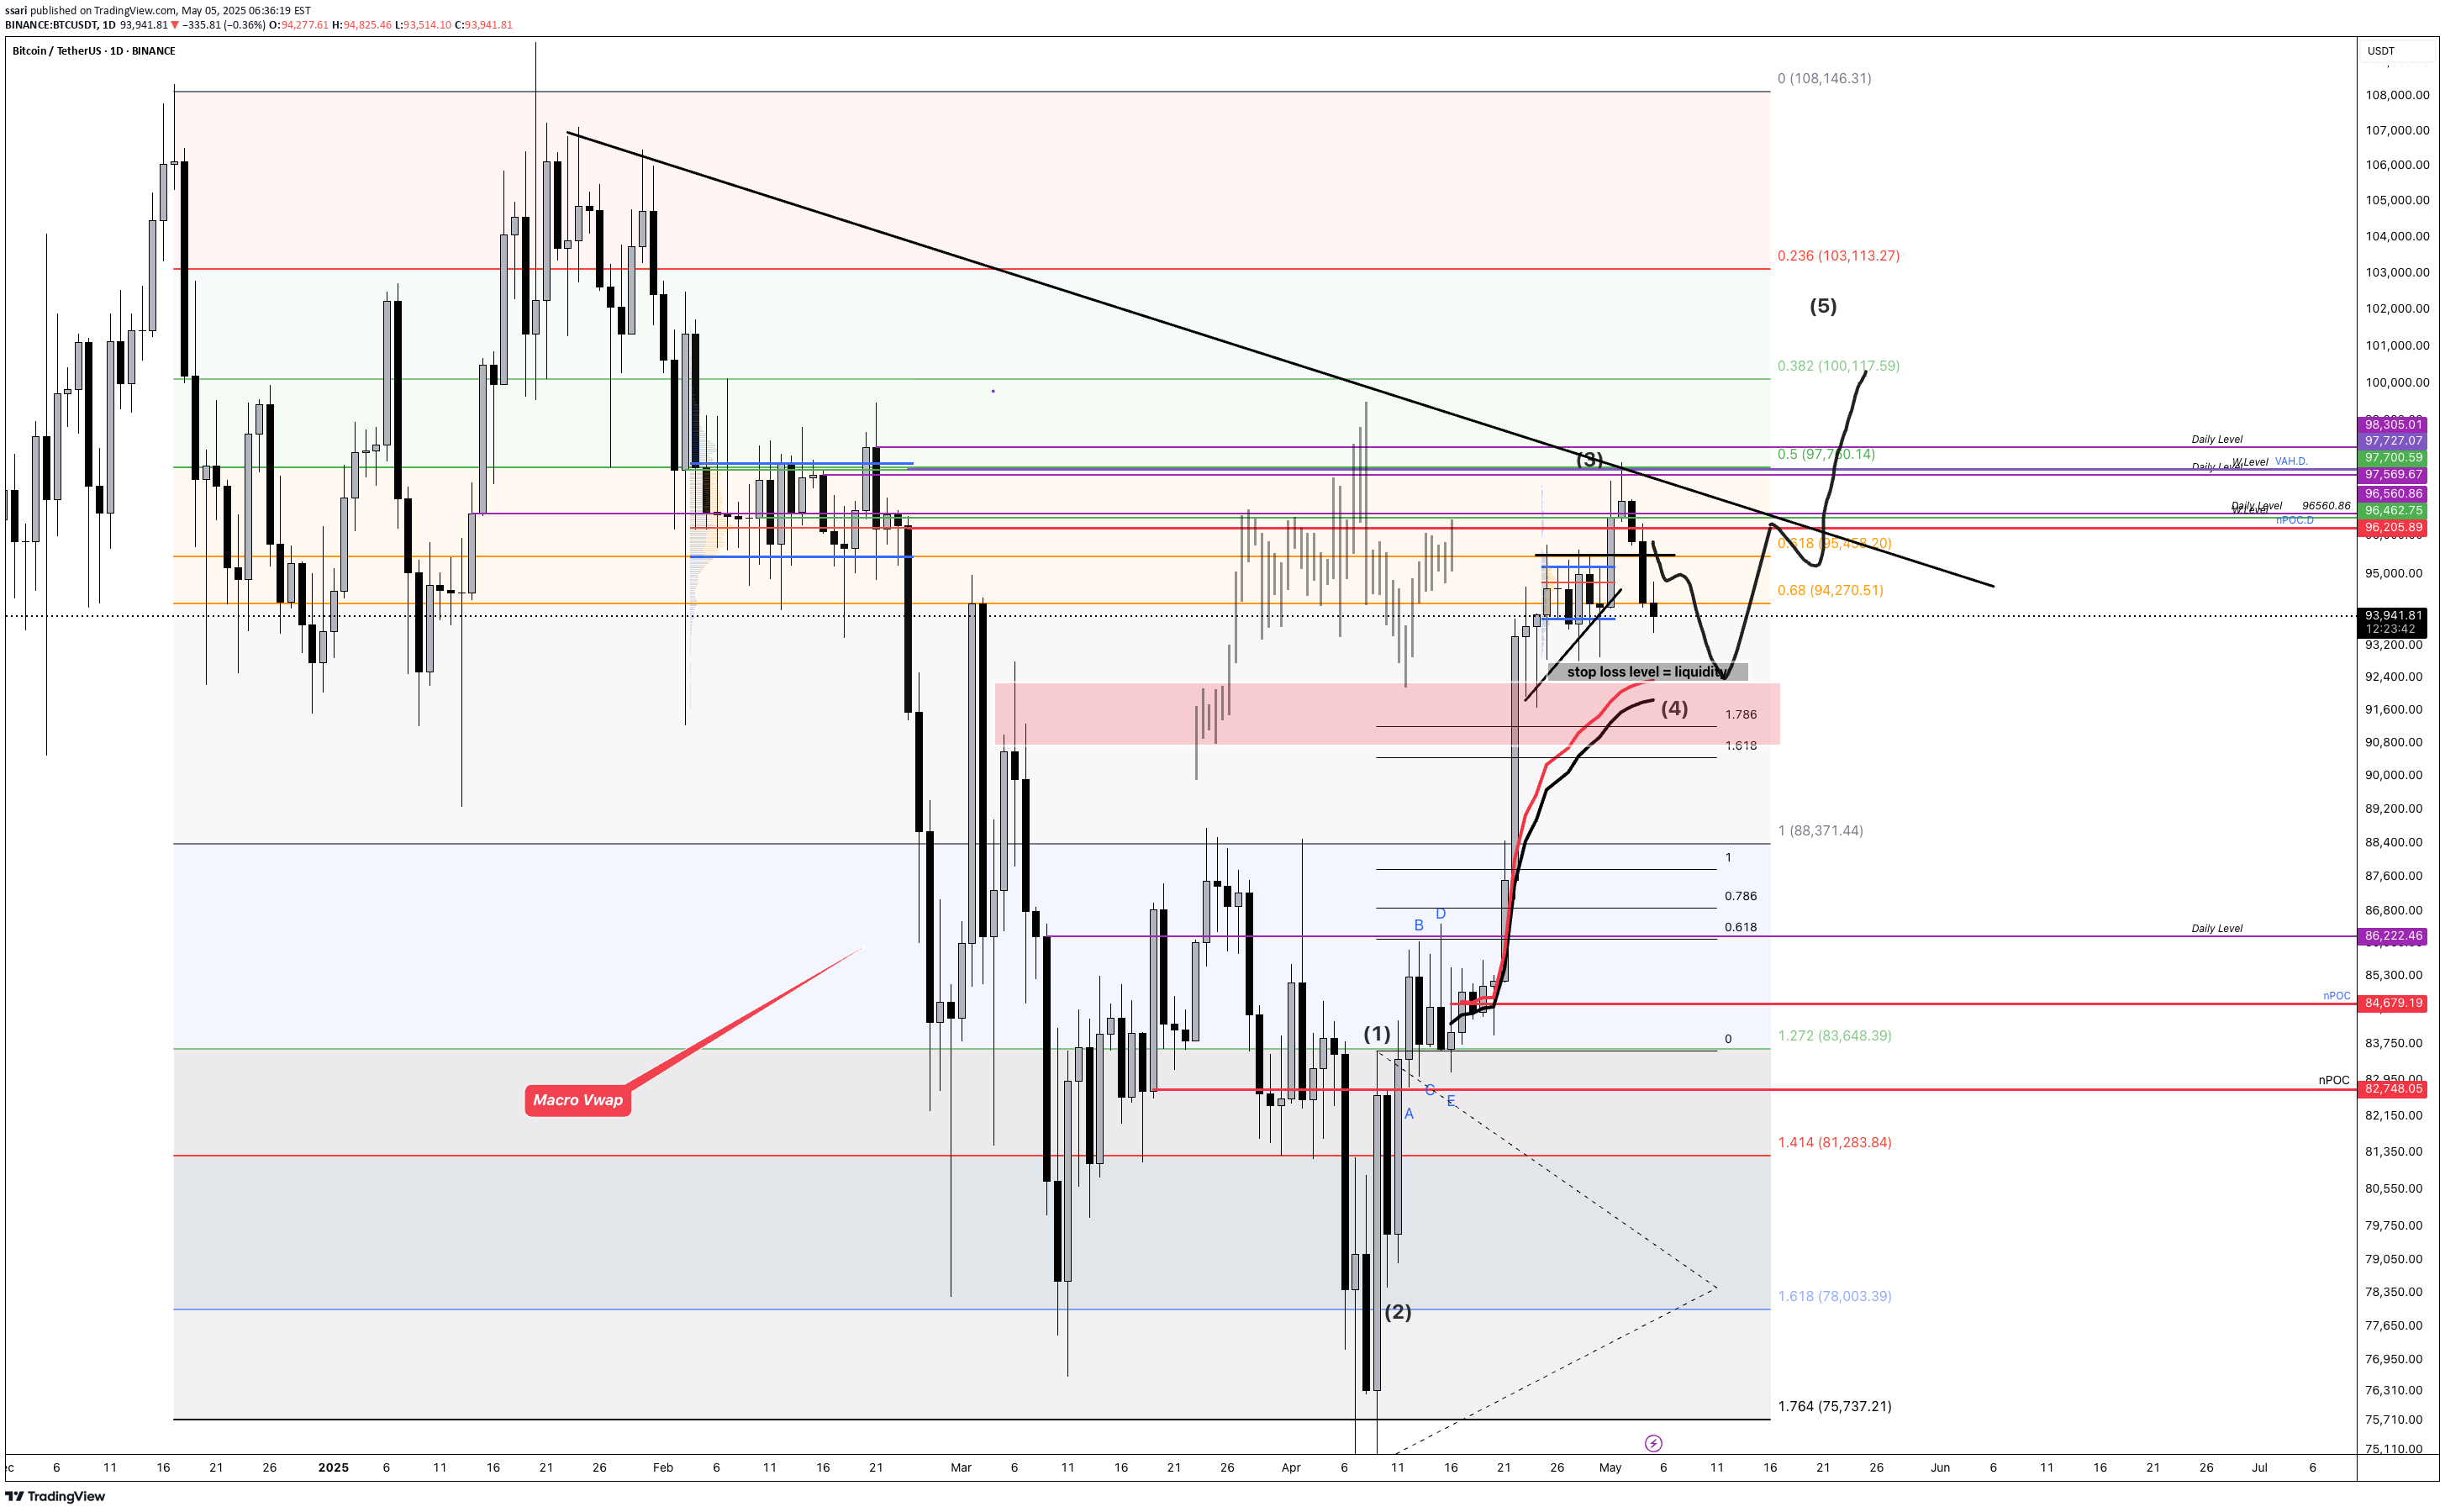
Hi Traders, I won't use words as the charts do the job if you can read charts. Scenario #1, price moves up from here Scenario #2, price sweeps the lows for liquidity. A fractal is aligned with it. I'm looking to enter the trade big at the lows with Avwap, EMAs and liquidity making a strong case. Here are short term levels based on our approach. All the best, Regards, S.SAriEnd result was the anchored vWap was support
ssari
VIRTUAL (Y25.P1.E1). Looking for capitulation

Hi traders, We have seen this play out many times. If we hit this level, I believe its the buying zone as pivot 1 of 5 wave to complete accumulation range. How will it perform after that is hypothetical and not worth giving an opinion until we see more price action. Virtual fits the typical ALTs wave 5 count to the top filling standard versions of a fibonacci aligned with 5 impulse waves to the top. Similarly, I'm looking for a diagonal ending bear market that we just witnessed. This might align well with the ALT season , OTHERS chart or BTC dominance reversal level. All the best, S.SAri
ssari
SEI (Y25.P1.E1) 2 scenarios.

Hi Traders, This is not trading advice, only hypothesis on ABC move where length of A = BC, hence confluence to previous accumulation range in 2023. The other is breakout trade where this is an accumulation range and we use the fib fan to find main resistance trend line. Lets see how this turns out... I'm not interest in trading this as yet until I see more parts to the puzzle. All the best, S.SAri
ssari
PEPE (Y25.P1.E1). Top is done.
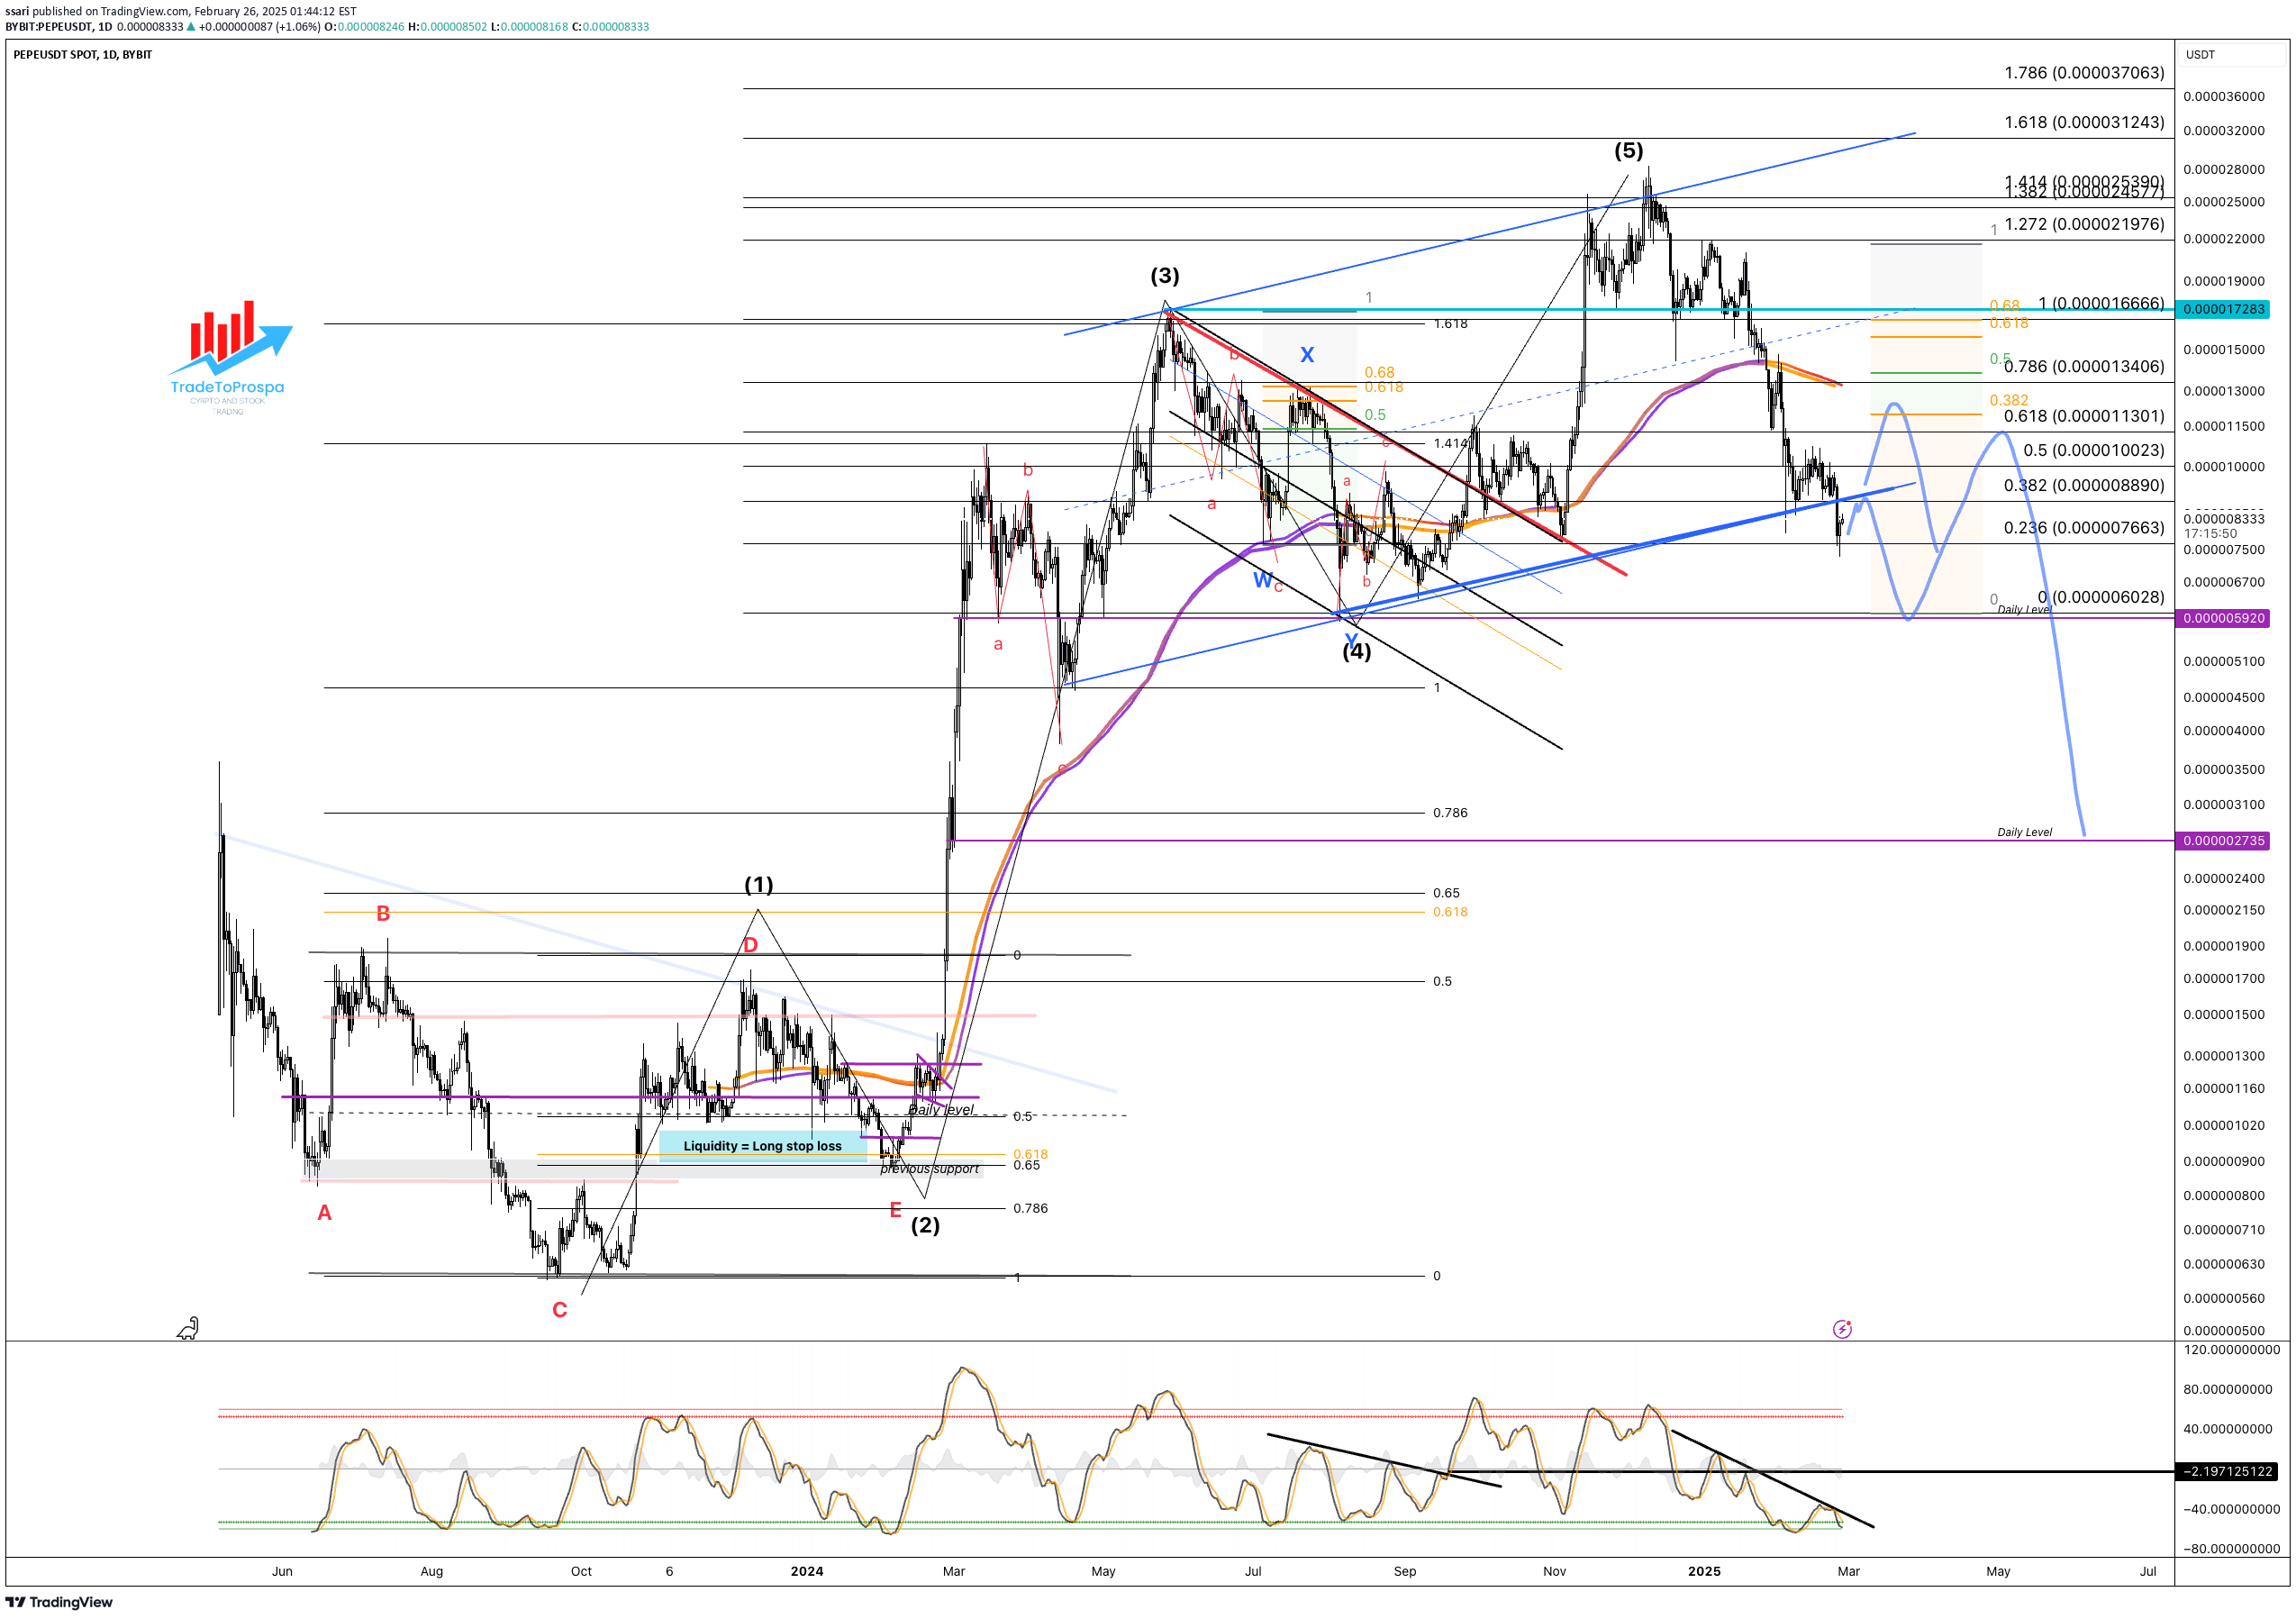
Hi Traders, Diagonal wave 5 confirmed in my opinion. From a wyckoff perspective, I see this as distribution with wave 2 to 3 in progress. The neckline is clear, the grinding support line has been compromised so refer to the wyckoff models for the last stages before it drops. Hence I'm looking for a nice spot to short. The indicator might help a little to find an entry for a long or short in the coming days or weeks. All the best, S.SAri
Disclaimer
Any content and materials included in Sahmeto's website and official communication channels are a compilation of personal opinions and analyses and are not binding. They do not constitute any recommendation for buying, selling, entering or exiting the stock market and cryptocurrency market. Also, all news and analyses included in the website and channels are merely republished information from official and unofficial domestic and foreign sources, and it is obvious that users of the said content are responsible for following up and ensuring the authenticity and accuracy of the materials. Therefore, while disclaiming responsibility, it is declared that the responsibility for any decision-making, action, and potential profit and loss in the capital market and cryptocurrency market lies with the trader.