
someshrenen
@t_someshrenen

What symbols does the trader recommend buying?
Purchase History
پیام های تریدر
Filter
someshrenen
ETH LONG SETUP
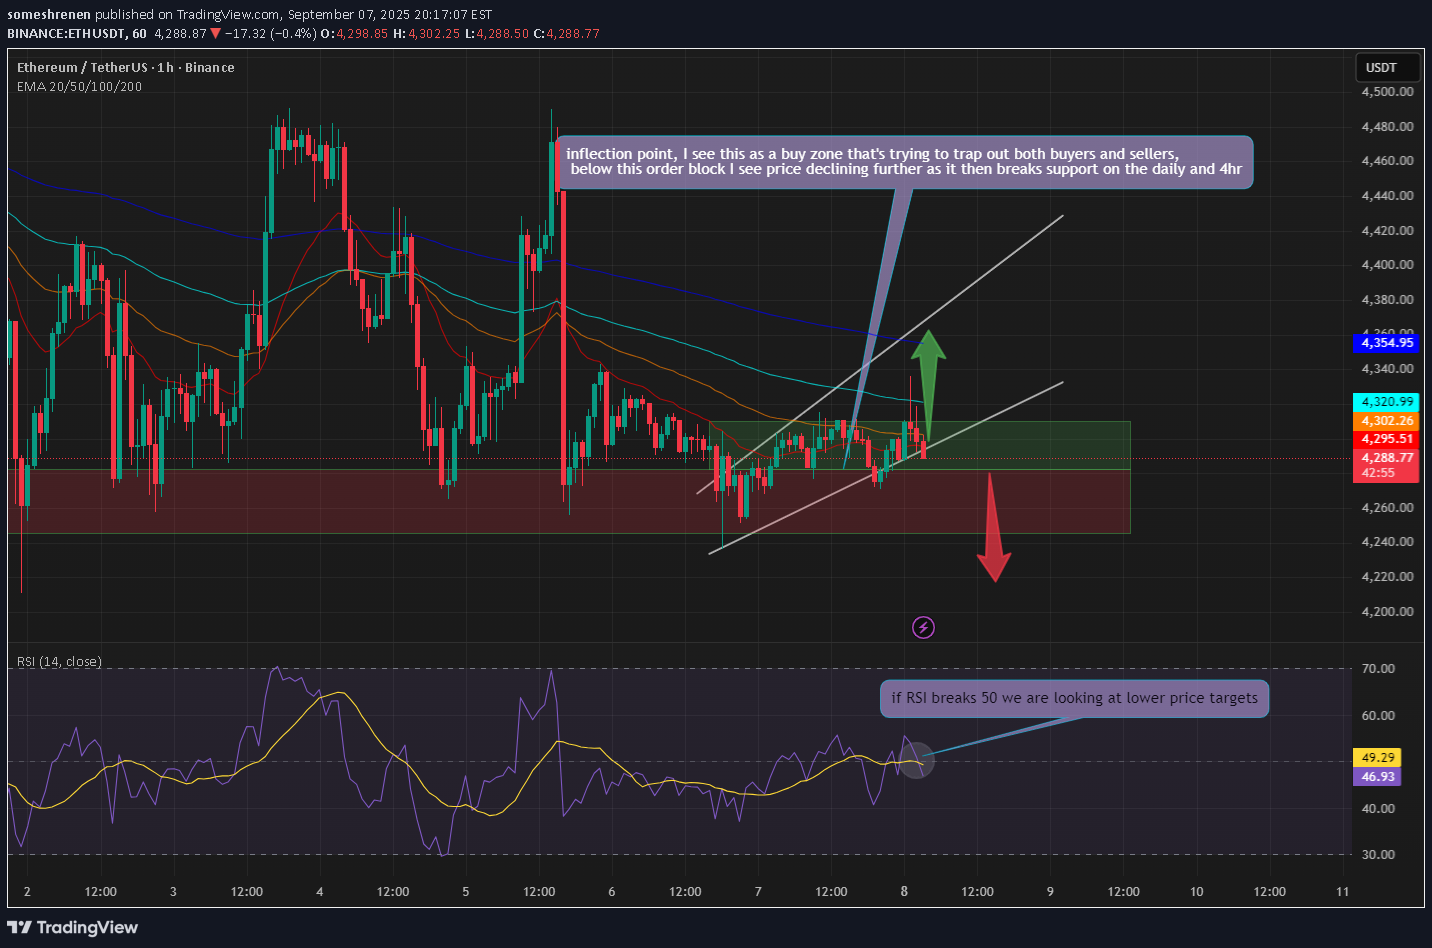
Below are key levels to watch $4300 Hold on 4hr and 1hr could sustain bullish momentum Eth went lower over the weekend to $4236 which now enables the bears to target lower prices the 4hr EMA was held on Saturday and bullish momentum was seen at those levels, a break of the 4hr ema @4252 would send price action into bearish momentum on a longer time frame In my opinion breaking the $4280 level will invalidate most bullish momentum and the next but of support comes in at $4250 which itself will create more bearish momentum if it gets there. Even with all these bearish indicators, I do see price action currently swaying towards the bullish side on lower time frames, We are looking for a retest and gold of $4300 on higher time frames. thoughts ? lets get this bread together !!!!
someshrenen
Gold’s Hidden Geometry: Descending Channels and Breakouts
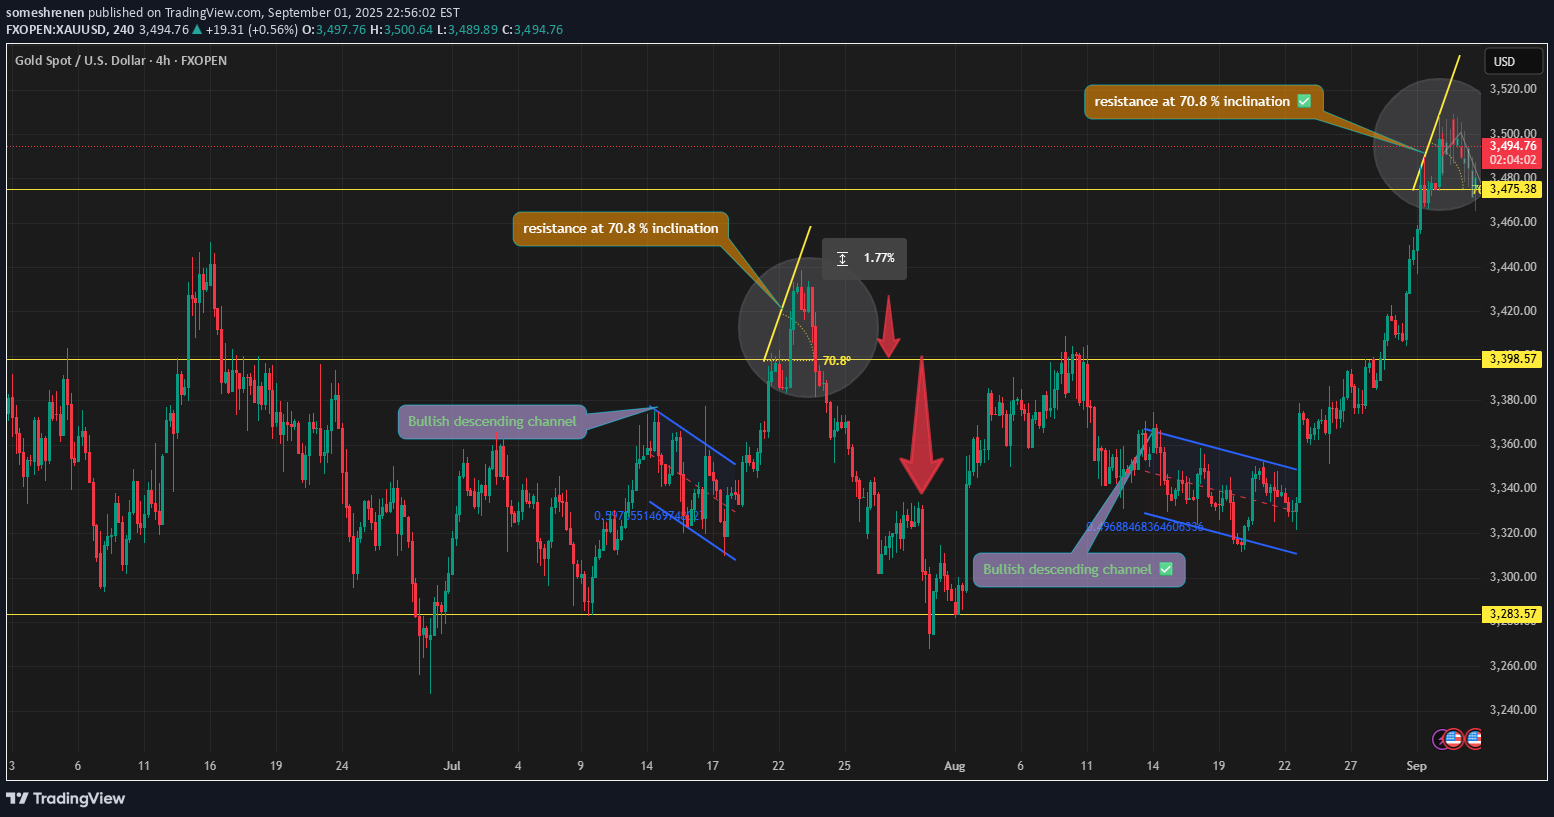
Gold may look chaotic at first, but zoom in and you’ll see repeating geometry at work. On this chart, two clear descending channels (falling channels) appeared. They appeared bearish and price kept stepping lower. But look what happened.... both resolved into sharp bullish breakouts. > Sometimes weakness is just a setup for strength Then comes the math, breakout inclinations hit around 70.8°, a steep angle that often marks exhaustion or reversal zones(well probably not when country X invades country Y). Gold sprinted up quickly, but that kind of slope rarely holds forever, it burns out fast. > Steep angles often mark exhaustion or reversal zones Happy trading....
someshrenen
Fractile nature of gold

Monitoring Gold over a monthly timeframe We can look to the charts to form an opinion on whether gold has a fractile nature or not. The first blue parallel channel lasted 3 years and the price of gold went up around 176% going from $706 to $1911. I've noticed how gold beautifully forms an almost perfect representation of previous price action. If it does indeed play out as such ( which it already 90% is ) we could see gold @$2804. Here are indicators and data that support that, just keep in mind fundamentals and World economics do play a major role and inflation data is KEY. - I have two main channels for this fractile "cycle". Its the two blue ones. To calculate the expected move for this cycle I used the same date range and also the measured move from the channel to get the %. I did not use 176% as the expected move because my charts are not logarithmic. - The D2 peaks explained on chart - A1 bottom explained on chart This is the direction Id like to think gold will go. Remember to always prepare for all scenarios and stay safe!
someshrenen
Gold Long

- We can see a mini fractile forming on Gold - The fractile start on the 28th of FEB - This looks like it could push gold above the 2046 Resistance > Key levels to watch Bull Case - 2046 - 2050 - 2065.5 Bearish Case - 2042 - 2036 - 2024
someshrenen
A clear road to understanding

Bitcoin like most other high risk assets are seeing a decrease in demand because of the state of the economy, therefore nobody can accurately predicts its rash movements. All we can do is look at the hand we've been dealt and play accordingly, so lets look at the cards in our hand. Our biggest obstacle is the downwards sloping resistance coming in all the way from $69 000. 2nd is the resistance from $29 000. Another rejection from this resistance could possibly lead BTC to fall towards the next biggest support near $14 000. BTC has still held monthly support @$20 000 so this could be a good support on a monthly timeframe, bare in mind Bitcoin could go to $14000 and still hold the monthly $20 000 support although unlikely. I only see a move being confirmed once we successfully break, retest, hold the downwards slopping resistance and break the $29 000 level. We could still be trading withing these ranges well into mid 2023 as we are looking at a bigger timeframe. Heres an article that covers important dates and news. Have a great day cointelegraph.com/news/the-fed-the-merge-and-22k-btc-5-things-to-know-in-bitcoin-this-week?utm_source=coincodex&utm_medium=referral
someshrenen
No bull just facts pt1

Historical Facts - The resistance holds us down for a period no less than 60 weeks/bars - Pattern only breaks once we test the resistance and fail, followed by a test of support then lastly followed by break, - This is the most likely route for bitcoin under neutral/good conditions, we can get all the technical factors in a row but the geopolitical events are out of our hands, the only thing we can do is be wise and prepare for any scenario HAVE A GREAT DAY - Renen.M
someshrenen
looking at btc mathematically

notice how the time horizon for the head and shoulders formation lines up exactly with the decending resistance , we should expect a decision by either bulls or bears by 23rd-28th jan. I will only trade once the charts give me the information needed and play of a valid move, in my opinion this information will only be presented by 23rd-28th jan . good luck to all
someshrenen
no bears just bulls pt3

we all see different things on the charts and its good to see the perspective of others aswell, I would like to share mine as I get a good shot of dopamine when I get likes but mostly to be part of the community. A. We have broken the resistance line holding us down since 06 Dec which isint the biggest hurdle. B. We have a perfect w formation on the 4hrly chart which is a very bullish pattern to appear on the 4hr chart. C. We are trading in an important range between $48 440 and $49 250, It is crucial to hold this range. D. We have finally gotten that 4hr close above $49 200 but we really need a daily close above to be o the good side. Now onto the juicy part.... E. In approximately 1D and 20hrs we will meet the resistance that has held us down since $69 000, This will be the biggest hurdle in my opinion, I will not make a trade based on what I think will happen, It is best to wait for confirmation of either a breakdown or breakout and play accordingly BUTTT the sign are pointing towards a santa clause breakout but this is btc and it always suprises us. If you like this idea check out PT1 and 2!!! Have a blessed christmas and stay saucy.One more thing, we would need substantially more volume when approaching the resistance holding us down since $69 000I was right about the breakout, now expecting a retest of the downward sloping resistance
someshrenen
no bears just bulls pt2

A. We've broken the RSI downtrend since we were at $69 000 B. We are still in a daily downtrend so there is always the possibility of a pullback as we are still creating lower highs and lower lows, if we manage to close a 4hr candle above the $49 300 mark which was the previous high that would be extremely bullish. Then we can expect a christmas pump towards $53 000 atleast. C. we will remain in a daily downtrend until we clear $53 000.Everything is going as expected . we got the close above $49 300 now we are on the way to $53 000.
someshrenen
No words just facts, no bears just bulls

no words although.... A. Anything can happen, historically we have never failed a breakout of this pattern since 2018 + bullish divergence on the daily RSI. B. History does not repeat itself but boy is it always is it always similair. For example this could be that one time it breaks back down then shoots back up and inversely it could be the first time it breaks down, The odds favour the bulls though. C This is most likely the bottom but with btc anything can happen so always prepare.We got a pump exactly where we should to make this pattern valid. We also usually spend 1-3 months within this retest area and this is what im looking for. - 4hr/daily close above $49 300 this week - To hold $48 850 on the daily timeframe we could moon from here but going of past movements we should only expect a moon late january or early february,Looks as if the support is now acting as resistance and the high of $69 000 can be seen as just a fake out, this is not bad news however as this means it is closely following its price action movement.
Disclaimer
Any content and materials included in Sahmeto's website and official communication channels are a compilation of personal opinions and analyses and are not binding. They do not constitute any recommendation for buying, selling, entering or exiting the stock market and cryptocurrency market. Also, all news and analyses included in the website and channels are merely republished information from official and unofficial domestic and foreign sources, and it is obvious that users of the said content are responsible for following up and ensuring the authenticity and accuracy of the materials. Therefore, while disclaiming responsibility, it is declared that the responsibility for any decision-making, action, and potential profit and loss in the capital market and cryptocurrency market lies with the trader.