
sabiotrade
@t_sabiotrade

What symbols does the trader recommend buying?
Purchase History
پیام های تریدر
Filter
sabiotrade
Bitcoin - Consolidation

#trading_idea 💥💥💥💸#Bitcoin - More Correction Dawnwards ?The 1H chart indicates a downward correction in the leading cryptocurrency. A divergence is observed between the price and the MACD indicator, which is currently in the oversold zone, suggesting a potential rebound.🔼If the price rebounds from the trendline next target is in 105000 - 106000.🔽Otherwise, a slide towards 100000 is possible. 😎 Hit "👍" if you believe the Bitcoin will rise and "👎" if you think it will drop.Let us know—are you a Bitcoin bull or bear?➡️➡️ TRY SABIOTRADE NOW
sabiotrade
GOLD Correction Up

#trading_idea 🔔👑#Gold- Correction Upwards!#trading_idea (sabiotrade.click/tg)🔔👑#Gold- Correction Downwards💰 The price is testing the resistance zone around 2650. The MACD is in a neutral zone but potentially signals an upward movement. All eyes are on U.S. inflation data this week.🔼If the price breaks through 2650 level, the further rise to 2672 and higher is possible. 🔽Otherwise, a slide to 2625 support zone and lower could be expected.What are your thoughts on gold🤔 ? We’d love ❤️🔥to hear them and discuss!🔴 Click "👍" if you think the price will rise and "👎" if you think it will fall.➡️➡️ TRY SABIOTRADE NOW
sabiotrade
Gold Going Down

#trading_idea 🔔👑#Gold- What Next!💰 Gold continues to move within a downward channel. The price is testing support at 2614, with both the B&B and MACD indicators signaling a potential move lower.Suggestion:🔽Sell. 🎯 TP at 2600🔴 Click "👍" if you think the price will rise and "👎" if you think it will fall.➡️➡️ TRY SABIOTRADE NOW
sabiotrade
Gold Going Up

#trading_idea 🔔👑#Gold- New Targets Up!💰 Hello, gold enthusiasts! Yesterday's targets were achieved, and it looks like the upward correction might continue. An ascending triangle pattern has formed, and the momentum indicator suggests a potential continuation of the uptrend.Suggestion:🔼Buy. 🎯 TP at 2619🔴 Click "👍" if you think the price will rise and "👎" if you think it will fall.➡️➡️ TRY SABIOTRADE NOW
sabiotrade
GOLD Correction Upward
#trading_idea 🔔👑#Gold- Correction Upwards!💰 The upward correction continues. An ABCD pattern is visible, and the Momentum indicator suggests potential bullish strength in gold.Suggestion:🔼Buy. 🎯 TP at 2700🔴 Click "👍" if you think the price will rise and "👎" if you think it will fall.➡️➡️ TRY SABIOTRADE NOW
sabiotrade
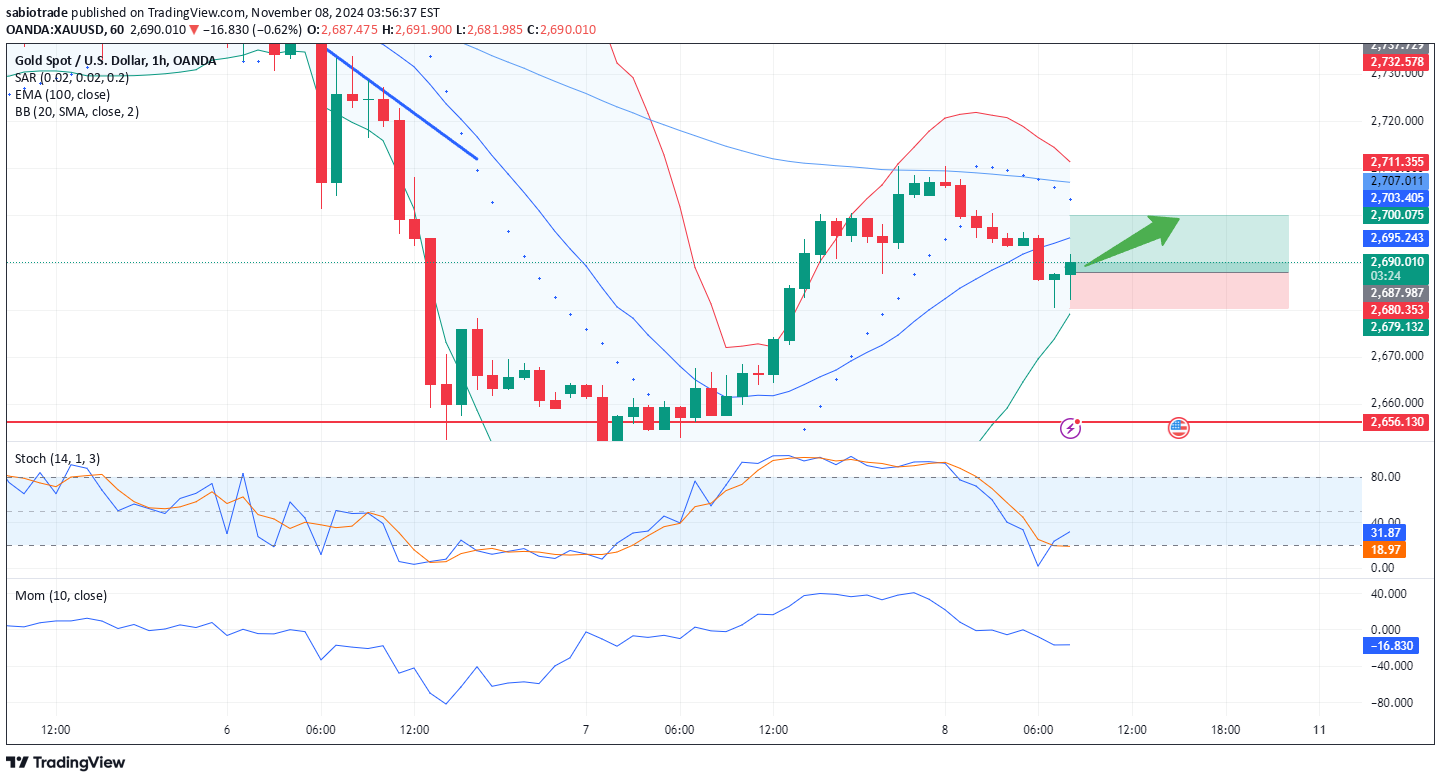
Gold Falling

#trading_idea 🔔👑#Gold- Falling Down! ↘️Gold Slips Amid Strong Dollar, U.S. Election Reaction ☄️📉Gold has dropped below the key $2,700 level as the dollar strengthens with U.S. election developments. Momentum indicators have dipped below the trendline, suggesting further declines, while the 20-day moving average remains significantly higher.Suggestion:🔽Sell. 🎯 TP at 2680🔴 Click "❤️" if you agree with this idea and "👎" if you think it will fall.➡️➡️ TRY SABIOTRADE NOW
sabiotrade
Gold - Correction Dawnwards

#trading_idea 🔔👑#Gold- More Correction Downwards💰 Gold is testing support at 2778. There is more divergency with Momentum indicator and the price slide under trendline and MA(20).Suggestion:🔽Sell. 🎯 TP at 2770🔴 Click "❤️" if you agree with this idea and "👎" if you think it will fall.➡️➡️ TRY SABIOTRADE NOW
sabiotrade
GOLD - Ready to Jump More

#trading_idea 🔔👑#Gold- Ready to Rise More?💰 Gold prices lingered near record highs on Tuesday, supported by uncertainty surrounding the upcoming U.S. presidential election, while investors awaited data for clues on the Federal Reserve's interest rate trajectory. Let’s take a look at the 4H chart. We can see the formation of an Ascending Triangle, which signals a potential bullish breakout. However, despite the strong upward movement, there’s a divergence with the Momentum indicator, suggesting a possible downside correction.🔼If the price break through 2757, the further rise to 2770 is possible. 🔽Otherwise, a slide to 2749 support zone and lower could be expected.What are your thoughts on gold🤔 ? We’d love ❤️🔥to hear them and discuss!🔴 Click "👍" if you think the price will rise and "👎" if you think it will fall.➡️➡️ TRY SABIOTRADE NOW
sabiotrade
GOLD Rising

#trading_idea #Gold 💡👑#Gold- Watch ResistanceOn the 1h chart, the price is testing 2740 resistance. Gold is trading in a strong upward channel. The MACD and Bears&Bulls both points to possible continuation of rise In addition there is an ascending triangle pattern formed.🔼If the price break through 2740, the further rise to 2750 is possible. 🔽Otherwise, a slide to 2720 support and lower could be expected.🔴 Click "👍" if you think the price will rise and "👎" if you think it will fall.➡️➡️ TRY SABIOTRADE NOW
sabiotrade
Gold - May Rise

👑#Gold- Watch ResistanceOn the 1h chart, the price is testing 2655 resistance. There is "Hammer" candlestick pattern. The CCC points to a possible move up. #trading_idea ✔️✔️✔️🔼Buy Gold on a breakout of the 2655 resistance 🎯TP: 2660Smash 👍if you are bullish on Gold!➡️➡️ TRY SABIOTRADE NOW
Disclaimer
Any content and materials included in Sahmeto's website and official communication channels are a compilation of personal opinions and analyses and are not binding. They do not constitute any recommendation for buying, selling, entering or exiting the stock market and cryptocurrency market. Also, all news and analyses included in the website and channels are merely republished information from official and unofficial domestic and foreign sources, and it is obvious that users of the said content are responsible for following up and ensuring the authenticity and accuracy of the materials. Therefore, while disclaiming responsibility, it is declared that the responsibility for any decision-making, action, and potential profit and loss in the capital market and cryptocurrency market lies with the trader.