
rylee2267
@t_rylee2267

What symbols does the trader recommend buying?
Purchase History
پیام های تریدر
Filter
BTCUSDT

Bitcoin seems poised for a notable shift following the completion of a classic technical setup. The price has recently pushed above a critical level and appears to be testing this threshold again, a move that often hints at further momentum. Should this pattern hold, we might see a robust climb toward higher targets, potentially well beyond current levels. Keep an eye out for signs confirming this direction.
ANKRUSDT

ANKR/USDT 1D Chart OverviewThe ANKR/USDT pair on a 1-day timeframe displays a descending trendline extending from its peak in December 2024. The current price stands at 0.020429, reflecting a 1.69% increase. With Bollinger Bands and buy/sell signals in play, the chart suggests a possible short-term bounce near critical support levels. Check the chart for more insights!
VET/USDT

VeChain (VET) showing signs of life on the weekly chart. Recently broke above a long-term descending triangle with decent volume, hinting at a potential trend reversal. Price currently at $0.02576, just below the breakout level of $0.02744. Watching for a retest of this level as support-could be a key area for bulls to defend. Next resistance around $0.034003 if momentum holds. Indicators showing early bullish signals but confirmation is key. Thoughts?
ETH/USDT 1W - Reversal on the Horizon?
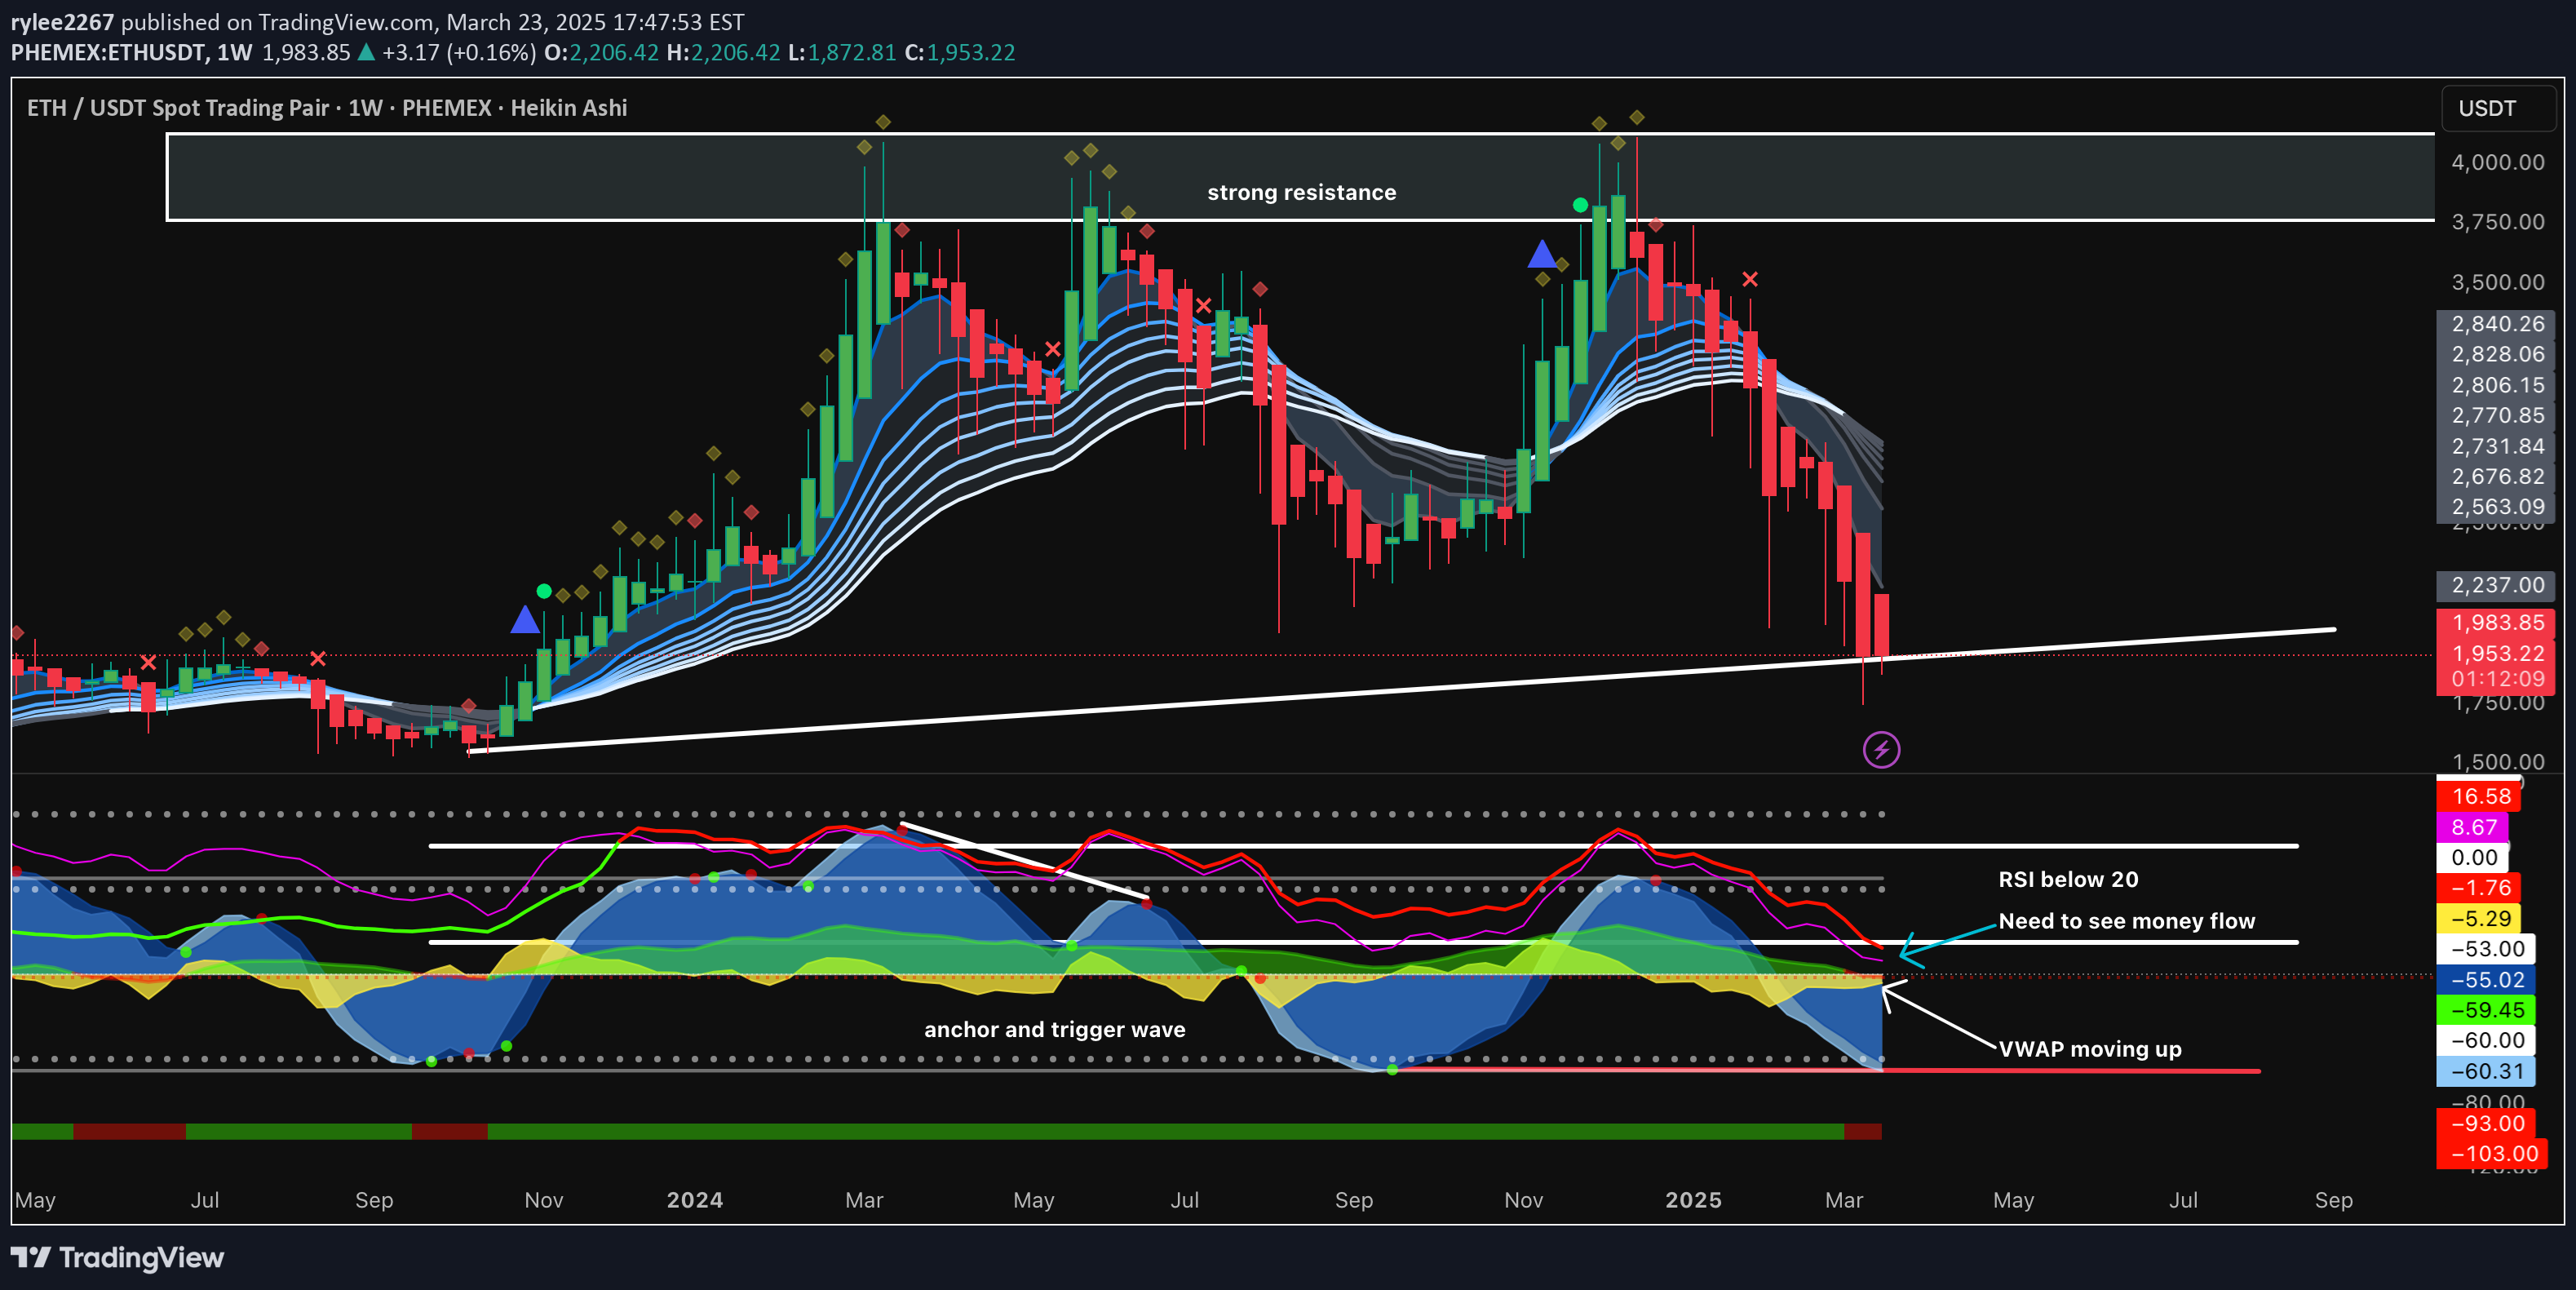
Price hitting strong resistance after a steep decline. RSI below 20, showing oversold conditions. VWAP moving up, but money flow needs to step in. Watching for a breakout or rejection—what do you think?
ETHUSD

Current Price: ETH is at $1,955.56, up 4.66% this week, but the chart shows a significant decline from its peak around $2,800 in late 2024.Ichimoku Cloud: The price has broken below the Ichimoku Cloud, a bearish signal. The Tenkan-sen (red line) and Kijun-sen (blue line) have crossed bearishly, and the Chikou Span (lagging line) is below the price, confirming the downtrend. The cloud ahead is thinning, which could indicate a potential trend shift if the price reclaims it, but for now, the bearish momentum is dominant.Trendline: There’s a long-term ascending trendline (white line) that ETH has respected since mid-2024. The price is currently testing this trendline around the $1,900–$2,000 level, which could act as a critical support.
BTCUSDT

The chart is a weekly BTC/USD chart, and while the Ichimoku Cloud is present in the upper section, the lower panel appears to be a Market Cipher B indicator, which is an all-in-one oscillator combining multiple algorithms (WaveTrend, RSI, Money Flow, VWAP, etc.) to provide trading signals. Market Cipher B is known for its green and red dots, which signal potential buy and sell opportunities, and its money flow and VWAP components, which are explicitly mentioned in the chart's annotation.Key Observations:Price Action & Ichimoku Cloud The price has broken below the Ichimoku Cloud, a bearish signal. The Tenkan-sen (red line) and Kijun-sen (blue line) have crossed bearishly, and the Chikou Span (lagging line) is below the price, confirming the downtrend.The cloud ahead is thinning, which might indicate a potential shift in trend if the price can reclaim the cloud, but for now, the bearish momentum dominates.Market Cipher B Indicator (Lower Panel) The lower panel shows a Market Cipher B setup with money flow, VWAP, and momentum waves. The annotation "Positive Money Flow with VWAP moving up" suggests that despite the price decline, there’s underlying buying pressure or accumulation. However, this doesn’t align with the current price action, indicating a potential divergence.The chart shows red dots on the Market Cipher B panel, which typically signal bearish momentum or a potential downtrend continuation. These red dots often indicate that the price is moving lower, as confirmed by the recent red Heikin Ashi candles.The money flow indicator (likely the green and red waves in Market Cipher B) shows a positive trend, which could hint at a potential reversal if buying pressure increases. However, the price needs to confirm this with a break above key resistance levels.Heikin Ashi Candles The Heikin Ashi candles have turned red, indicating a strong bearish trend. The lack of significant wicks on these candles suggests that sellers are firmly in control.Support & Resistance Immediate support is around $82,000–$83,000, with a stronger support level at $75,000, which aligns with the lower edge of the Ichimoku Cloud projection.Resistance is at $87,000–$88,000, where the price previously struggled before the drop.Sentiment & Volume The sentiment bar on the right shows extreme fear (-93.00 to -103.00), which could indicate a capitulation point, often a precursor to a reversal. However, this also suggests that panic selling might push prices lower in the short term.Volume has been higher on red candles (down moves) compared to green candles (up moves), indicating stronger selling pressure.Updated TradingView PostBTC/USD (1W) - Market Cipher Signals Bearish Momentum, But Is a Reversal Brewing?Posted by [YourUsername] on Mar 23, 2025Hey traders, let’s dive into this weekly BTC/USD chart! We’ve got a mix of Ichimoku Cloud and Market Cipher B indicators giving us some interesting signals. OverviewBitcoin has dropped to $84,046.69, down 3.49% this week after peaking near $92,000 in early December 2024. The chart shows bearish momentum, but there are hints of underlying buying pressure that could signal a potential reversal. Let’s break it down.Key ObservationsIchimoku Cloud Breakdown BTC has broken below the Ichimoku Cloud, a strong bearish signal. The Tenkan-sen and Kijun-sen have crossed bearishly, and the Chikou Span is below the price, confirming the downtrend.The cloud ahead is thinning, which could mean a trend shift if the price reclaims it, but for now, bears are in control.Market Cipher B Insights The lower panel is showing Market Cipher B, with the note "Positive Money Flow with VWAP moving up." This suggests accumulation or buying pressure despite the price decline—a potential bullish divergence.However, we’re seeing red dots on the Market Cipher B indicator, which typically signal bearish momentum. This aligns with the recent price drop and red Heikin Ashi candles, indicating that sellers are still dominant.The money flow (likely the green/red waves in Market Cipher B) is trending positively, which could hint at a reversal if the price confirms with a break above resistance. Keep an eye on this divergence!Heikin Ashi Trend The Heikin Ashi candles are red with minimal wicks, showing strong bearish momentum. There’s little sign of buyer pushback at the moment.Support & Resistance Support is at $82,000–$83,000, with a stronger level at $75,000 (near the lower edge of the Ichimoku Cloud projection).Resistance sits at $87,000–$88,000, a key level to watch for any bullish reversal.Sentiment & Volume Sentiment is in extreme fear (-93.00 to -103.00), which could signal capitulation and a potential bottom. However, it also means panic selling might drive prices lower in the short term.Volume is higher on down moves (red candles), confirming selling pressure.My TakeThe bearish signals from the Ichimoku Cloud and Market Cipher B’s red dots suggest more downside in the short term, potentially testing $75,000 if $82,000 support breaks. However, the positive money flow and VWAP trend in Market Cipher B hint at underlying buying pressure, which could set the stage for a reversal if the price can break above $88,000 with strong volume. For now, I’m leaning bearish but watching for signs of a bottom.
Disclaimer
Any content and materials included in Sahmeto's website and official communication channels are a compilation of personal opinions and analyses and are not binding. They do not constitute any recommendation for buying, selling, entering or exiting the stock market and cryptocurrency market. Also, all news and analyses included in the website and channels are merely republished information from official and unofficial domestic and foreign sources, and it is obvious that users of the said content are responsible for following up and ensuring the authenticity and accuracy of the materials. Therefore, while disclaiming responsibility, it is declared that the responsibility for any decision-making, action, and potential profit and loss in the capital market and cryptocurrency market lies with the trader.