
rodulfox
@t_rodulfox

What symbols does the trader recommend buying?
Purchase History
پیام های تریدر
Filter
Signal Type
rodulfox
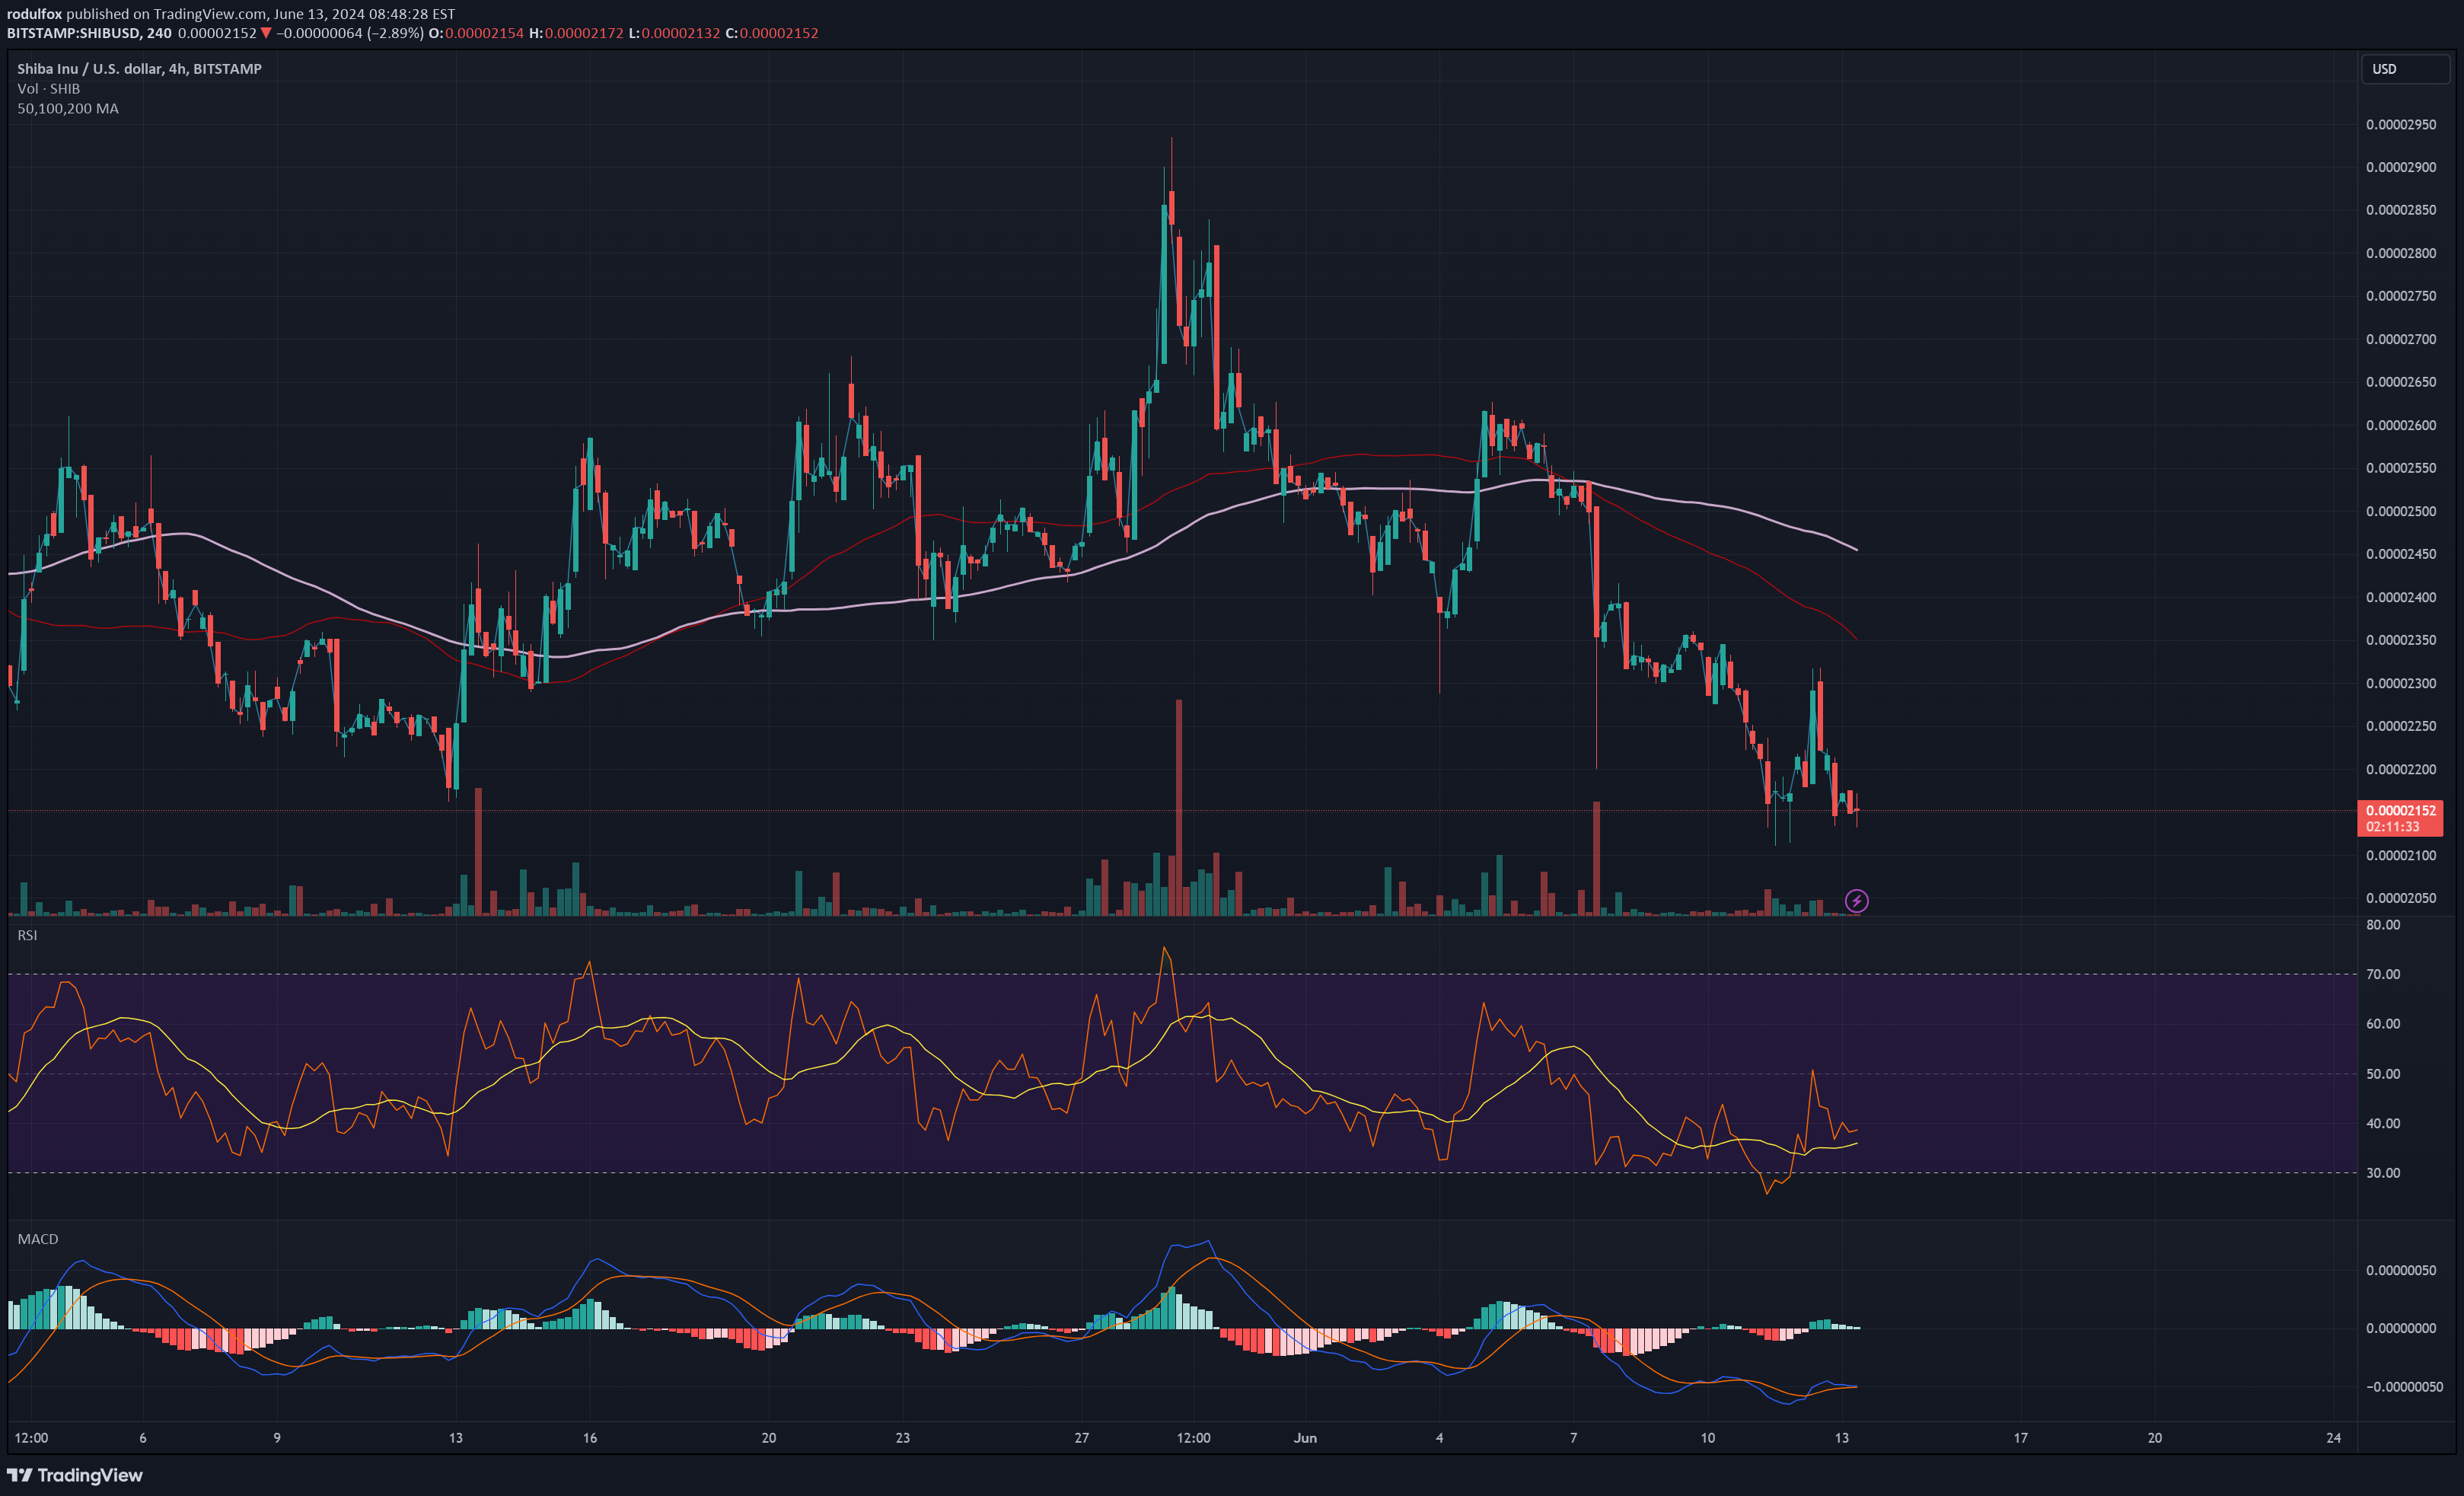
Trading Analysis of Shiba Inu ( SHIBUSD SHIUSD) - 4 Hour timeframe Overall Trend: Downtrend: The price being below the 50, 100, and 200-period moving averages since June 7th suggests a strong downtrend. Short-term movement: Difficult to assess: A 4-hour timeframe doesn't provide enough information to definitively say if there's a current uptick or just a small consolidation within the downtrend. Volume: High Volume: The volume of 140 billion is significantly higher than usual, which could indicate increased selling pressure or potentially a buying opportunity depending on price action. Momentum Indicators: RSI (30.00 - 40.00) : This indicates oversold territory. Oversold readings suggest the asset might be undervalued based on recent price movements, but they don't guarantee an immediate rebound. MACD: The MACD signals being below the histogram since June 7th confirms the downtrend in momentum. Summary: The technical analysis of SHIBA on a 4-hour timeframe leans bearish. The downtrend, high volume, oversold RSI, and MACD below the histogram suggest continued selling pressure. However, due to the limited timeframe, it's difficult to say for sure if there's a short-term reversal or just a pause in the downtrend. Here are some additional things to consider for a more comprehensive analysis: Longer timeframes: Analyze daily, weekly, and monthly charts to understand the bigger picture. News and Events: Look for any recent news or events that might be impacting the price of Shiba Inu. Market sentiment: Consider the overall sentiment in the cryptocurrency market. Disclaimer: This analysis is for informational purposes only and should not be considered financial advice. Always do your own research before making any investment decisions in cryptocurrency, as the market is highly volatile. "In this business if you're good, you're right six times out of ten. You're never going to be right nine times out of ten. I've found that when the market's going down and you buy funds wisely, at some point in the future you will be happy. You won't get there by reading: "Now is the time to buy".
rodulfox
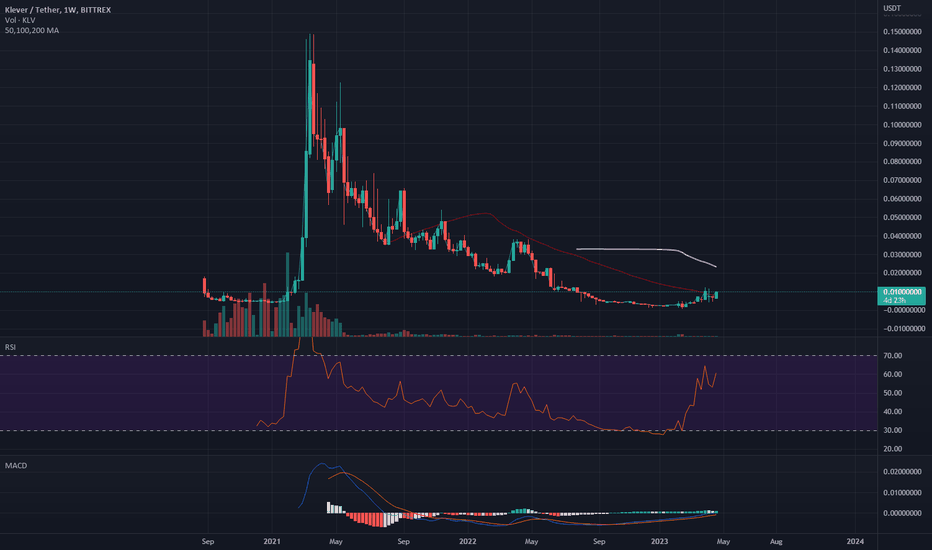
1W Chart, K KLVUSDT MACD : On September 2022, the signals pierced up from below the histogram and have been diving underwater since then, at this moment they are getting close to the surface. RSI : The signal bounced on January 2023 from below 30.00, and has been steadily moving up breaking the 60.00, bouncing down, finding support over 50.00 PRICE : Has been making short movements in a band between its ATL (All Time Low), below both 100MA and 200MA, testing the 100MA from below on March and again on April 2023, now after breaking this resistance should move up to test the 200MA resistance by the $0.02, which is the optimistic approach. "In this business if you're good, you're right six times out of ten. You're never going to be right nine times out of ten. I've found that when the market's going down and you buy funds wisely, at some point in the future you will be happy. You won't get there by reading: "Now is the time to buy". Today this ticker has a Volume on BITTREX of 4.3K, Market Cap of 59M. Good Luck! Gráfico de 1W, K KLVUSDT MACD : En septiembre de 2022, las señales se cruzaron desde debajo del histograma y han estado sumergidas bajo el agua desde entonces, en este momento se están acercando a la superficie. RSI : La señal rebotó en enero de 2023 desde debajo de 30.00, y se ha movido constantemente hacia arriba rompiendo los 60.00, rebotando hacia abajo y encontrando soporte por encima de 50.00 PRECIO : Ha estado haciendo movimientos cortos en una banda entre su ATL (All Time Low), por debajo de 100MA y 200MA, probando los 100MA desde abajo en marzo y nuevamente en abril de 2023, ahora después de romper esta resistencia debería subir para probar la resistencia de 200MA por los $0.02, que es el enfoque optimista. "En este negocio, si eres bueno, tienes razón seis de cada diez veces. Nunca vas a tener razón nueve de cada diez. Descubrí que cuando el mercado está cayendo y compras fondos sabiamente, en algún momento en el futuro serás feliz. Nunca verás un anuncio que diga: "Ahora es el momento de comprar". Hoy este ticker tiene un Volumen en BITTREX de 4.3K, Market Cap de 59M. ¡Buena suerte! “I believe in analysis and not forecasting.” / "Creo en el análisis y no en el pronóstico". REMEMBER : I am not a financial adviser nor is any content in this article presented as financial advice. The information provided in this blog post and any other posts that I make, and any accompanying material is for informational purposes only. It should not be considered financial or investment advice of any kind. One should consult with a financial or investment professional to determine what may be best for your individual needs. RECUERDE : No soy un asesor financiero y el contenido de este artículo no se presenta como asesoramiento financiero. La información provista en esta publicación de blog y cualquier otra publicación que haga y cualquier material que la acompaña es solo para fines informativos. No debe considerarse asesoramiento financiero o de inversión de ningún tipo. Se debe consultar con un profesional financiero o de inversiones para determinar qué es lo mejor para sus necesidades individuales.
rodulfox
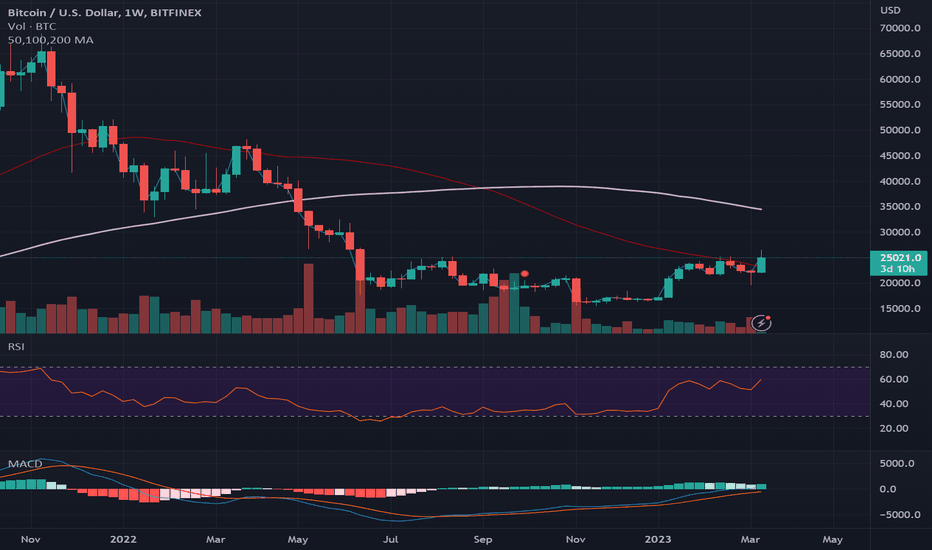
Last time I published a TA about Bitcoin was on May 23, 2018, at that moment its price was $7.6K, here we are back $20K later, coming back from the most recent correction... 1W Chart, BTCUSD MACD : On August 2022, the signals pierced up from below the histogram and have been diving underwater since then, at this moment they are getting close to the surface. RSI : The signal bounced on June 2022 from below 30.00, steadily moving up after softly testing twice on the 60.00. PRICE : Has been making short movements in a band between $15K & $24K, below both 100MA and 200MA, testing the 100MA from below twice on January and February 2023, now after breaking this resistance should move up to test the 200MA resistance by the $30K, which is the optimistic approach. "In this business if you're good, you're right six times out of ten. You're never going to be right nine times out of ten. I've found that when the market's going down and you buy funds wisely, at some point in the future you will be happy. You won't get there by reading: "Now is the time to buy". Today this ticker has a Volume on BITFINEX of 1K, Market Cap of 478B. Bitcoin has been declared death hundreds of times, as claimed on the Trading Platform eToro advertisement, published on March, 2018, available on my website. Good Luck! La última vez que publiqué un TA sobre Bitcoin fue el 23 de mayo de 2018, en ese momento su precio era de $7.6K, aquí estamos $20K después, regresando de la mas reciente corrección... Gráfico de 1W, BTCUSD MACD : En agosto de 2022, las señales se cruzaron desde debajo del histograma y han estado sumergidas bajo el agua desde entonces, en este momento se están acercando a la superficie. RSI : La señal rebotó en junio de 2022 por debajo de 30.00, moviéndose constantemente hacia arriba después de probar suavemente dos veces en 60.00. PRECIO : Ha estado haciendo movimientos cortos en una banda entre $15K y $24K, por debajo de 100MA y 200MA, probando el 100MA desde abajo dos veces en enero y febrero de 2023, ahora, después de romper esta resistencia, debería subir para probar la resistencia de 200MA en $30K, que es el enfoque optimista. "En este negocio, si eres bueno, tienes razón seis de cada diez veces. Nunca vas a tener razón nueve de cada diez. Descubrí que cuando el mercado está cayendo y compras fondos sabiamente, en algún momento en el futuro serás feliz. Nunca verás un anuncio que diga: "Ahora es el momento de comprar". Hoy este ticker tiene un Volumen en BITFINEX de 1K, Market Cap de 478B. Bitcoin ha sido declarado muerto cientos de veces, como se afirma en el anuncio de la Plataforma de Trading eToro publicado en marzo de 2018, disponible en mi sitio web. ¡Buena suerte! “I believe in analysis and not forecasting.” / "Creo en el análisis y no en el pronóstico". REMEMBER : I am not a financial adviser nor is any content in this article presented as financial advice. The information provided in this blog post and any other posts that I make, and any accompanying material is for informational purposes only. It should not be considered financial or investment advice of any kind. One should consult with a financial or investment professional to determine what may be best for your individual needs. RECUERDE : No soy un asesor financiero y el contenido de este artículo no se presenta como asesoramiento financiero. La información provista en esta publicación de blog y cualquier otra publicación que haga y cualquier material que la acompaña es solo para fines informativos. No debe considerarse asesoramiento financiero o de inversión de ningún tipo. Se debe consultar con un profesional financiero o de inversiones para determinar qué es lo mejor para sus necesidades individuales.
rodulfox
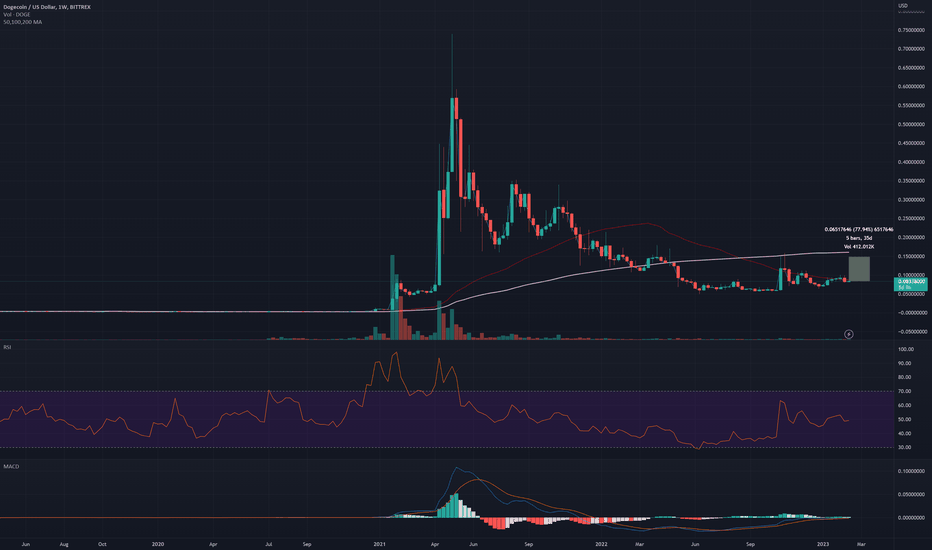
1W Chart, DOGEUSD , on February 14, 2023, the signals on MACD has been diving below the histogram since NOV2021 and started moving to the surface on August 2022, making their first push to break the ice on October 2022, sending the RSI from below 40 to 60 and the price pumping from $0.05 to $0,15, piercing both 100 & 200 days MA signals; The RSI signal reached 63 bounced back and was supported on 44 and is now facing NE staying steady over 40 after the price has been steadly climbing since October 2022, between $0.05 and $0.11, testing for the third time the 100 days MA signal from below, at this moment there is still plenty of room for the price to pierce the 100 days MA signal and test the 200 days signal by the $0.15 again, which is the optimistic approach, but remember "In this business if you're good, you're right six times out of ten. You're never going to be right nine times out of ten. I've found that when the market's going down and you buy funds wisely, at some point in the future you will be happy. You won't get there by reading: "Now is the time to buy". Today this ticker has a Volume of 443M with a Market Cap of 11.000M. Good Luck! Gráfico 1W, DOGEUSD , el 14 de febrero de 2023, las señales en MACD han permanecido sumergidas por debajo del histograma desde el Noviembre 2021 y comenzaron a moverse a la superficie en agosto de 2022, dando su primer impulso para romper el hielo en octubre 2022, enviando el RSI desde abajo 40 a 60 y el precio subiendo de $0,05 a $0,15, perforando las señales MA de 100 y 200 días; La señal RSI llegó a 63, se devolvió y se apoyó en 44 y ahora se enfrenta al NE manteniéndose estable sobre 40 después de que el precio ha estado subiendo constantemente desde el octubre 2022, entre $0,05 y $0,11, probando por tercera vez la señal MA de 100 días desde abajo, en este momento todavía hay mucho espacio para que el precio atraviese la señal MA de 100 días y vuelva a probar la señal de 200 días en $0.15, que es el enfoque optimista, pero recuerda: "En este negocio, si eres bueno, tienes razón seis de cada diez veces. Nunca vas a tener razón nueve de cada diez veces. Descubrí que cuando el mercado está bajando y usted compra fondos sabiamente, en algún momento en el futuro será feliz. Nuna se encontrara un anuncio que diga: "Ahora es el momento de comprar". Hoy este ticker tiene un Volumen de 443M con una Capitalización de Mercado de 11.000M. ¡Buena suerte! “I believe in analysis and not forecasting.” / "Creo en el análisis y no en el pronóstico". REMEMBER : I am not a financial adviser nor is any content in this article presented as financial advice. The information provided in this blog post and any other posts that I make and any accompanying material is for informational purposes only. It should not be considered financial or investment advice of any kind. One should consult with a financial or investment professional to determine what may be best for your individual needs. RECUERDE : No soy un asesor financiero y el contenido de este artículo no se presenta como asesoramiento financiero. La información provista en esta publicación de blog y cualquier otra publicación que haga y cualquier material que la acompañe es solo para fines informativos. No debe considerarse asesoramiento financiero o de inversión de ningún tipo. Se debe consultar con un profesional financiero o de inversiones para determinar qué es lo mejor para sus necesidades individuales.
rodulfox
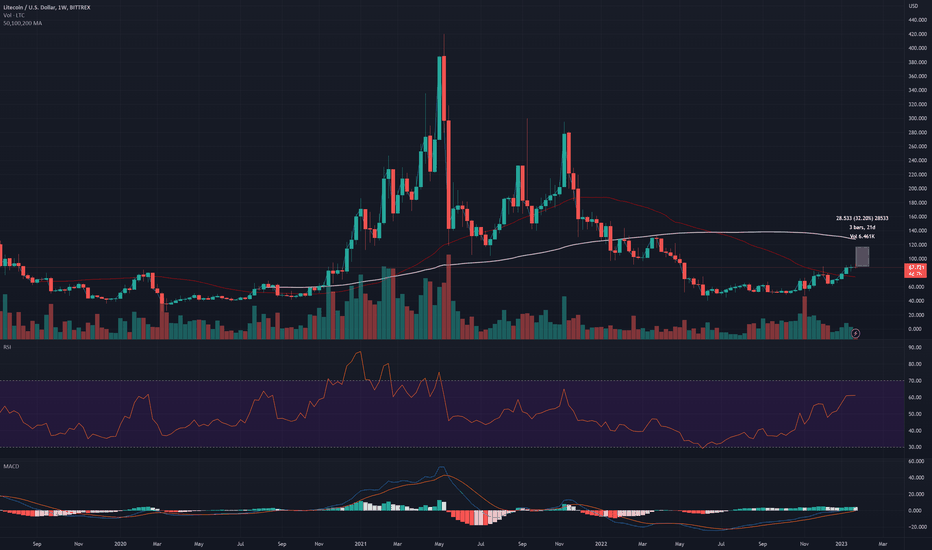
1W Chart, LTCUSD , on January 25, 2023, the signals on MACD already crossed north from below the histogram, after piercing on July 2022; The RSI signal bounced on 50 and is now facing NE staying steady over 60 after the price has been steadly climbing since the beginning of the year, from $78 to $87, piercing up the 100 days MA signal, at this moment there is still plenty of room for the price to test from below the 200 days MA signal by $120, which is the optimistic approach, but remember "In this business if you're good, you're right six times out of ten. You're never going to be right nine times out of ten. I've found that when the market's going down and you buy funds wisely, at some point in the future you will be happy. You won't get there by reading: "Now is the time to buy". Today this ticker has a Volume of 455M with a Market Cap of 6.3M. Good Luck! Gráfico 1W, LTCUSD , el 25 de enero de 2023, las señales en MACD ya cruzaron hacia el norte por debajo del histograma, después de perforar en julio de 2022; La señal RSI rebotó en 50 y ahora se enfrenta al NE manteniéndose estable sobre 60 después de que el precio ha estado subiendo constantemente desde principios de año, de $78 a $87, perforando la señal MA de 100 días, en este momento todavía hay mucho espacio para que el precio pruebe por debajo de la señal MA de 200 días en $120, que es el enfoque optimista, pero recuerda: "En este negocio, si eres bueno, tienes razón seis de cada diez veces. Nunca vas a tener razón nueve de cada diez veces. Descubrí que cuando el mercado está bajando y usted compra fondos sabiamente, en algún momento en el futuro será feliz. No llegará allí leyendo: "Ahora es el momento de comprar". Hoy este ticker tiene un Volumen de 455M con una Capitalización de Mercado de 6.3M. ¡Buena suerte! “I believe in analysis and not forecasting.” / "Creo en el análisis y no en el pronóstico". REMEMBER : I am not a financial adviser nor is any content in this article presented as financial advice. The information provided in this blog post and any other posts that I make and any accompanying material is for informational purposes only. It should not be considered financial or investment advice of any kind. One should consult with a financial or investment professional to determine what may be best for your individual needs. RECUERDE : No soy un asesor financiero y el contenido de este artículo no se presenta como asesoramiento financiero. La información provista en esta publicación de blog y cualquier otra publicación que haga y cualquier material que la acompañe es solo para fines informativos. No debe considerarse asesoramiento financiero o de inversión de ningún tipo. Se debe consultar con un profesional financiero o de inversiones para determinar qué es lo mejor para sus necesidades individuales.
Disclaimer
Any content and materials included in Sahmeto's website and official communication channels are a compilation of personal opinions and analyses and are not binding. They do not constitute any recommendation for buying, selling, entering or exiting the stock market and cryptocurrency market. Also, all news and analyses included in the website and channels are merely republished information from official and unofficial domestic and foreign sources, and it is obvious that users of the said content are responsible for following up and ensuring the authenticity and accuracy of the materials. Therefore, while disclaiming responsibility, it is declared that the responsibility for any decision-making, action, and potential profit and loss in the capital market and cryptocurrency market lies with the trader.