
rgmfxkiller777
@t_rgmfxkiller777

What symbols does the trader recommend buying?
Purchase History
پیام های تریدر
Filter
rgmfxkiller777
Gold H4 Timeframe With FOMC news

Hello Trader,Today Fomc News Coming soon and My all time favorite new all news my favorite and we are sure 500+ pips collected all big news favorite...1. Uptrend Channel:The price was moving within an ascending channel, making higher highs and higher lows.The channel is drawn with two parallel black trendlines.2. Breakout Point:The price broke above the upper trendline (marked with a red circle), signaling a potential bullish breakout.The label "breakout" confirms this observation.3. Target and Price Action:A green target zone is marked around 3,070 - 3,092, suggesting a potential price objective if the breakout sustains.The blue arrows show a possible price movement—pullback to retest the breakout level before continuing upward.If the breakout fails, price may drop back into the channel, leading to a reversal.4. Stop-Loss (SL):A stop-loss (SL) level is marked below the 3,004 level, just beneath the trendline, to protect against false breakouts.Summary:The trendline breakout suggests a bullish continuation if the price holds above the breakout level.A retest of the breakout level is expected before further upside.If the price drops below 3,004, the breakout could be invalidated.Would you like a deeper analysis or additional trading insights on this setup?
rgmfxkiller777
Btcusd H4 Timeframe

Hello Trader This chart is a Bitcoin (BTC/USD) price analysis on a 4-hour timeframe from TradingView. The key elements include:1. Falling Wedge Pattern – A bullish reversal pattern that suggests a potential price increase.2. Breakout Zone – Highlighted near the 86,572 level, indicating a possible upward breakout.3. Target Zone – Set above 100,000, implying a strong bullish move if the breakout is confirmed.4. Stop-Loss (SL) Level – Marked below the breakout area, around 80,000, to manage risk.The analysis suggests a breakout from the wedge pattern, leading to a rally toward the 100,000+ target. However, confirmation with volume and price action is crucial before entering a trade.Would you like a deeper technical analysis or additional insights?
rgmfxkiller777
GOLD H1 Timeframe

Hello Trader, Are you ready for again killing gold, First we are waiting for breakout then our comes to breakout and I hope you are waiting for my analysis chart patterns.This chart suggests a bearish outlook for Gold Spot (XAU/USD) on the 1-hour timeframe. The analysis highlights a breakout from a consolidation zone, with price breaking below a trendline.Key points:Short position setup: Price has broken support and is expected to move lower.Stop-loss (SL): Placed near $2,955.721, just above resistance.Target zones: $2,859.697 and $2,831.763.Bearish confirmation: Price needs to stay below the breakdown zone to maintain the selling pressure.Would you like me to help with a caption for your post?
rgmfxkiller777
Gold H4 Timeframe in (CPI)

Hello Trader,Today CPI News Coming soon and My Favorite News All Time Favorite and 500 pips collected confirm And Sure Signals This is a technical analysis chart for Gold Spot (XAU/USD) on a 4-hour timeframe. Here’s a breakdown of the key elements:1. Breakout Zone: The chart highlights a breakout from a descending trendline, indicating a potential bullish move.2. CPI Trades: The label suggests that the upcoming CPI (Consumer Price Index) release could impact price movements.3. Take Profit Levels (TP1, TP2, TP3):TP1: 2,884.452TP2: 2,946.420TP3: 2,979.671These levels represent potential targets for the price to reach if the breakout continues.4. Price Action Expectation:A slight retracement (blue arrow down) before a potential bullish continuation towards TP2 and TP3.5. Volume Indicator: Shows trading volume at the bottom, which can help confirm momentum.Would you like an analysis of potential trade setups based on this chart?
rgmfxkiller777
Gold Target Hit
Yesterday My Gold Analysis Share with you and almost All Target 🎯 Hitting and I am asking you my signals 97% sure.Gold Analysis Chart Patterns and Breakout follow and 100% Killing signals I already killing This news.Thanks for follow my analysis and like my analysis...
rgmfxkiller777
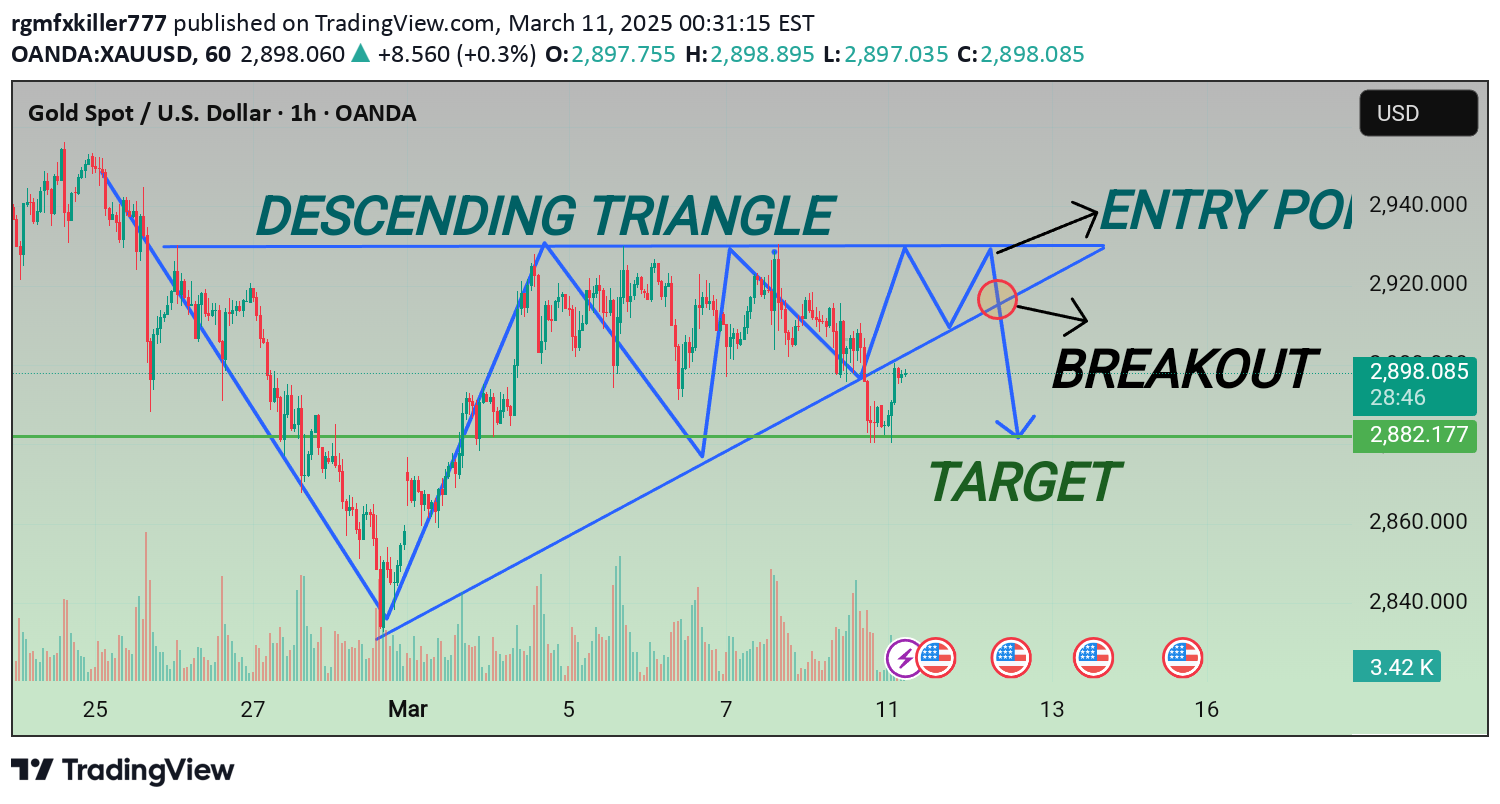
Gold 1H Time Frame

Hello Trader,Gold Analysis Daily Basis share for you and I hope you are interested my chart patterns and Waiting My Analysis with gold 🪙 A descending triangle is generally considered a bearish continuation pattern. In the chart you shared, the horizontal support line around the 2,905 level and the downward-sloping trendline create the triangle shape. If the price breaks below the support line with strong volume, it could signal a potential move downwards, possibly targeting the next support zone around 2,882.177 or lower.Are you looking to share this analysis with your followers, or do you want help crafting a specific trading idea or caption for it?Thanks for Like my Analysis and follow
rgmfxkiller777
Gold

Hello Trader,I hope you are doing well and happy with my analysis work chart patterns and always my analysis 97% Sure Signals now I am sending you Gold Analysis ❣️❣️ This chart shows the Gold Spot vs. USD on the 1-hour timeframe, with a potential trade setup. The price is currently around 2,903.155, and the chart suggests a bullish move towards the 2,944.846 resistance level. The stop loss (SL) is set just above this resistance, indicating a potential short trade if the price fails to break through. The target (T) is set at 2,844.960, suggesting a bearish outlook if resistance holds.Would you like help crafting a detailed post or analysis for your followers based on this setup?Thanks for Appreciate with my Ideas 💡
rgmfxkiller777
Btcusd

Btcusd Pennant Analysis Chart Patterns Share For You 97% Sure Signals. Btcusd Use Breakout and Then Target 🎯 This chart shows a bearish pennant pattern forming on the Bitcoin/Tether (BTC/USDT) 1-hour timeframe. The pennant is characterized by a sharp downtrend (flagpole) followed by a consolidation phase within converging trendlines. The price is expected to break out downward, as indicated by the black arrow. After a potential retest, the target is set around $89,021.37 if a bullish reversal occurs post-breakout.Are you looking to share this analysis with your followers or need help drafting a post?
rgmfxkiller777
Btcusd

Today my analysis chart patterns again killing btcusd are you ready killing in btcusd yesterday btcusd all target hitting and 600 pips collected in btcusd.today btcusd very very intrested and again we are collected 800 pips target and i hope you are waiting my analysis follow my chart patterns and like my ideas and then i am sending you more ideas okay
rgmfxkiller777
Btcusd
Btcusd Analysis Chart Patterns Hitting Almost All Target 🎯 Hitting and my Target 600 Pips Target 🎯 almost Done ✅ This is my Analysis performance share for you and my Performance front of you 11 Years Experience Never Lose daily good profits and make sure signals with you.1st you are follow and like my analysis chart patterns almost hitting And you are earning money 💰 💰
Disclaimer
Any content and materials included in Sahmeto's website and official communication channels are a compilation of personal opinions and analyses and are not binding. They do not constitute any recommendation for buying, selling, entering or exiting the stock market and cryptocurrency market. Also, all news and analyses included in the website and channels are merely republished information from official and unofficial domestic and foreign sources, and it is obvious that users of the said content are responsible for following up and ensuring the authenticity and accuracy of the materials. Therefore, while disclaiming responsibility, it is declared that the responsibility for any decision-making, action, and potential profit and loss in the capital market and cryptocurrency market lies with the trader.