
raresmihalcea2020
@t_raresmihalcea2020

What symbols does the trader recommend buying?
Purchase History
پیام های تریدر
Filter
raresmihalcea2020
44K SOON !
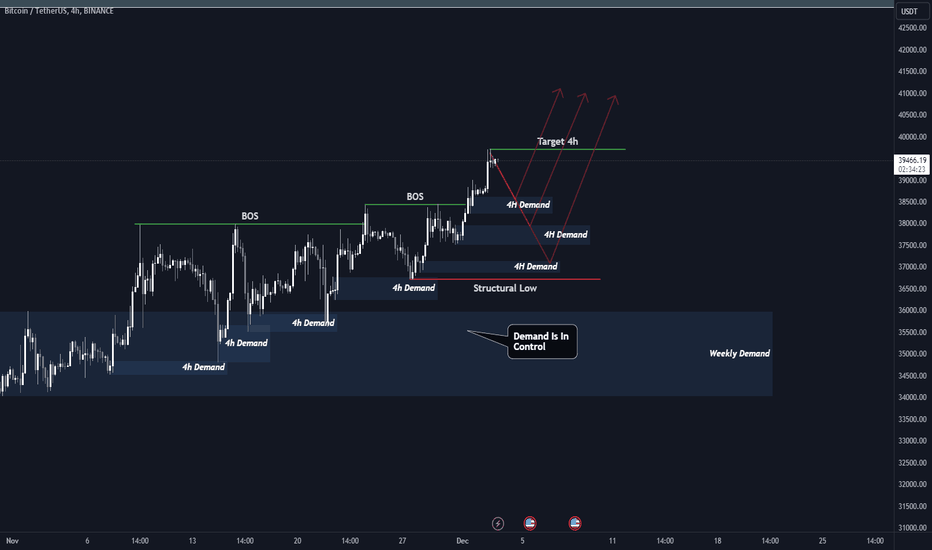
4H Chart the demand is in control and liquidating highs. A change in the Structure would mean to close below the structural low.On weekly chart we can see that there is imbalance left at 44k and the price can gravitate towards there.Forgot to put the weekly chartReaching 44K Sooner than I have expected :)Don't worry about altcoins tough- this is how money moves in crypto:First BTC pumps hardThen is followed by ETHAfter that large cap altcoins are pumpingAnd then almost every mid and small cap is making like 100x
raresmihalcea2020
ETH $3000 SOON??

The price can go to $3000 to fully close the imbalance and mitigate the left over Supply zone.From there we can see a more serious pullback.
raresmihalcea2020
44K SOON !
4H Chart the demand is in control and liquidating highs. A change in the Structure would mean to close below the structural low.On weekly chart we can see that there is imbalance left at 44k and the price can gravitate towards there.Forgot to put the weekly chartReaching 44K Sooner than I have expected :)Don't worry about altcoins tough- this is how money moves in crypto:First BTC pumps hardThen is followed by ETHAfter that large cap altcoins are pumpingAnd then almost every mid and small cap is making like 100x
raresmihalcea2020
BNB Bearish Liquidity Buildup

The trend has changed with the liquidation of the structural low on the 4h chart, which indicates a bearish momentumThere is a clear trend line that has stop losses above it so the price might take it out first in order to continue bearish.Equal Lows formed a Support zone on the 4h Chart which has stop loss liquidity below it.BNB can have a reaction from either of the Supply Zones noted on the chart.The overall Daily Bias is Bearish
raresmihalcea2020
ETH LONG

I am expecting a bullish move for ETH because on the Weekly chart we have formed liquidity above the equal highs. The price on Weekly reacted for an imbalance and formed a bullish trend. On the 4 Hours chart we can see a change in the structure, reactions from Demand Zones and a flip of a Supply Zone (the mitigation of the supply and then getting liquidated) which is a bullish sign.If the price goes below the 4 Hours Demand and closes below, then we might see a bearish retracement on the weekly to fill more Imbalances.Target Reached
Disclaimer
Any content and materials included in Sahmeto's website and official communication channels are a compilation of personal opinions and analyses and are not binding. They do not constitute any recommendation for buying, selling, entering or exiting the stock market and cryptocurrency market. Also, all news and analyses included in the website and channels are merely republished information from official and unofficial domestic and foreign sources, and it is obvious that users of the said content are responsible for following up and ensuring the authenticity and accuracy of the materials. Therefore, while disclaiming responsibility, it is declared that the responsibility for any decision-making, action, and potential profit and loss in the capital market and cryptocurrency market lies with the trader.