
qasimtahir
@t_qasimtahir

What symbols does the trader recommend buying?
Purchase History
پیام های تریدر
Filter
qasimtahir
XRPUSDT - Break Falling Wedge Reversal Pattern

XRPUSDT Break Falling Wedge Reversal Pattern with Bullish Divergence.. XRPUSDT Long EP: 2.1240 SL: 2.0740 TP: 2.1730
qasimtahir
BTCUSD - Break Falling Wedge Reversal Pattern

BTCUSD 4H timeframe chart is in Downtrend and break Falling Wedge Reversal Pattern with Bullish Divergence. Hence I'm doing long trade with these levels.
qasimtahir
BTCUSDT - In Rising Wedge Reversal Pattern

Observed that BTCUSDT chart in 4h timeframe has break Rising Wedge Reversal Pattern in uptrend with Bearish Divergence. If It break it's last higher low. I'll Sell (Stop) at 66560 and Stop Loss above at last HH level which is 67800.
qasimtahir
XAUUSD-In Downtrend Continuation with Bearish Flag Pattern

XAUUSD chart is printing downtrend continuation with bearish flag pattern.
qasimtahir
XAUUSD - In Sideways Trend

XAUUSD chart is printing Sideways Trend. For trade in 1h time frame, first selected 4h time frame and use Line chart to make Support and Resistance levels with horizontal lines at it's Peak and Low levels. Trade Strategy is doing long from 1st Support Level. Order type is Buy Limit and Entry Price at 1st Support with Stop Loss below at 2nd Support.
qasimtahir
DOTUSDT - IN DOWN TREND with Bullish Divergence

DOTUSDT chart is printing LH & LL which shows DOT in Declining Phase But RSI is printing Bullish Divergence. that's why I'm avoiding trade in this down trend.
qasimtahir
SOLUSDT - IN BULLISH TREND

SOLUSDT is trading in bullish trend in 1hr time frame as it is printing higher highs higher lows and confirmed by the formation of Bullish Candlestick. I'm taking buy limit order by using trend line and FIB Retracement tools.
qasimtahir
BTCUSDT - IN BULLISH TREND

BTCUSDT is trading in bullish trend in 1 Day time frame as it is printing higher highs higher lows and confirmed by the formation of Bullish Candlestick. I'm taking buy limit order by using trend line and FIB Retracement tools.
qasimtahir
XAUUSDT - IN UP TREND with Bearish Divergence
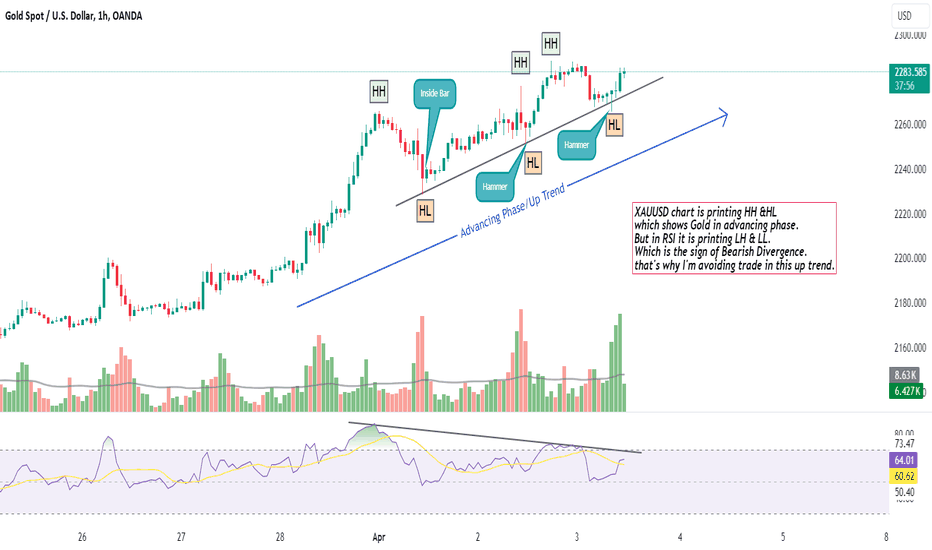
XAUUSD chart is printing HH &HL which shows Gold in advancing phase.But in RSI it is printing LH & LL which is the sign of Bearish Divergence.that's why I'm avoiding trade in this up trend.
qasimtahir
DOTUSDT - IN BEARISH TREND

DOTUSDT is trading in bearish trend in 1hr time frame as it is showing lower highs lower lows and confirmed by the formation of Shooting Star, Hanging Man, Evening Doji Star & Tweezers Top Candlesticks.
Disclaimer
Any content and materials included in Sahmeto's website and official communication channels are a compilation of personal opinions and analyses and are not binding. They do not constitute any recommendation for buying, selling, entering or exiting the stock market and cryptocurrency market. Also, all news and analyses included in the website and channels are merely republished information from official and unofficial domestic and foreign sources, and it is obvious that users of the said content are responsible for following up and ensuring the authenticity and accuracy of the materials. Therefore, while disclaiming responsibility, it is declared that the responsibility for any decision-making, action, and potential profit and loss in the capital market and cryptocurrency market lies with the trader.