
puttoAZ
@t_puttoAZ

What symbols does the trader recommend buying?
Purchase History
پیام های تریدر
Filter
Signal Type
puttoAZ

BTC is probably in a reaccumulation phase, which is confirmed by the volume for me. There was more trading at the local bottoms, which is why we assume accumulation. I also marked these accumulations with red ranges. There are two options, one is the blue faster way, the other is the slower but more likely option (purple).If we look at the weekly chart, we can get a more comprehensive picture. The yellow zone formed due to the previous ATH is what we are testing now.
puttoAZ

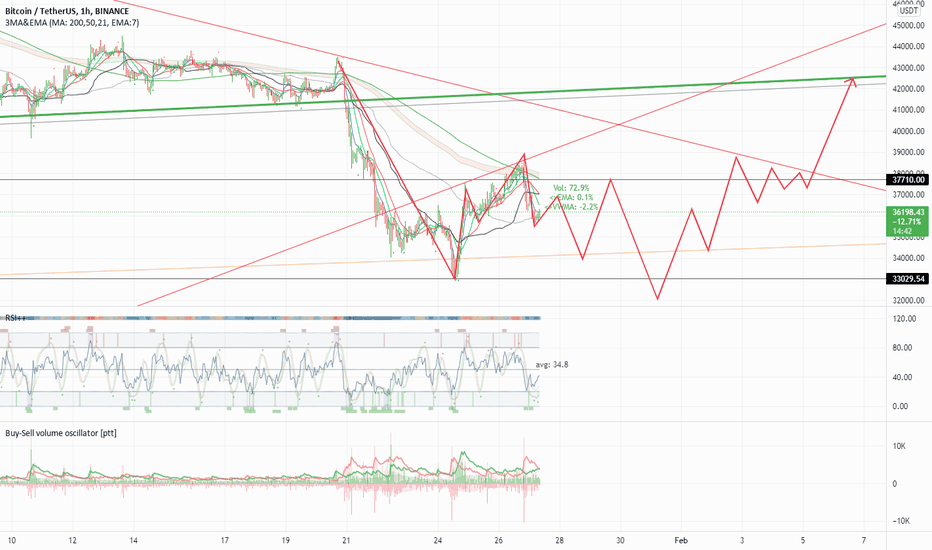
Looking at the 4h chart, it can be clearly seen that it is in an accumulation phase. We are currently after the 2nd ST and will test the UA zone at 0.1276. To do this, we need to look at the chart more closely. On the 1h chart, we can see that after the 2nd ST, which went all the way below the grey support, a micro Wyckoff accumulation is also happening, which is supposed to create a stronger buying pressure. If the price successfully breaks above UA(2) and retest it, then we go to the aforementioned 4h UA zone. If it fails then we presumably test the grey support again.The idea hasn't changed on my part, although LPS2 may be off, or not yet decided. From here, however, the spring is more likely. Which could even look below 0.098 with a quick dip. Or if indeed this LPS (or more likely just another test) just drags on, we could be on the green path up.No change from the previous idea. Spring was set, LPS (2) in progress, if UA (2) is reached and tested, then we return to the main accumulation phase.The accumulation phase continues successfully on the 1h chart. The goal is to test the UA on the 4hGo to 0.135$ and test UA on 4h chart..
puttoAZ

We are so out of volume that a correction is even more likely. Everyone is waiting, but somewhere along the line, patience runs out. This can simply be seen from the moving averages and how much volume has been used up. In 80% of the cases with such a moving average, there is always a correction, at least up to 50vwma (black). And from the running out of volume, one can conclude that we will soon (I think tomorrow) start with a big breakout.
puttoAZ
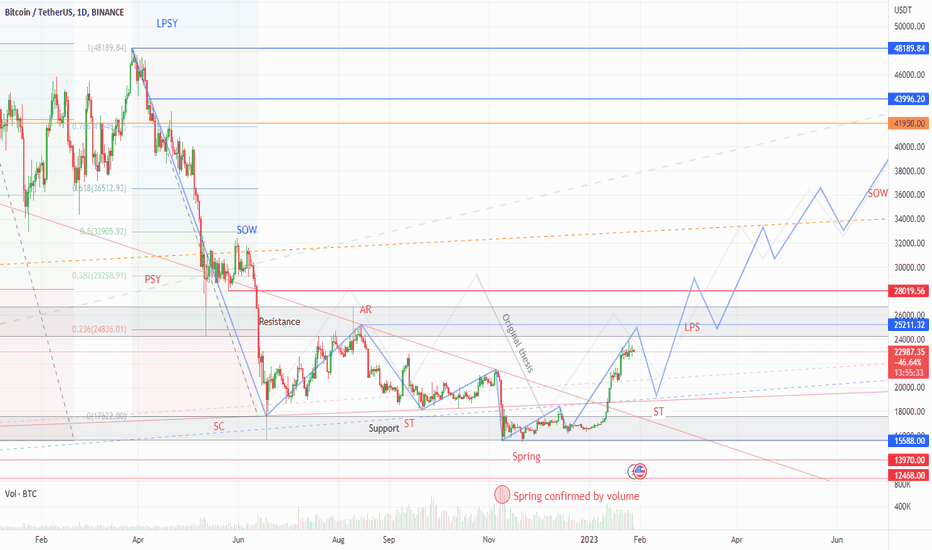
BTC at resistance... my original thesis by lightgray line (from Jul.2.), and the updated blue line. So I think we are in a Wyckoff accumulation pattern, and this is the final stage, if the next support test will success. Resistance : PSY leg & AR peak Support : spring leg & SC leg Next step : go testing support again ~19,5-20,5k, if we lucky, the test success at 21,5k, but I don't think so. And spring confirmed by volume, I think the bottom is in ( if the next test is success! )
puttoAZ

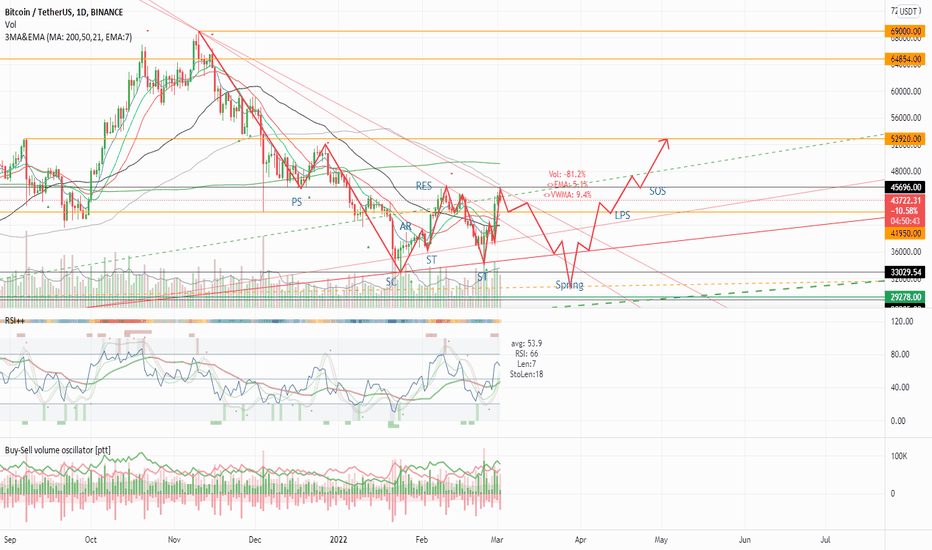
So, as I sad, I expected when bearMA to be greater than bullMA.. This happened first (week)2022-March-07 and the second (week)2022-April-11.. Prev. analysis : "Just like in 2019... so the next station is the weekly 200MA, but first maybe wee get a little pump to 50k before go to 25k." So, this wasn't happened.. And BTC started down to support. As I showed, in my prev. analysis, I expected 25k price level. And this thesis is related to another analysis : This is not a financial advice! Just an idea...
puttoAZ
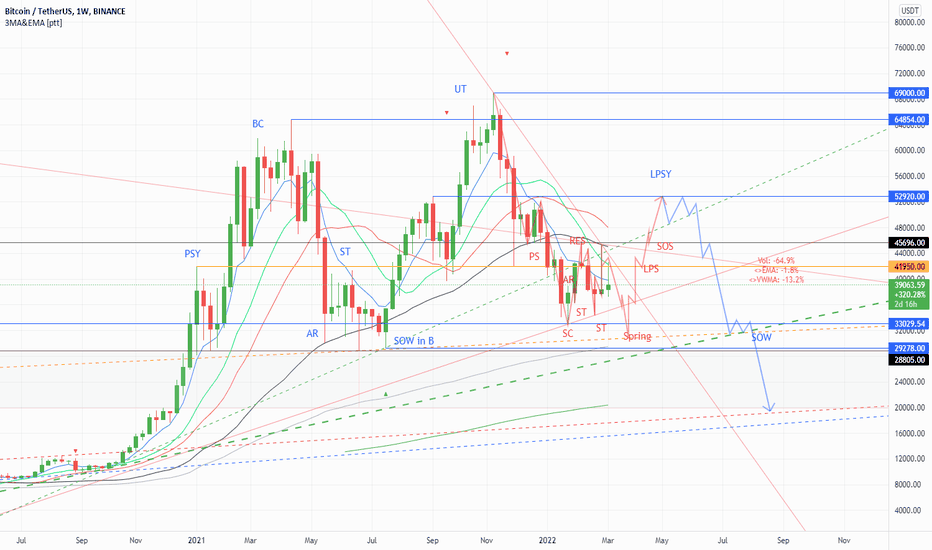
If we look the weekly BTC chart, we can discover an other Wyckoff pattern. This is the distribution pattern. I feel this pattern perfect continuation of the previous analysis : And I think if we look the montlhy chart....: So I think we go to ~54k, and then down to ~20-25k.So... that's nice, almost made it :).. the continue is may be an accumulation pattern, but it will take a long time.Just for myself.. on halfwayResistance : PSY leg & AR peak Support : spring leg & SC leg Next step : go testing support again ~19,5-20,5k, if we lucky, the test success at 21,5k, but I don't think so. And spring confirmed by volume, I think the bottom is in ( if the next test is success! )
puttoAZ
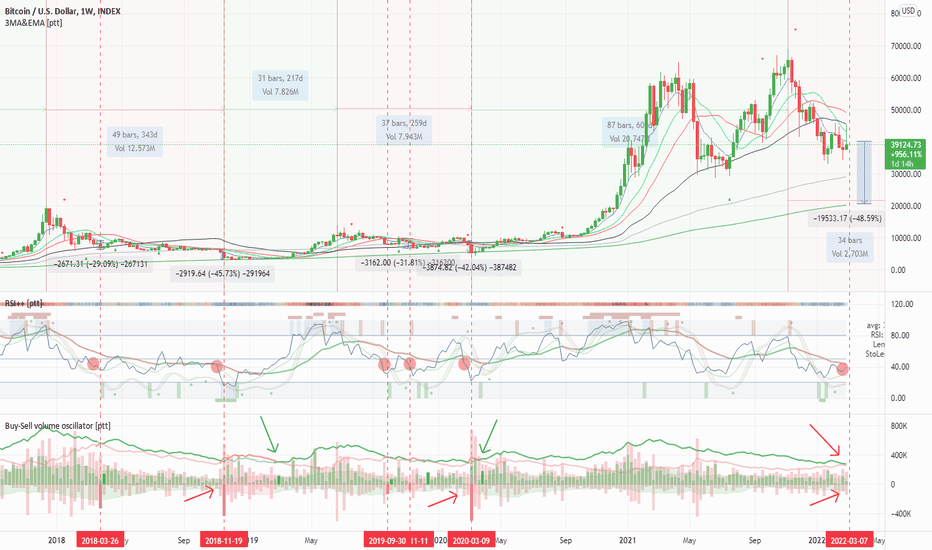
I made a BTC:USD analysis based on my own buy-sell volume indicator, and I want to share the result with you. The indicator introduction: I build a volume indicator, which separates the volume to buy and sell volume (columns), and contain two MA lines derived from the buy-sell volume, the green one is the bullMA from the buy volume, and the red one is the bearMA from the sell volume. This indicator contains a filled area, which is the pure SMA values from the volume, this is get green background if the bullMA is greater than the bearMA and red if the bearMA greater than the bullMA. The analysis: I checked the earlier BTC sessions and I found if the price over the ATH or the local top, the bearMA crosses the bullMA upward on the indicator. I call it bearCross, and if this happens the price continues to fall by ~30-50%. I drew the bull (green background) sessions and the bear (red) sessions on the price-chart. And drew with red arrows if the bearCross happens. We got one or two (maybe three) BearCrosses in one bear session. I think if end of the bull, when we got the first bearCross, which is indicat the middle of the bear session. The second one is the sign of the bear end or the end is near.So we can see the bullMA is fell near to bearMA, and the bearMA rised too, if the bearCross is coming (maybe 1-2 week), we are on halfway in the bear session... Confirmation by RSI: At every bearCross the RSI is between ~40-50 and the RSI-MA line (this is a special MA line derived from RSI and MA values) is red, which means that the price is falling... What happens if we get a bullCross?If the bullMA crosses the bearMA upwards, we get a bullCross (I drew with green arrows), and that means the bull session has begun. This is not a financial advice, just my analysis, my opinion!Hello Traders, So, as I sad, I expected when bearMA to be greater than bullMA.. This happened first (week)2022-March-07 and the second (week)2022-April-11.. Just like in 2019... so the next station is the weekly 200MA, but first maybe wee get a little pump to 50k before go to 25k.
puttoAZ
Maybe BTC is in an Wyckoff accumulation pattern on the daily timefrime. The range is between 33-46k, the upper zone is 42-46k, the lower is rise from 35k. If the upper zone test will success, we are ok... if not, we go to under 30-32k levels again, and the monthly chart and MA lines are not so good.If we look the weekly chart, we can discover an other Wyckoff pattern. This is the distribution pattern.
puttoAZ
Just an idea, but if my conclusion correct, BTC is in a Wyckoff accumulation pattern, that is between 33-38k. If the upper zone test will success, we are ok... if not, we go to under 30-32k levels.
puttoAZ

It is just an idea, but I feel valid this chart.. Based on 50VWMA (D), and 7EMA (D), and the mid diagonal from the latest top. Because the 7EMA crossed the 50VWMA and the daily close was under...
Disclaimer
Any content and materials included in Sahmeto's website and official communication channels are a compilation of personal opinions and analyses and are not binding. They do not constitute any recommendation for buying, selling, entering or exiting the stock market and cryptocurrency market. Also, all news and analyses included in the website and channels are merely republished information from official and unofficial domestic and foreign sources, and it is obvious that users of the said content are responsible for following up and ensuring the authenticity and accuracy of the materials. Therefore, while disclaiming responsibility, it is declared that the responsibility for any decision-making, action, and potential profit and loss in the capital market and cryptocurrency market lies with the trader.