
pips1000s
@t_pips1000s

What symbols does the trader recommend buying?
Purchase History
پیام های تریدر
Filter
pips1000s
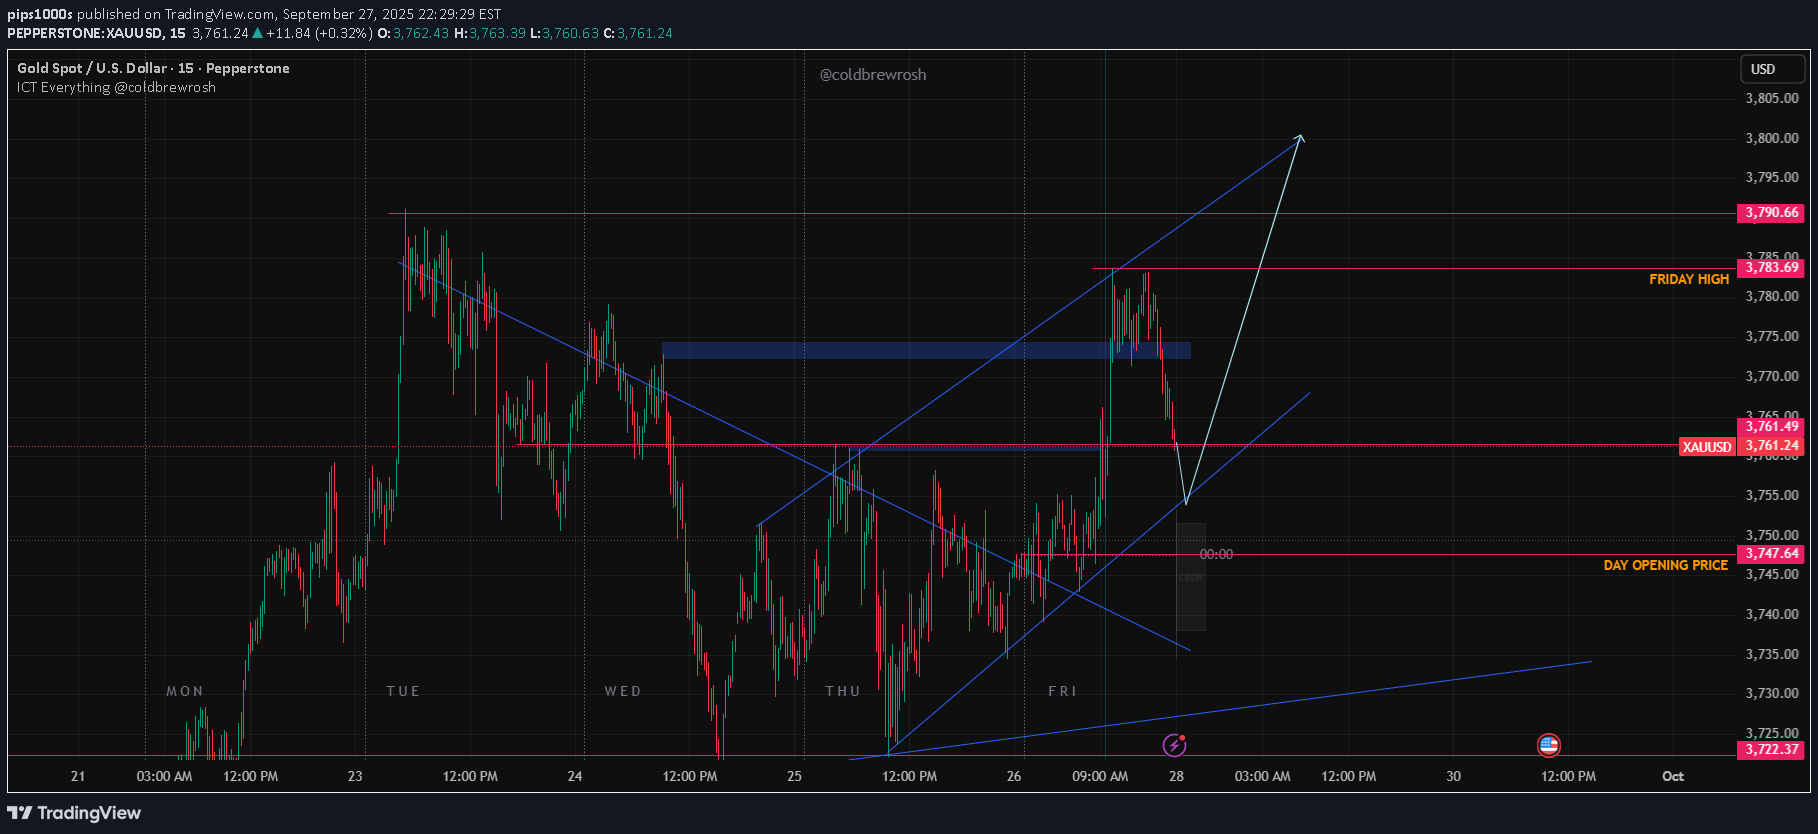
🏛 Fundamentals & Macro Update U.S. GDP Surprise The U.S. Q2 GDP was revised upward to 3.8% annualized (from the earlier 3.3%) — a much stronger picture than many had expected. That strength lifts the dollar and Treasury yields to some degree, as stronger growth gives the Fed more room to be cautious on further cuts. But it’s a mixed signal: the labor market is softening in other metrics, inflation pressures still exist, and markets still price in additional rate cuts later in 2025. How This Affects Gold Downside Pressure: A stronger GDP can argue against aggressive easing, which weighs on gold. Real yields could pick up, making gold less attractive. But Support Still There: Gold is getting strong tailwinds from safe-haven demand, central bank & ETF buying, and expectations that the Fed remains slow in cutting further. MarketPulse The dynamic is shifting: gold is less about the dollar alone now and more about real interest rates, inflation expectations, and policy credibility 📉 Price Action & Technicals Price has already rallied hard into the $3,780–$3,790 zone (resistance cluster). It is now pulling back (retracing) toward what looks like a support / trendline zone (just below current price) — this is a natural correction after a strong leg. That support zone is a likely area where buyers may step back in, especially if the fundamentals don’t suddenly turn sharply bearish. 🎯 Trading Idea (for Tomorrow / Short Term) Here’s the kind of play I’d watch for: Buy on retracement toward the support / trendline zone Entry zone: If price drops toward $3,755–$3,765 (or the lower boundary of the trendline ), look for signs of reversal (e.g. a bullish engulfing, hammer, or a bounce). Target: Expect a bounce back toward previous highs / resistance — somewhere in the $3,780–$3,800+ region (depending on strength). Stop-Loss: Place it just under the support / trendline — maybe $3,740 or a bit lower, to give some room for noise. Alternate (more aggressive) setup: If price breaks above $3,790–$3,800 with strong momentum and volume, you could ride that breakout to a further extension. But only enter after confirmation; don’t jump preemptively.
pips1000s
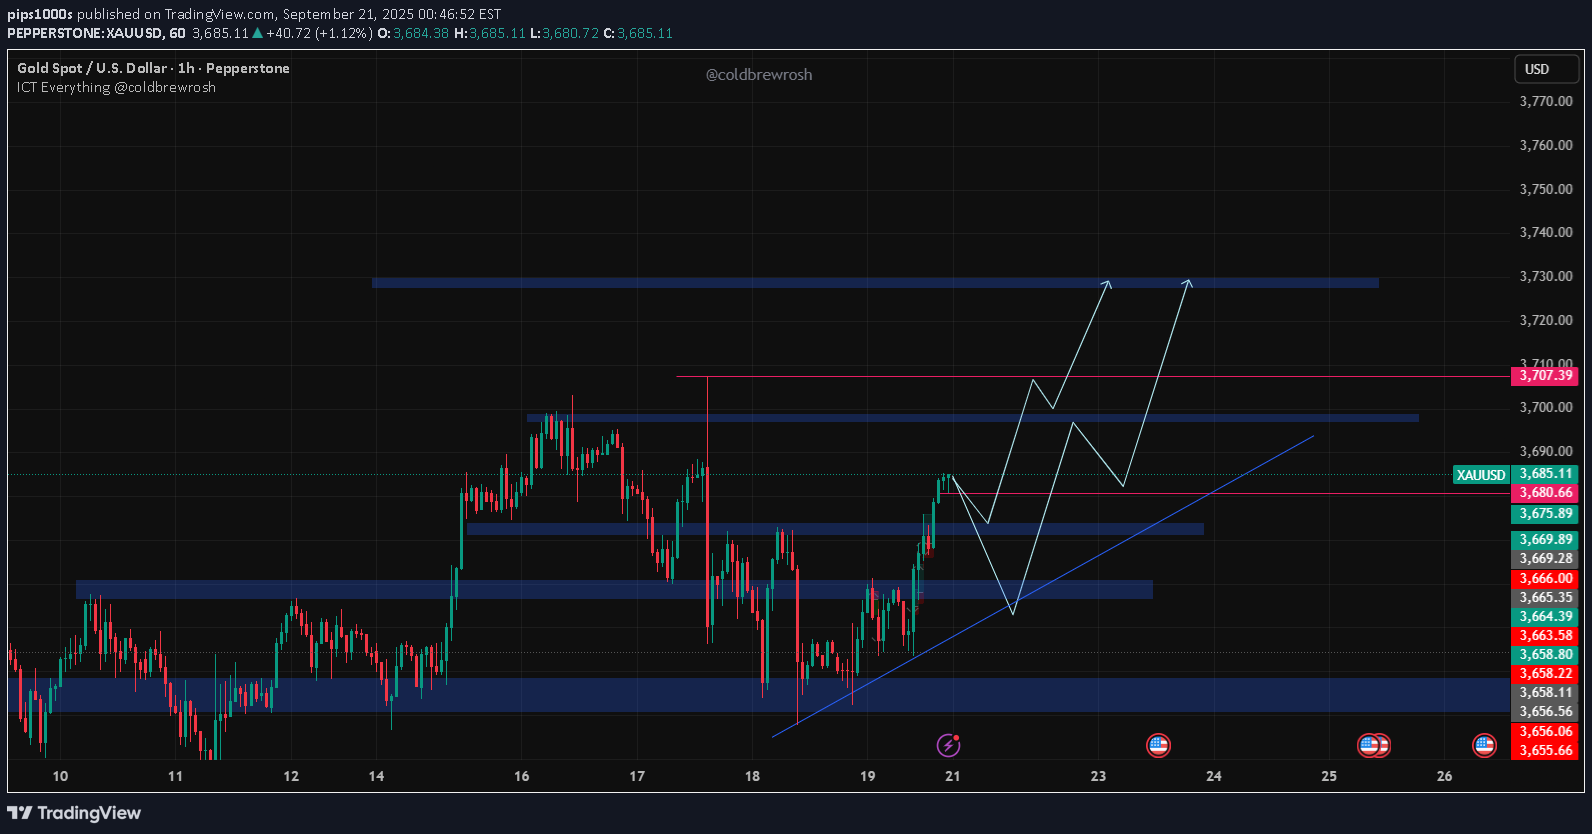
Fundamental & Fed Update Fed Rate Cut Confirmed, with Caution On September 17, 2025, the Fed cut the federal funds rate by 25 basis points, bringing it to 4.00-4.25%. This was the first cut of the year. It was largely expected but markets were focused on how dovish the Fed would signal future moves. “Risk-Management Cut” & Meeting-by-Meeting Guidance Powell described the cut as a “risk-management” move amid signs of labor market cooling. The Fed emphasized data dependency, and future decisions will be evaluated meeting by meeting. There is uncertainty on how swiftly or how many cuts will follow. Inflation / Labor Market Inflation remains sticky. The Fed is trying to balance easing pressure without letting inflation run away. Labor market has shown signs of weakness: less job growth, rising unemployment risk. This was a major factor pushing rate-cut expectations. Gold’s Reaction Gold hit a record high (~US$3,707.40/oz) shortly after the rate cut announcement, but then pulled back as the dollar firmed and investors digested Powell’s cautious tone. Investors are still positioning for further cuts this year (markets expect ~2 more cuts) but realize there is risk of disappointment. Other Supporting Factors Weakening real yields, persistent inflation, safe-haven demand, and central bank demand continue to give gold structural support. Some pullback / consolidation is underway because of profit-taking and perhaps overbought conditions. 📊 Technical Picture From what I see in 1-hour chart: Gold is trading around US$3,680–3,690 levels, having retraced slightly from recent highs. There is a visible resistance zone around ~US$3,700-3,710 ( upper red line in the chart) which was tested / approached. Support zones below around US$3,650-3,670, plus a more reliable base lower if needed. Momentum seems to be pushing up, but needs confirmation (breaks of resistance with volume, etc.). 🎯 Trading Plan for Tomorrow: I’ll look to buy on dips into $3,665–$3,670, targeting a move back toward $3,700, and if that breaks, aiming for $3,720+. Alternative play: breakout buy above $3,700 with momentum confirmation, targeting $3,730–$3,740. Risk management: stop-loss below $3,650 (major support). ⚠️ Risk factors: Strong U.S. data, hawkish Fed speeches, or a sharp dollar rebound could trigger a pullback toward $3,600.alternative play activated .gold did not pull back to main buying zoon .hope you took alternative play and it running 230 pipstarget done 400 pips
pips1000s
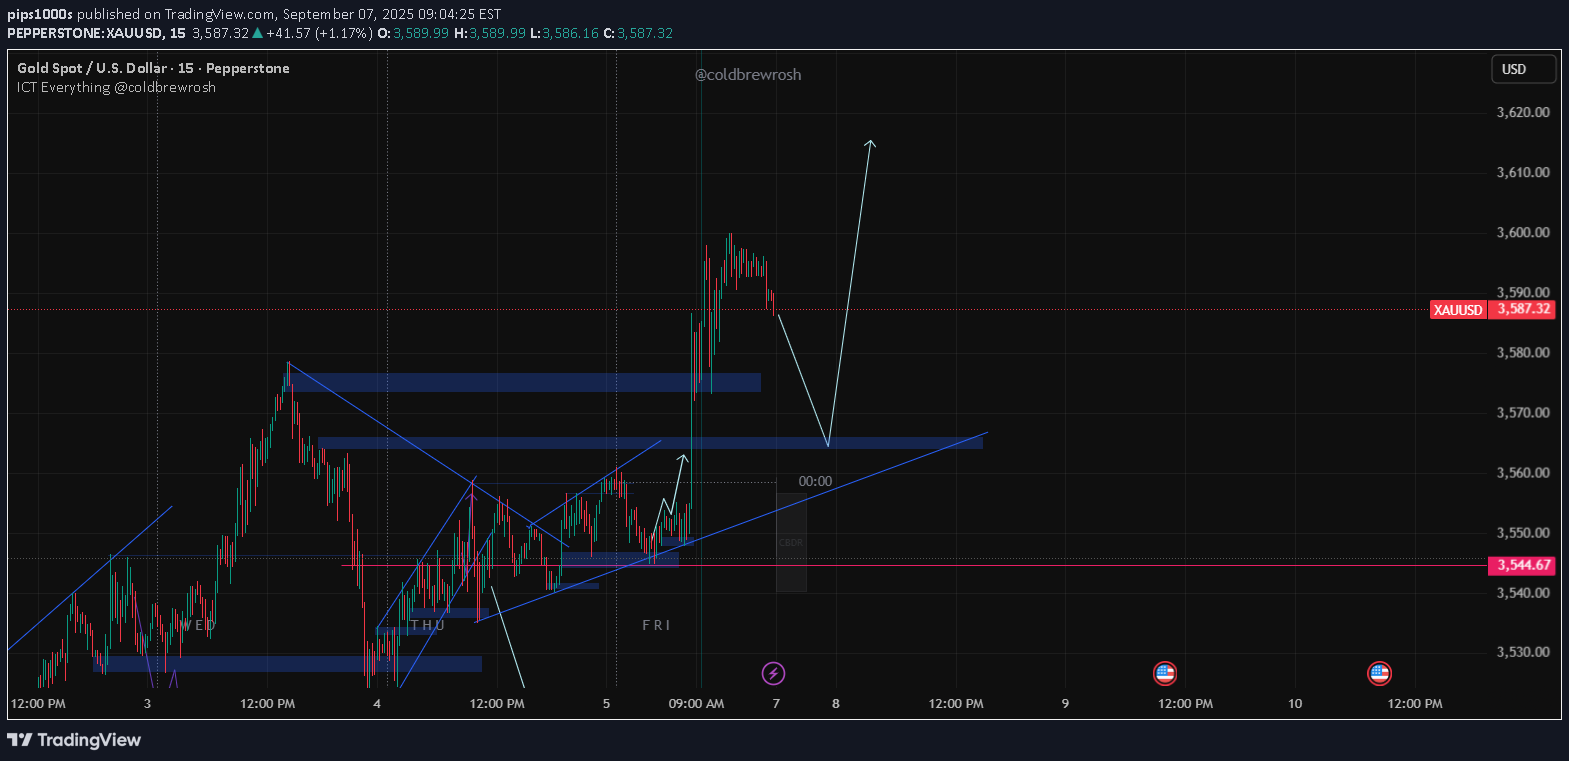
1. NFP Impact & Fundamental Landscape The August Nonfarm Payrolls (NFP) came in at just +22,000 jobs, well below expectations of +75,000. The unemployment rate rose to 4.3%, marking its highest level since 2021 . This weak print has fueled heightened Fed rate cut expectations, with markets now fully pricing in a 25 bp cut at the September 17 meeting, and even significant chances of further easing through year-end As a result, gold soared to a new all-time high, touching around $3,586–$3,600, driven by expectations of easier monetary policy, weaker Treasury yields, and a softer U.S. . Goldman Sachs sees sustained bullish momentum, forecasting $3,700 by end-2025, $4,000 by mid-2026, and up to $4,500–$5,000 in extreme diversification scenarios . Structural bullish demand continues from central banks, with more than 415 tonnes purchased in H1 2025, reinforcing long-term support 2. Technical Outlook (Based on 15-Minute Chart) Initial sharp spike to around $3,588, then some pullback and consolidation. A rising support trendline and clear retracement zone around $3,570–$3,575. Resistance remains at the recent high near $3,586–$3,590, before targeting the $3,600–$3,620 area. Interpretation: Consolidation around these levels could precede a resumption of the bullish trend—especially with strong dovish Fed sentiment. 3. Strategic Trading Ideas for the Week Ahead Strategy 1 – Pullback Entry within Bull Trend Trigger: Price dips to $3,570–$3,575, ideally near the rising trendline. Entry: Long position. Targets: First: $3,600 (psychological barrier), Then: $3,620–$3,650 if momentum continues. Stop-Loss: Just below $3,560, to protect against deeper reversal. Strategy 2 – Breakout Entry Above ATH Trigger: Clear close above $3,590–$3,595. Entry: Long on breakout. Targets: Immediate: $3,620–$3,630, Ambitious: heading toward the $3,650+ zone as momentum builds. Stop-Loss: Around $3,575, just below the breakout level. Strategy 3 – Cautious Scenario If the Fed hints at a more gradual easing path, or upcoming inflation data (e.g., PCE, CPI) surprises to the upside—momentum might stall or reverse. In that case, consider holding off on new longs or using tight triggers and conservative positioning.
pips1000s
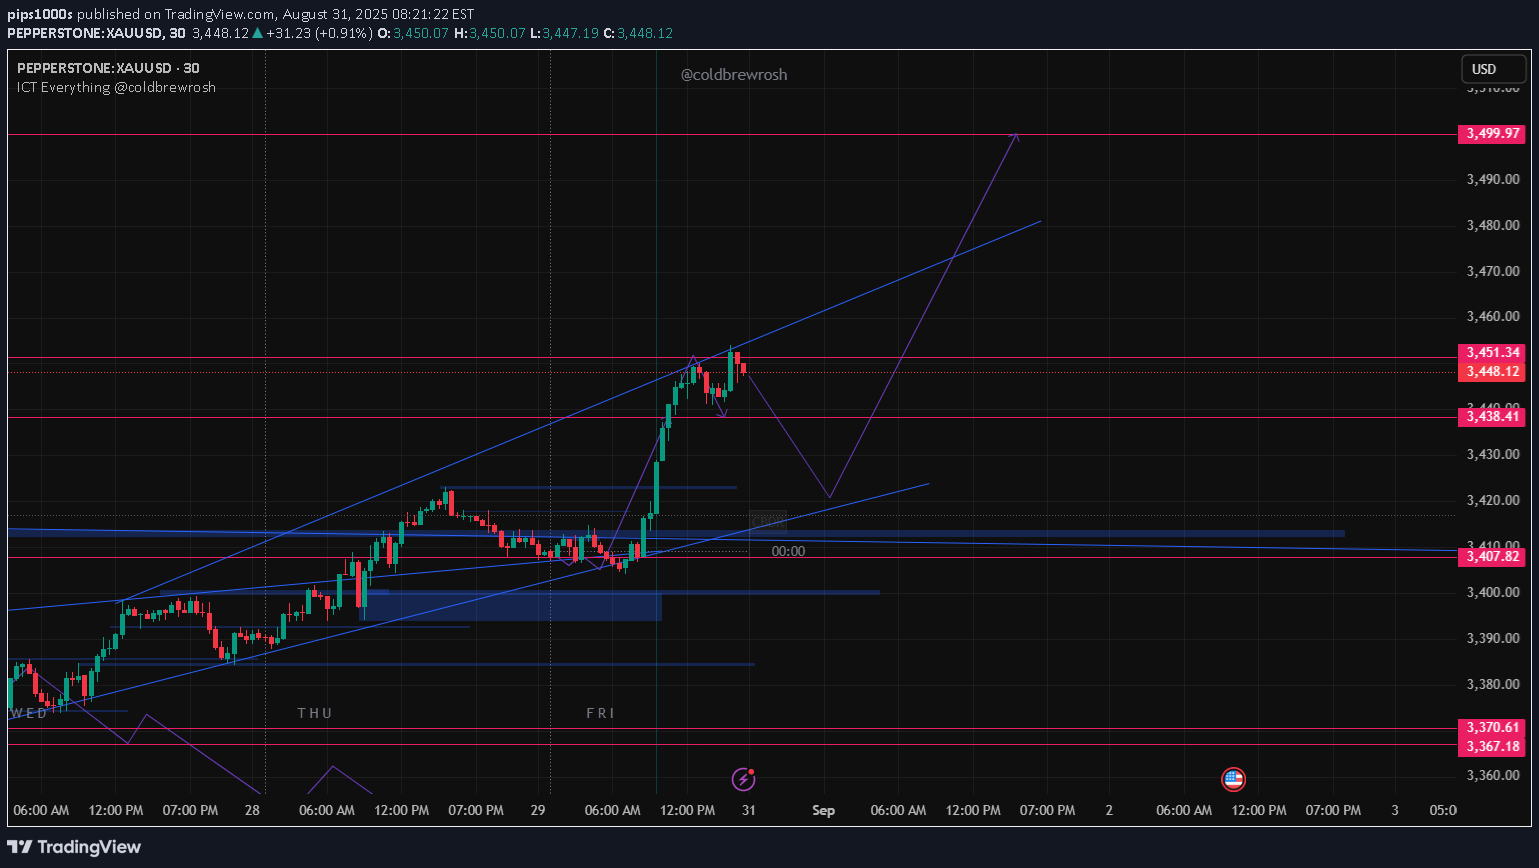
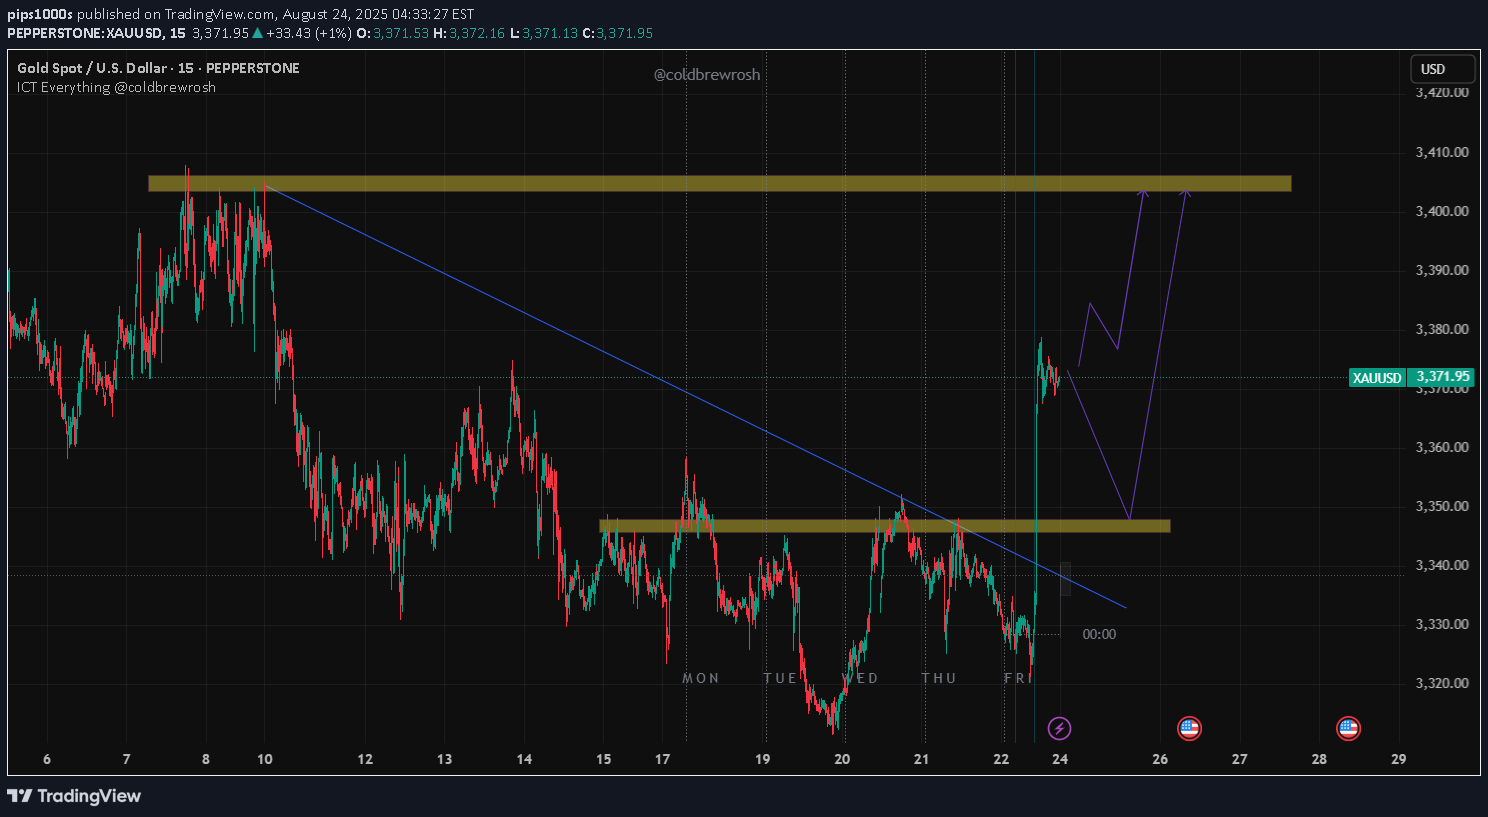
1. Technical Analysis – Current Gold Chart Your 30-minute XAU/USD chart shows: Strong bullish momentum pushing price swiftly from ~$3,408 up into the $3,445–$3,450 zone. Price now within a rising channel—testing upper resistance around $3,450. Support clusters below at $3,440 (recent minor breakdown) and a more structural base near $3,408. Short-term view: We may see a pullback or consolidation between $3,440–$3,450, followed by a potential second leg up if momentum stays firm. 2. Fundamental & Fed Update Factor Insight Fed Independence TurmoilPresident Trump’s move to fire Fed Governor Lisa Cook has roiled markets, casting doubt on Fed autonomy and fueling safe-haven demand—gold has already surged ~30% YTD, touching record highs above $3,490 Rate-Cut ExpectationsMarkets assign ~90% odds to a September rate cut. Soft jobs data and Powell’s dovish tone at Jackson Hole reinforce this view . Macro Debate on TimingMorgan Stanley argues the Fed may hold at 50–50 odds for a cut, citing resilient economic indicators despite dovish signals . Bullish Sentiment from BanksUBS raised its price target to $3,600 by March 2026 and $3,700 by mid-2026, backed by strong ETF and central . Goldman Sachs projects gold reaching $3,700 by year-end and potentially $4,000 by mid-2026 . Citi’s Bearish ScenarioConversely, Citi warns price could drop below $3,000 by late 2025 if investment demand weakens and global economic optimism resurfaces . 3. Trading Ideas for the Coming Week PLAN A – Continued Breakout Entry: On a confirmed breakout above $3,450, supported by volume. Targets: TP1: $3,480 (upper channel area) TP2: $3,500–$3,550 (psychological/resistance zone and aligned with potential cut scenario) Stop-Loss: Just below $3,440 (channel support). PLAN B – Pullback Entry Entry: On retracement to $3,430–$3,435, especially if macro data remains weak and rate-cut probability stays elevated. Targets: Same as above. Stop-Loss: Below $3,415–$3,410. Cautious Scenario – No Fed Cut / Disappointment If Fed denies a rate cut or signals hawkish intent, gold could slide sharply toward $3,350–$3,400 In that case, I'd avoid new long entries and consider protecting gains or waiting for lower re-entry.
pips1000s
1. Macroeconomic & Fundamental Backdrop ** Fed Policy Outlook** At Jackson Hole, Fed Chair Powell delivered dovish remarks, signaling potential rate cuts as soon as September—driving the dollar lower and Treasury yields down Market pricing now reflects about a 90% chance of a 25 bp cut next month ** Demand Strength & Analyst Forecasts** Gold has outperformed major traditional assets through 2025, up by roughly 28% year-to-date UBS now targets $3,600 by March 2026, and $3,700 by mid-to-late 2026 Goldman Sachs projects $3,700 by end-2025, climbing to $4,000 by mid-2026 RBC remains highly bullish—as high as $3,813 by end-2026, with a base case of $3,176–$3,500 through late 2025 2. Technical Landscape & Near-Term Catalysts Current Price Action & Key Levels Gold is trading near $3,372/oz, having broken above the $3,350 zone amid Fed dovishness Resistance lies near $3,380–$3,400, while support holds around $3,330–$3,350 pcoming Data Watchpoints** The coming week brings crucial U.S. readings: Durable Goods Orders, Q2 GDP revisions, and the Core PCE Index. A soft inflation print (PCE) or weaker GDP could reinforce gold’s bullish trend. Stronger data may trigger short-term corrective pressure 4. Trading Strategy Ideas Bullish Bias – “Fed-Fuelled Setup”: Entry: On a confirmed breakout above $3,380, ideally on strong volume. Targets: TP1: $3,400–$3,420 TP2: $3,450–$3,500 (psychological and institutional interest zone) Stop-Loss: Below $3,350–$3,360, depending on your risk tolerance. Conservative Approach – “Dip Entry”: Wait for retracement to $3,350 on negative data or dollar bounce. Enter near support with view toward $3,400–$3,450 upside. Stop below $3,330 to protect from a deeper pullback.active and running 350 pipsexit with 360 pips profits
pips1000s
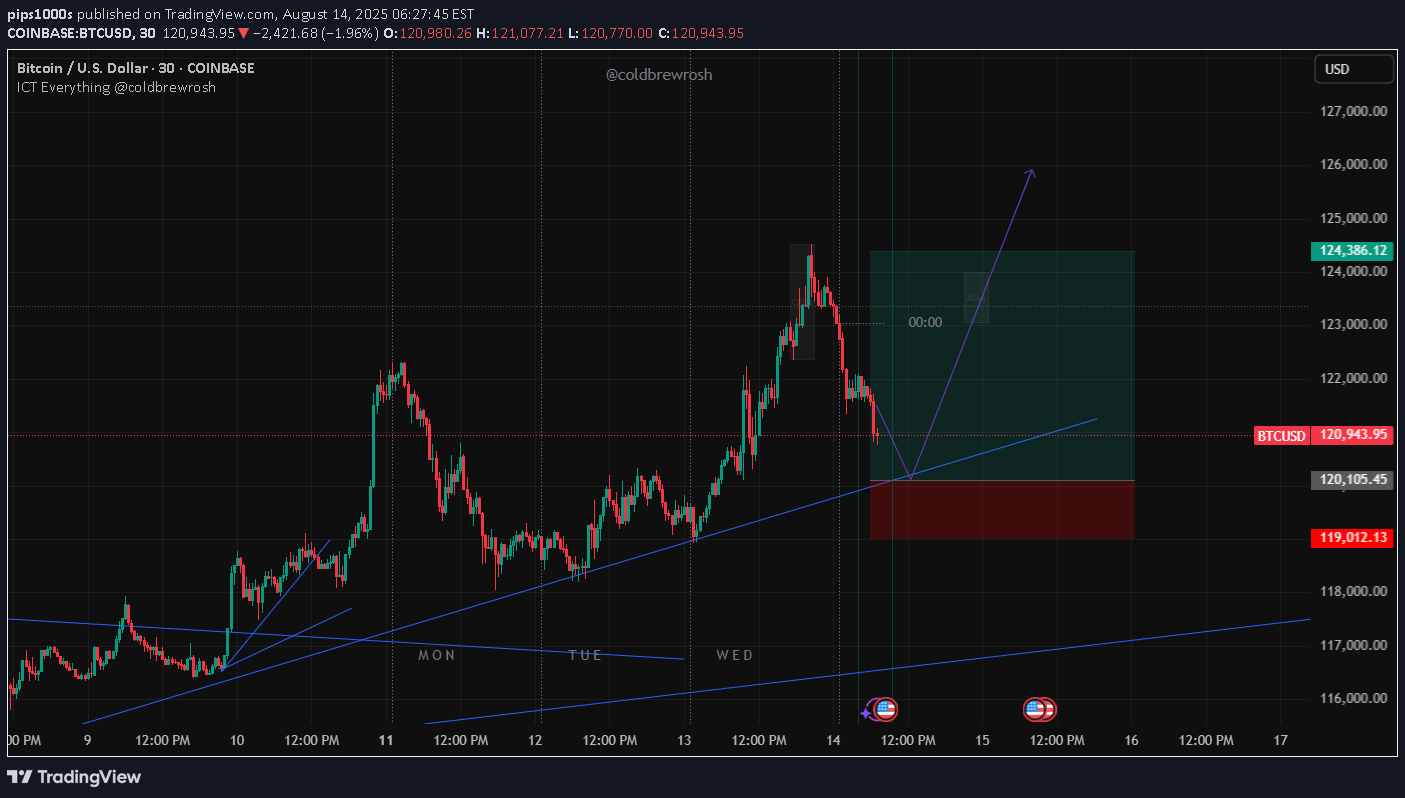
Technical Analysis Trendline Support: Price is currently retesting a rising trendline that has held since August 9th. Market Structure: We had a strong rally into ~126K, followed by a pullback. Current retracement is heading into a potential higher-low zone. Liquidity Areas: Above: 124,386 (Take Profit zone shown on chart). Below: 119,012 (Stop Loss area on chart). Volume: Declining slightly on the pullback, which may indicate a corrective move rather than a full reversal. Signal Idea (Based on Chart Setup) Entry: Around 120,100–120,300 (trendline touch confirmation) Stop Loss: Below 119,000 (structure break) Take Profit: Around 124,300–126,000 Risk–Reward: About 1:3 potential if TP hits Bias: Bullish as long as price respects the trendline. If BTC breaks and closes below 119,000 on the 30-minute chart, the bullish setup becomes invalid, and we could see a drop toward 117K.
pips1000s
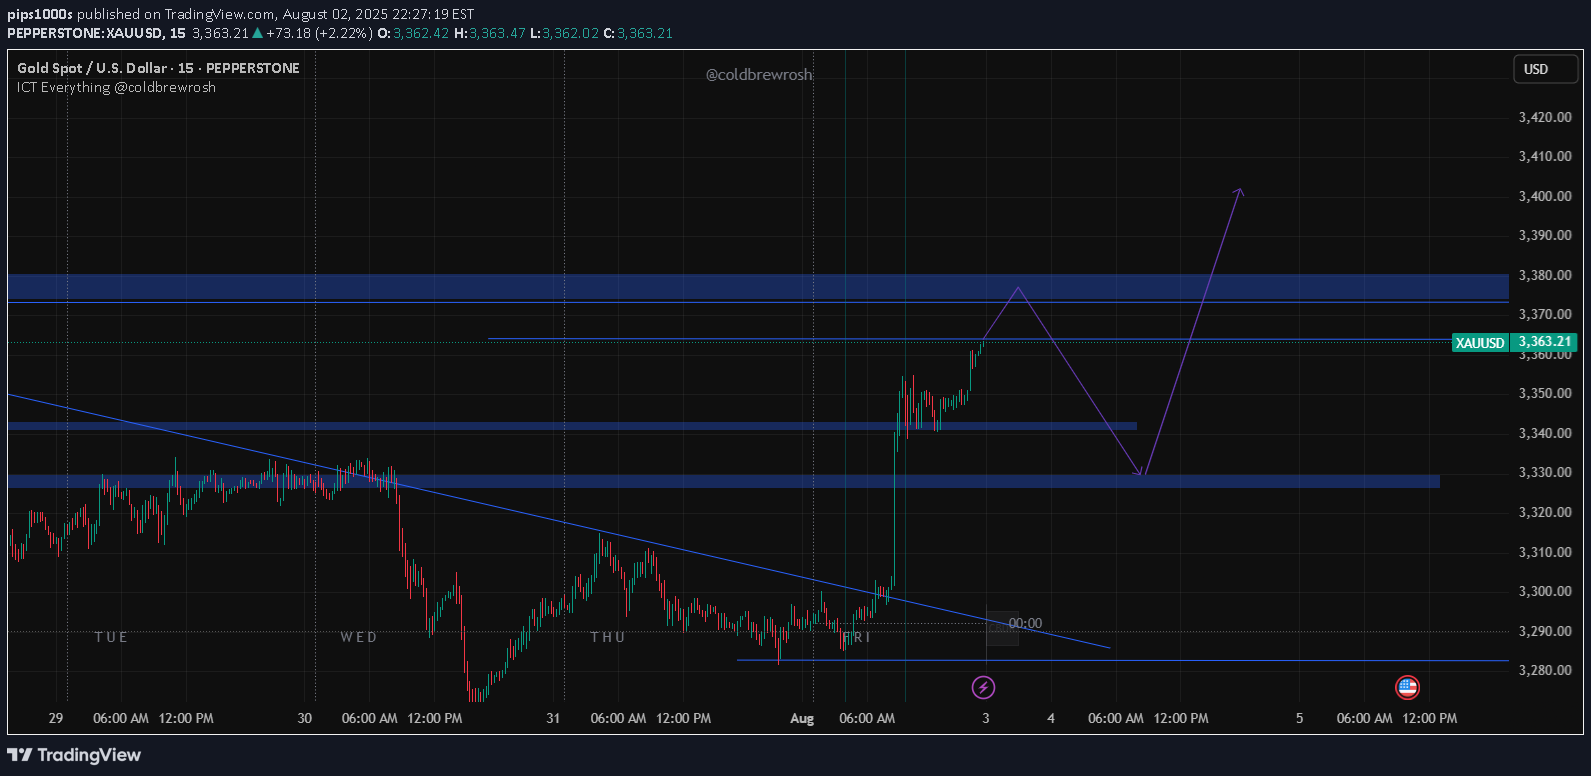
🌍 Fundamental & Geopolitical Overview: 🔻 1. US Interest Rate Outlook (FOMC - Just Passed) The Fed held rates unchanged at the recent meeting (July 31), but the tone was less dovish than expected. Powell emphasized a "wait and see" approach due to sticky core inflation (~2.6% YoY), which strengthened USD short term. 🔻 2. Geopolitical Tensions (Middle East & China Trade) Ongoing naval tensions in the Red Sea are causing slight safe-haven flows. China retaliated with tech export restrictions following recent US tariffs on rare earths and semiconductors. ✳️ This drives risk-off flows, supporting gold in the medium term. 🔻 3. US Jobs Data (NFP Due Friday, Aug 9) Traders are cautious ahead of this. A weak jobs report may fuel a breakout toward 3,400+. 📊 Technical Analysis (15M Chart) 🔹 Key Observations: Major breakout from falling trendline resistance (clean break on Aug 2). Strong bullish momentum led to price rallying from ~3320 to ~3363. Approaching a supply/imbalance zone around 3375–3380 (expect short-term reaction). Chart shows projected retracement to 3330 zone, then potential rally continuation. 🔹 Price Levels: Zone TypePrice RangeComment 📈 Resistance3375 – 3385Supply/imbalance zone 📉 Support3330 – 3340Demand + breakout retest area 🛑 Key SL ZoneBelow 3315Invalidates bullish structure 🎯 Bullish Target3405 – 3415Next liquidity pool / breakout target 📈 Trading Idea (Intraday + Swing Option) 🔹 Strategy: Buy the pullback Entry Zone: 3330 – 3340 (wait for rejection wick or bullish engulfing) Stop Loss: Below 3315 (safe under demand) Target 1: 3375 (initial resistance) Target 2: 3405–3415 (extension if momentum holds) 🎯 Risk:Reward: 1:2.5 to 1:3+ 📉 Alternative Short-Term Sell (Counter-Scalp Only) Entry: 3375 – 3380 (if price reaches without pullback) SL: Above 3385 TP: 3345 – 3335 ⚠️ Use only with price action confirmation (e.g. M15 bearish engulfing, RSI divergence).SELL TRADE ACTIVATED
pips1000s
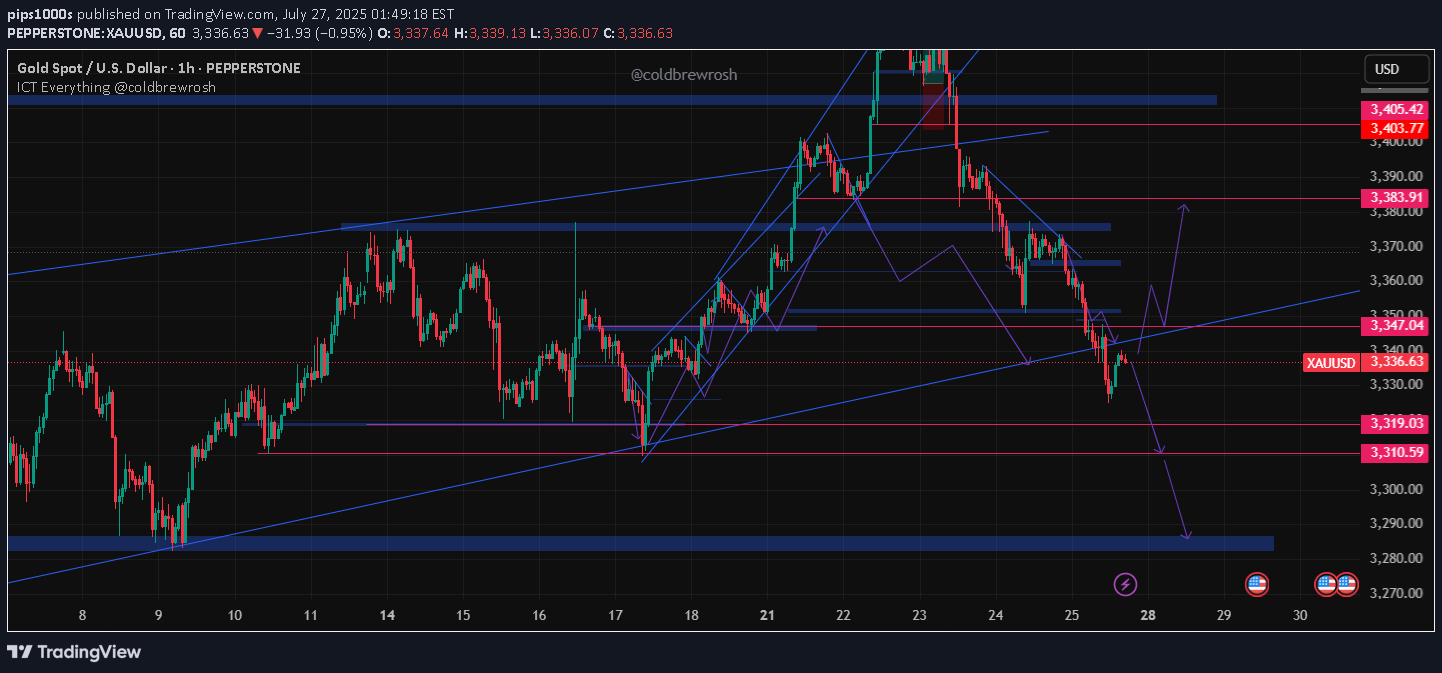
📰 Fundamental Analysis (as of July 27, 2025) 🔻 1. US Tariff News: The U.S. announced new tariffs on key Chinese tech and green energy imports (EV batteries, solar panels, and semiconductors). Market reaction: Slight risk-off sentiment, boosting gold as a safe haven, though USD is also firm due to protectionist stance. 🔻 2. Interest Rate Developments (Fed Outlook): Next Fed decision: July 31st, 2025 Fed Chair Powell signaled “data-dependent pause”, but inflation remains slightly above 2.7%, making rate cuts less likely short-term. The market is pricing in no rate cut in July, with possible Q4 rate cut if inflation declines. ✅ Impact on Gold: Mixed. No rate cut = stronger USD, but tariff-induced uncertainty = bullish for gold. Net bias = range-bound with upside spikes. 📊 Technical Analysis (1H Chart ) 🔹 Structure Overview: Price is currently at $3,336.63, testing the lower channel support. The recent structure shows a bearish break from the tight rising channel. There's a liquidity sweep wick under prior lows (~3330), indicating potential bounce. 🔹 Key Levels: TypePrice LevelComment Resistance3,347.04Trendline & order block Resistance3,383.91Key supply zone (previous high before drop) Support3,319.03Minor support Support3,310.59Major liquidity pool zone Strong Demand3,280–3,290Imbalance + weekly demand area 📈 Trade Ideas (2 Scenarios): 🟣 Scenario A: Bullish Reversal (High Probability if DXY weakens) Bias: Buy on bullish confirmation above 3340 Entry: 3340–3345 SL: 3326 (below liquidity wick) TP1: 3347 TP2: 3360 TP3: 3383 🧠 Confirmation: Break and close above 3347 zone (supply + trendline). 🔵 Scenario B: Bearish Continuation (if DXY rallies or Fed signals hawkish stance) Bias: Sell if price fails to break 3347 and closes below 3327 Entry: 3325–3330 (after pullback) SL: 3348 TP1: 3319 TP2: 3310 TP3: 3285–3290 demand zone 🧠 Confirmation: Strong rejection at 3345–3347 + bearish engulfing candle.gold sell trade activated and already hit200 pips
pips1000s
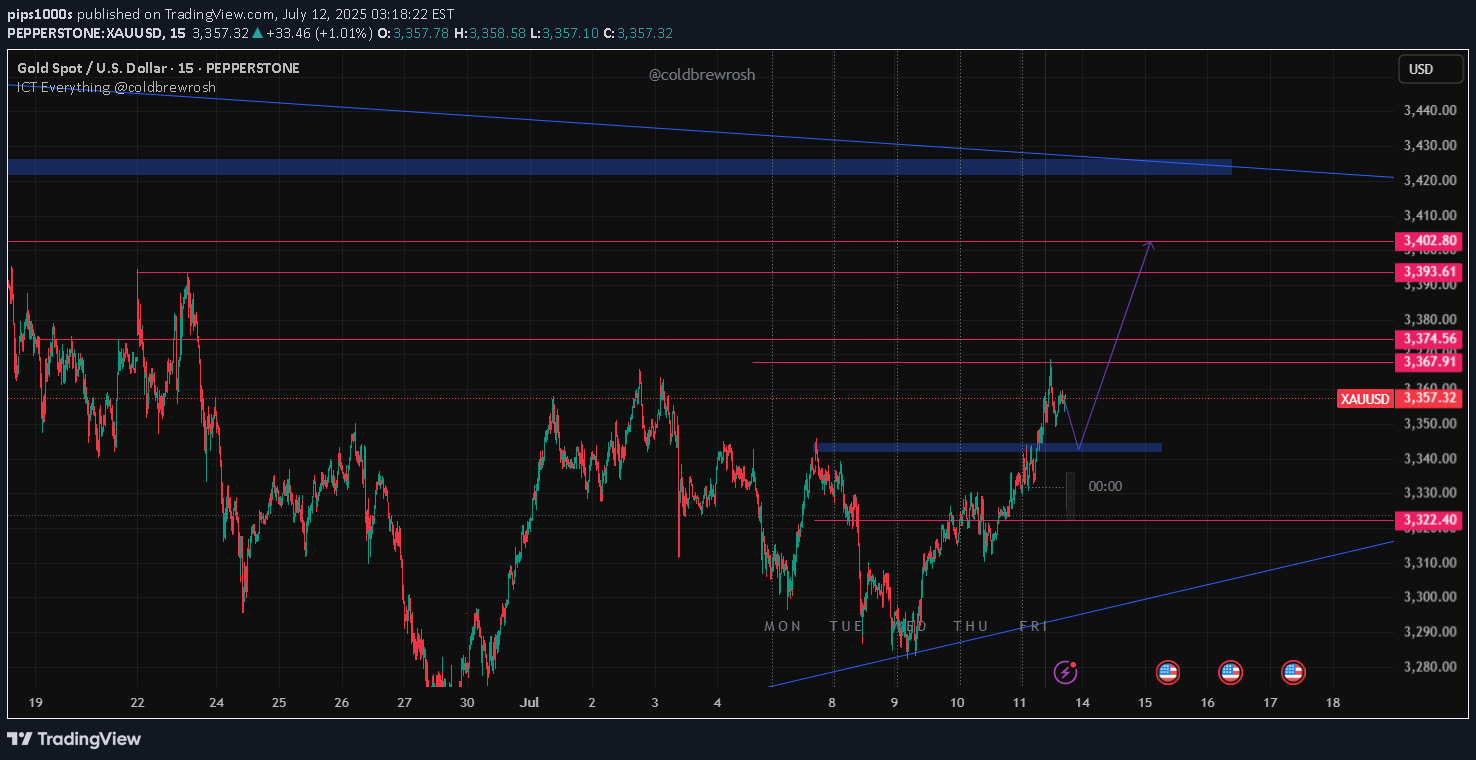
Current Price: $3,357.32 Support Zone (Demand Block): ~$3,342 – $3,347 Resistance Zones: $3,367.91 $3,374.56 $3,393.61 $3,402.80 Pine Script® Fundamental Analysis ✅ Bullish Drivers: U.S. Dollar Weakness: Recent Fed tone has shifted slightly dovish amid slowing inflation numbers. This weakens USD and supports gold. Central Bank Demand: Global central banks (especially in Asia & emerging markets) continue adding to gold reserves in response to geopolitical tensions. Geopolitical Risks: Ongoing U.S.–China tensions Russian sanctions & Ukraine conflict Middle East uncertainty All contribute to risk-hedging demand for gold. Real Yields & Inflation Expectations: Real U.S. yields remain volatile. If bond yields soften or inflation persists, gold remains attractive as a hedge. 📦 Tariff & Macro Trade Factors China-U.S. Trade Tensions (2025): There are renewed talks of higher tariffs on Chinese EVs and tech imports. This may slow growth and increase safe-haven flows into gold. Global Growth Concerns: IMF has revised global GDP forecasts downward for Q3 2025, boosting gold's appeal as a defensive asset. Trade Setup Idea (Next Week): Buy Limit Entry: $3,345 – $3,348 (on retest of demand zone) Stop Loss: Below $3,322 Take Profit 1 (TP1): $3,368 Take Profit 2 (TP2): $3,393 Take Profit 3 (TP3): $3,402 – $3,410 Risk/Reward: Approx 1:3+
pips1000s
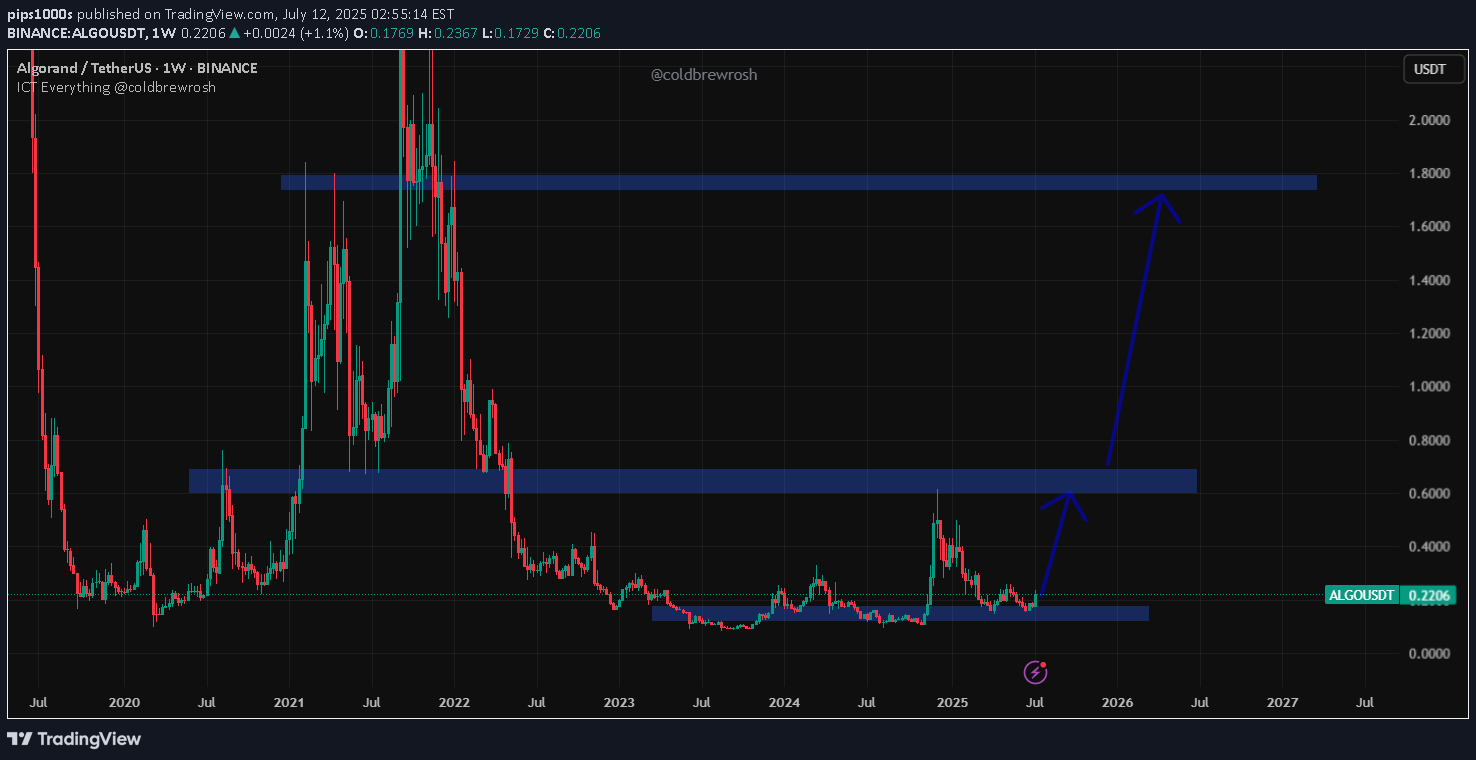
📊 Technical Analysis – Weekly Chart Current Price: $0.2202 Exchange: Binance Chart Type: Weekly Volume Spike: 211.47M Recent Gain: +24.41% First Resistance/Target Zone: $0.50 – $0.70 Previous support in 2021–2022, now acting as resistance. Price will likely face heavy selling here if reached quickly. Second Resistance/Target Zone: $1.50 – $1.85 Major historical supply zone. This is the macro breakout target if the bullish reversal confirms and BTC leads a broad altcoin rally. Buy Zone$0.20–$0.24 SL (Hard)$0.145 TP1$0.50 TP2$0.70 TP3$1.50–$1.80
Disclaimer
Any content and materials included in Sahmeto's website and official communication channels are a compilation of personal opinions and analyses and are not binding. They do not constitute any recommendation for buying, selling, entering or exiting the stock market and cryptocurrency market. Also, all news and analyses included in the website and channels are merely republished information from official and unofficial domestic and foreign sources, and it is obvious that users of the said content are responsible for following up and ensuring the authenticity and accuracy of the materials. Therefore, while disclaiming responsibility, it is declared that the responsibility for any decision-making, action, and potential profit and loss in the capital market and cryptocurrency market lies with the trader.