
petermichalides
@t_petermichalides

What symbols does the trader recommend buying?
Purchase History
پیام های تریدر
Filter
Signal Type
petermichalides

As of September 3, 2025, Ethereum (ETH) is trading around $4,466 USD. The market is currently experiencing heightened volatility, influenced by both technical factors and broader macroeconomic developments. Ethereum reached a high of $4,954 in August before retracing to its current levels, suggesting a consolidation phase with key support around $4,200 and resistance near $4,650. Technically, short-term trends suggest a bullish bias, but caution is advised due to recent fluctuations. The Relative Strength Index (RSI) is showing bearish divergence, indicating potential weakening momentum. A decisive breakout above $4,650 could push ETH toward $5,000, while a drop below $4,200 may lead to retesting the $4,000 support zone. Investor sentiment is cautiously optimistic. Anticipation of potential Federal Reserve rate cuts in September has increased demand for risk assets like Ethereum. Additionally, the upcoming Fusaka upgrade is expected to enhance Ethereum's scalability and reduce transaction costs, further bolstering its appeal. In the near term, Ethereum is likely to experience continued volatility. Traders should monitor the $4,200 support and $4,650 resistance levels closely. Looking ahead, Ethereum's long-term prospects remain strong. Analysts project that with sustained institutional interest and successful implementation of scalability upgrades, ETH could reach between $6,000 and $8,000 by the end of 2025. Despite the optimistic outlook, Ethereum's price remains susceptible to broader market dynamics, including Bitcoin’s performance and macroeconomic factors. Investors should be prepared for potential fluctuations and consider these risks when making investment decisions. Overall, Ethereum’s market is at a pivotal point, and key technical levels and upcoming events will play a crucial role in determining its short-term trajectory.
petermichalides
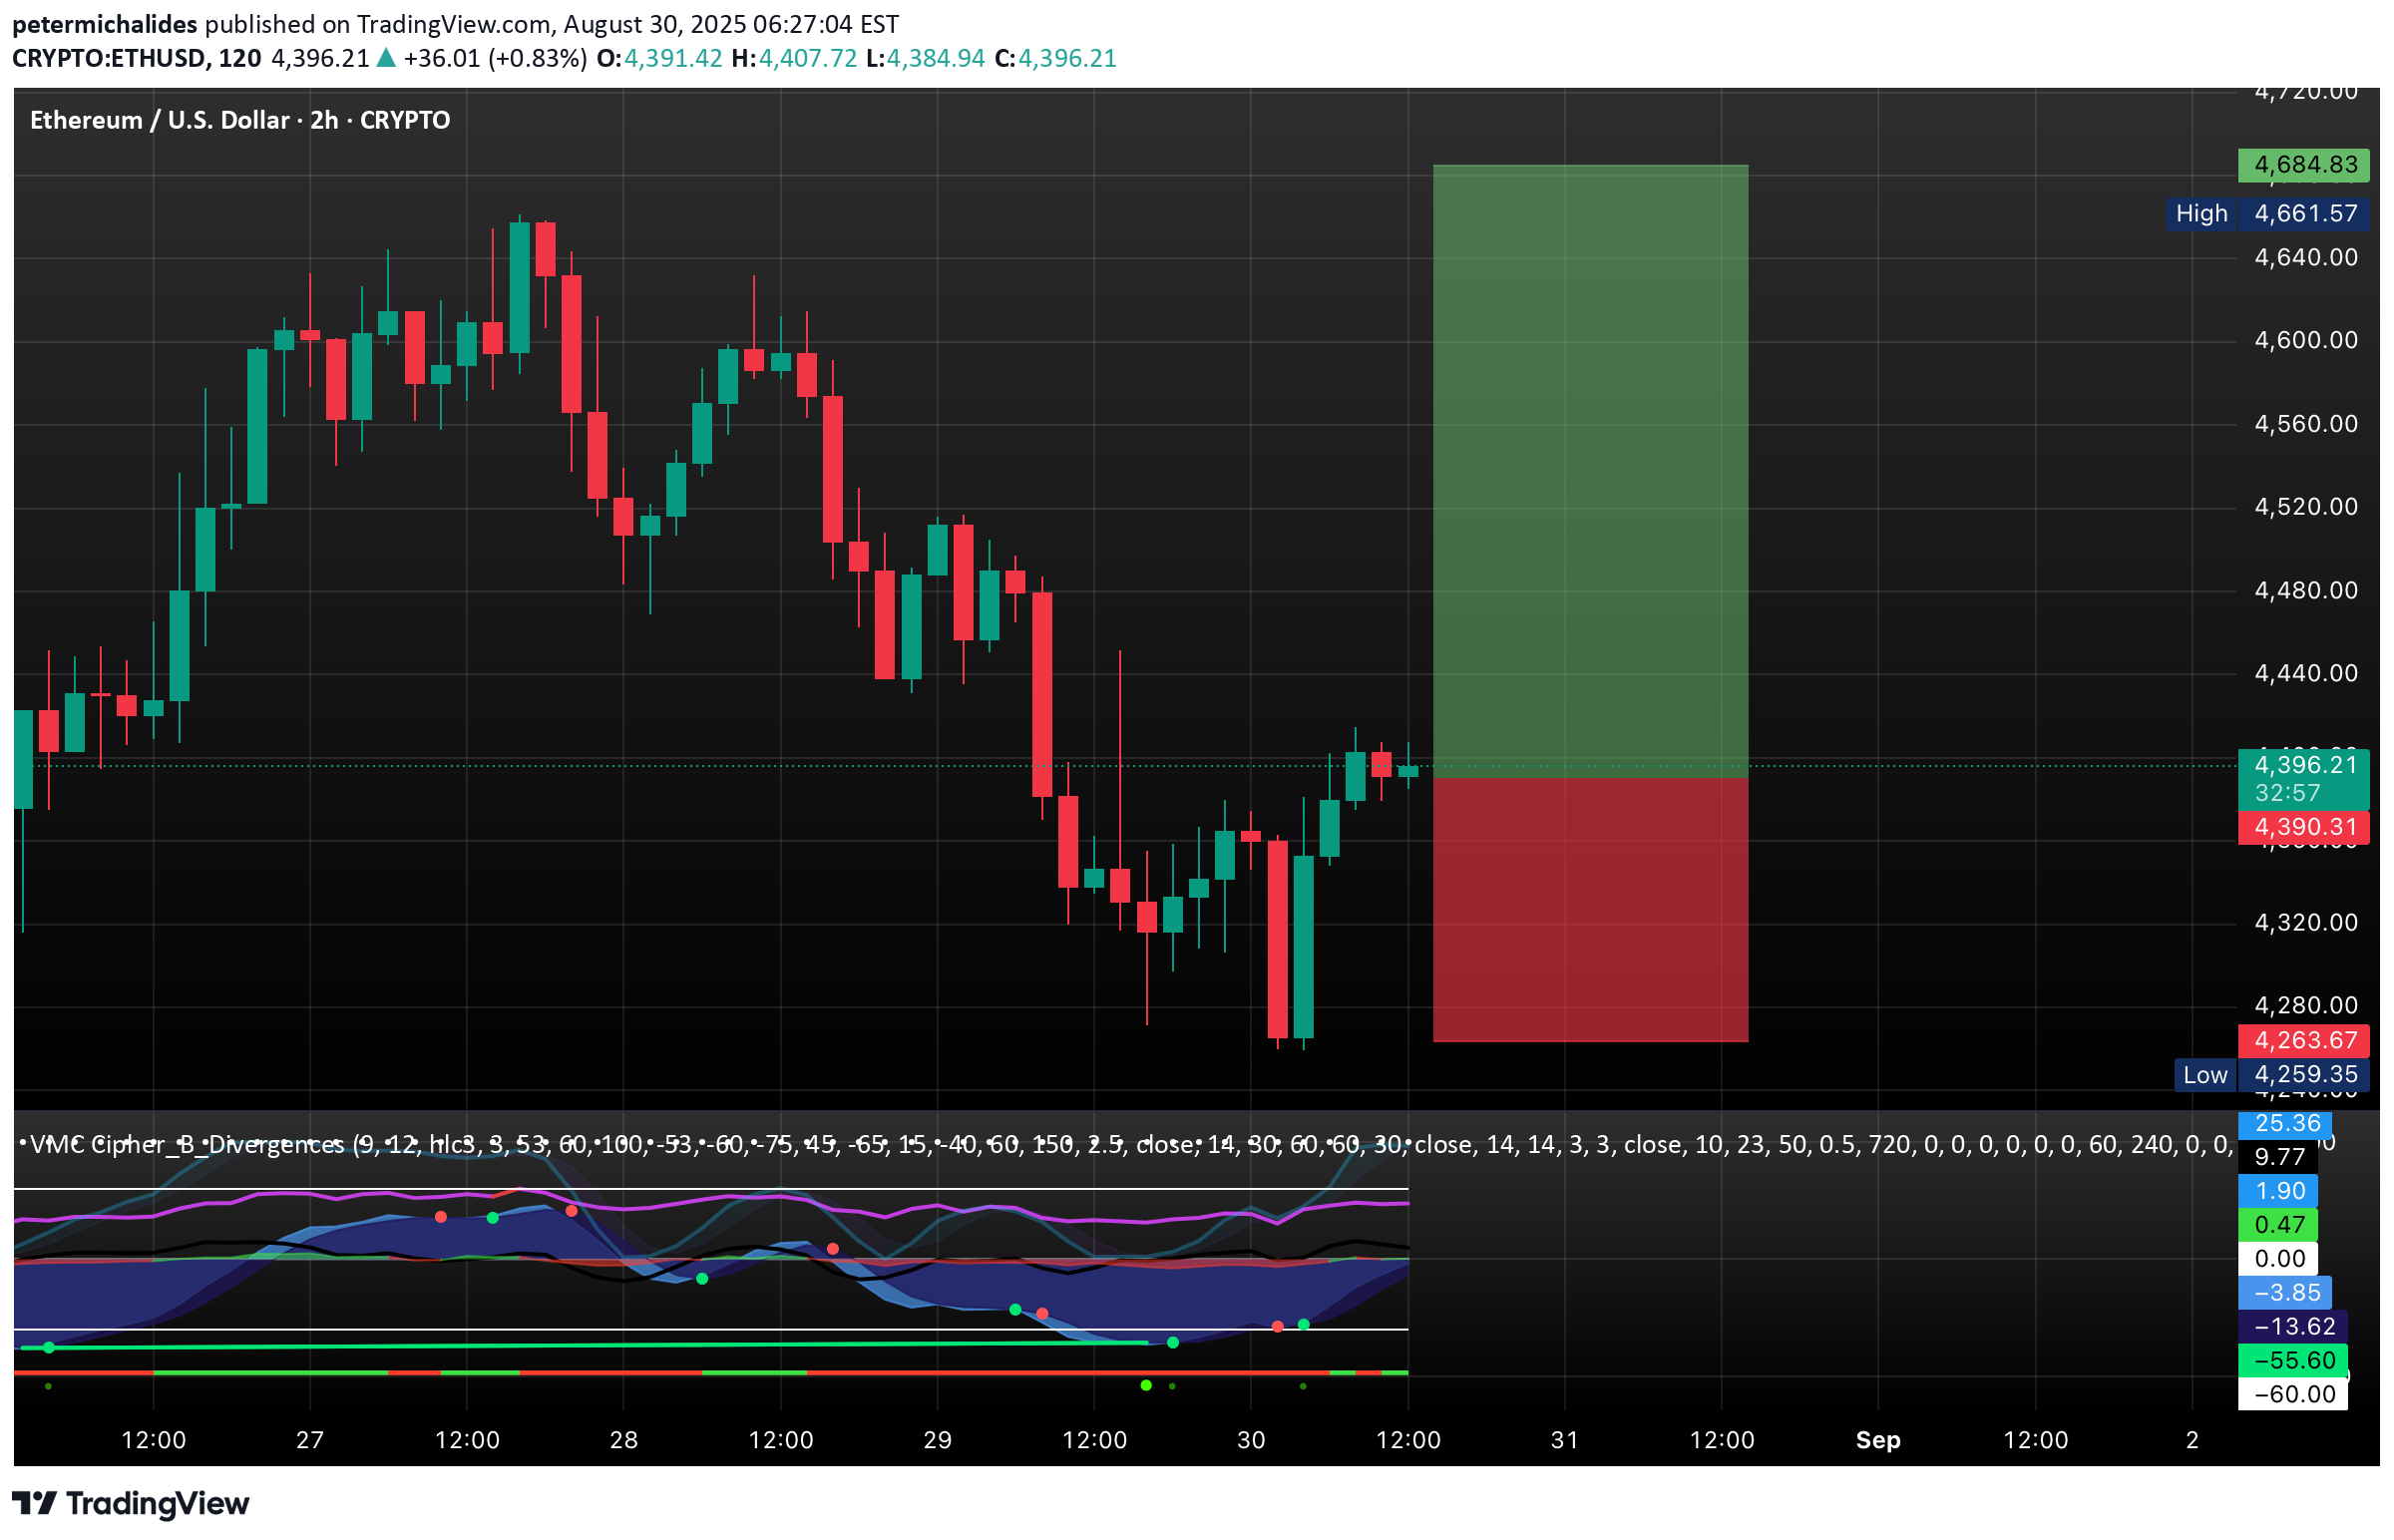
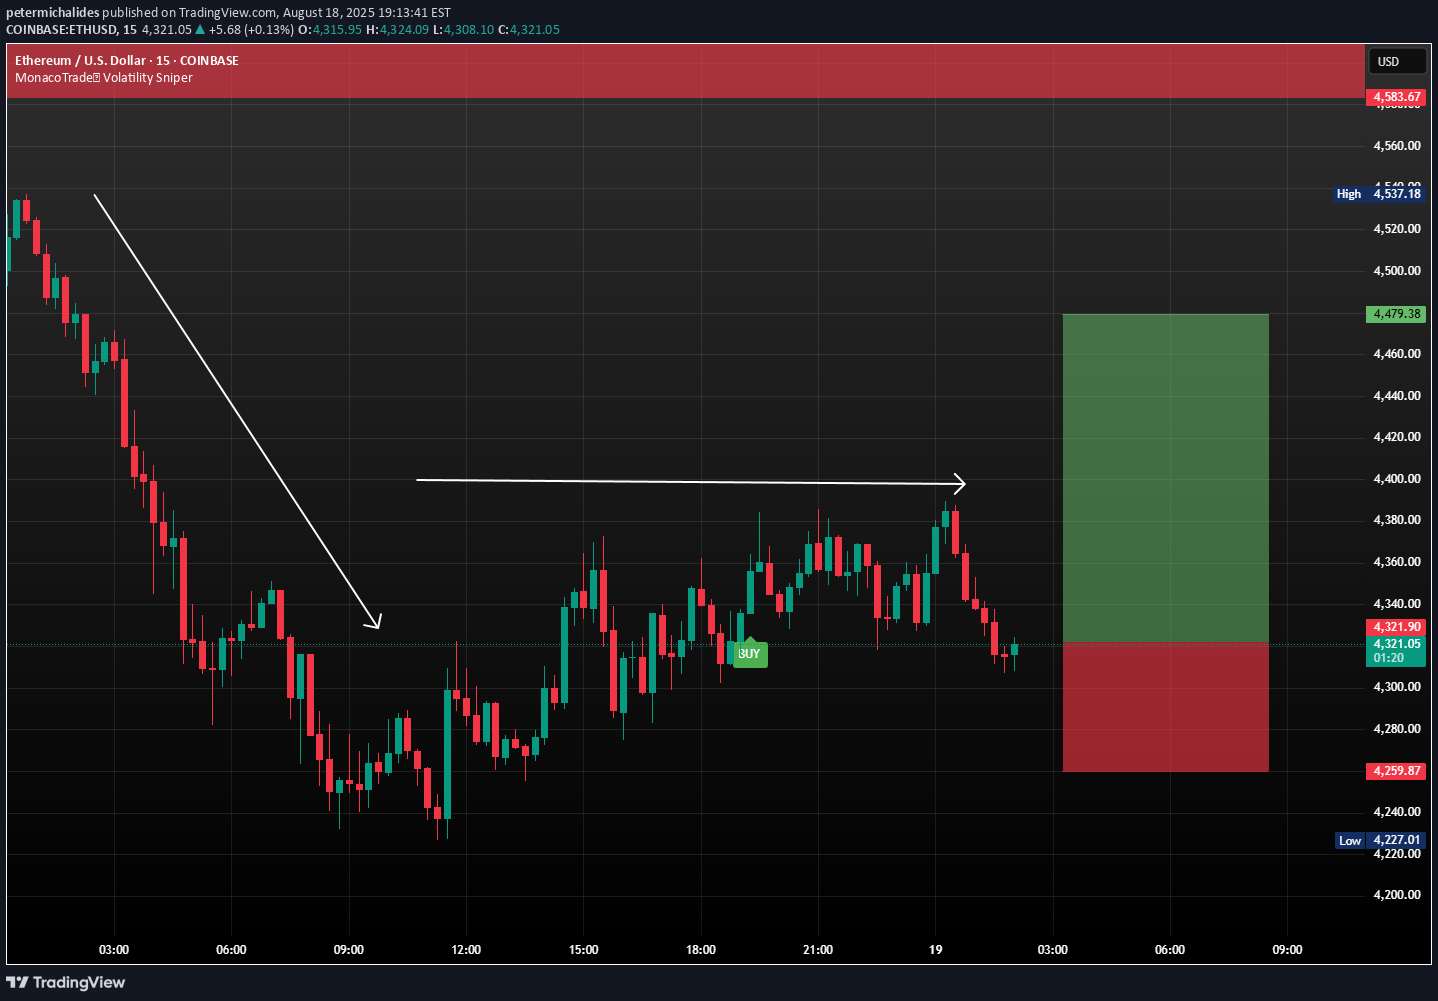
ETH is currently trading around $4,390–$4,430 after a summer rally and a modest pullback, reflecting broader crypto weakness linked to shifting U.S. rate-cut expectations. Demand from spot ETH ETFs has been a key support factor, with inflows continuing steadily and several trackers reporting multi-billion-dollar monthly additions. On-chain activity also remains robust, with DeFi TVL, daily transactions, and active addresses near 2025 highs, indicating that real usage underpins price action. The completion of the Pectra upgrade and upcoming scalability improvements further support medium-term confidence, while macro developments remain the main swing factor, as crypto reacts to Fed guidance and broader risk appetite. Technically, $4,300–$4,350 provides immediate support, with deeper support at $4,150–$4,200, while resistance sits at $4,600, above which $4,950–$5,000 becomes achievable. In the next 2–6 weeks, ETH is likely to trade in a range of $4,200–$4,950, with ETF inflows and strong on-chain metrics cushioning dips, though a decisive close above $4,600 would open a run toward $4,900–$5,000, and a close below $4,300 risks probing $4,150–$4,200. Into Q4, the outlook remains constructive but choppy, with potential to retest and break $5,000 if flows persist and macro conditions remain favorable. Key risks include a macro downside surprise, ETF outflows, and technical or regulatory setbacks. Market participants should watch ETF flow prints, on-chain activity, and U.S. rates data, as these will heavily influence ETH price action. Overall, near-term trading likely remains choppy between $4,200 and $4,950, with $4,600 acting as pivotal resistance and $4,300 as immediate support, while ETF inflows and real usage favor buy-the-dip behavior, and macro developments will determine whether ETH can sustainably challenge $5,000.
petermichalides
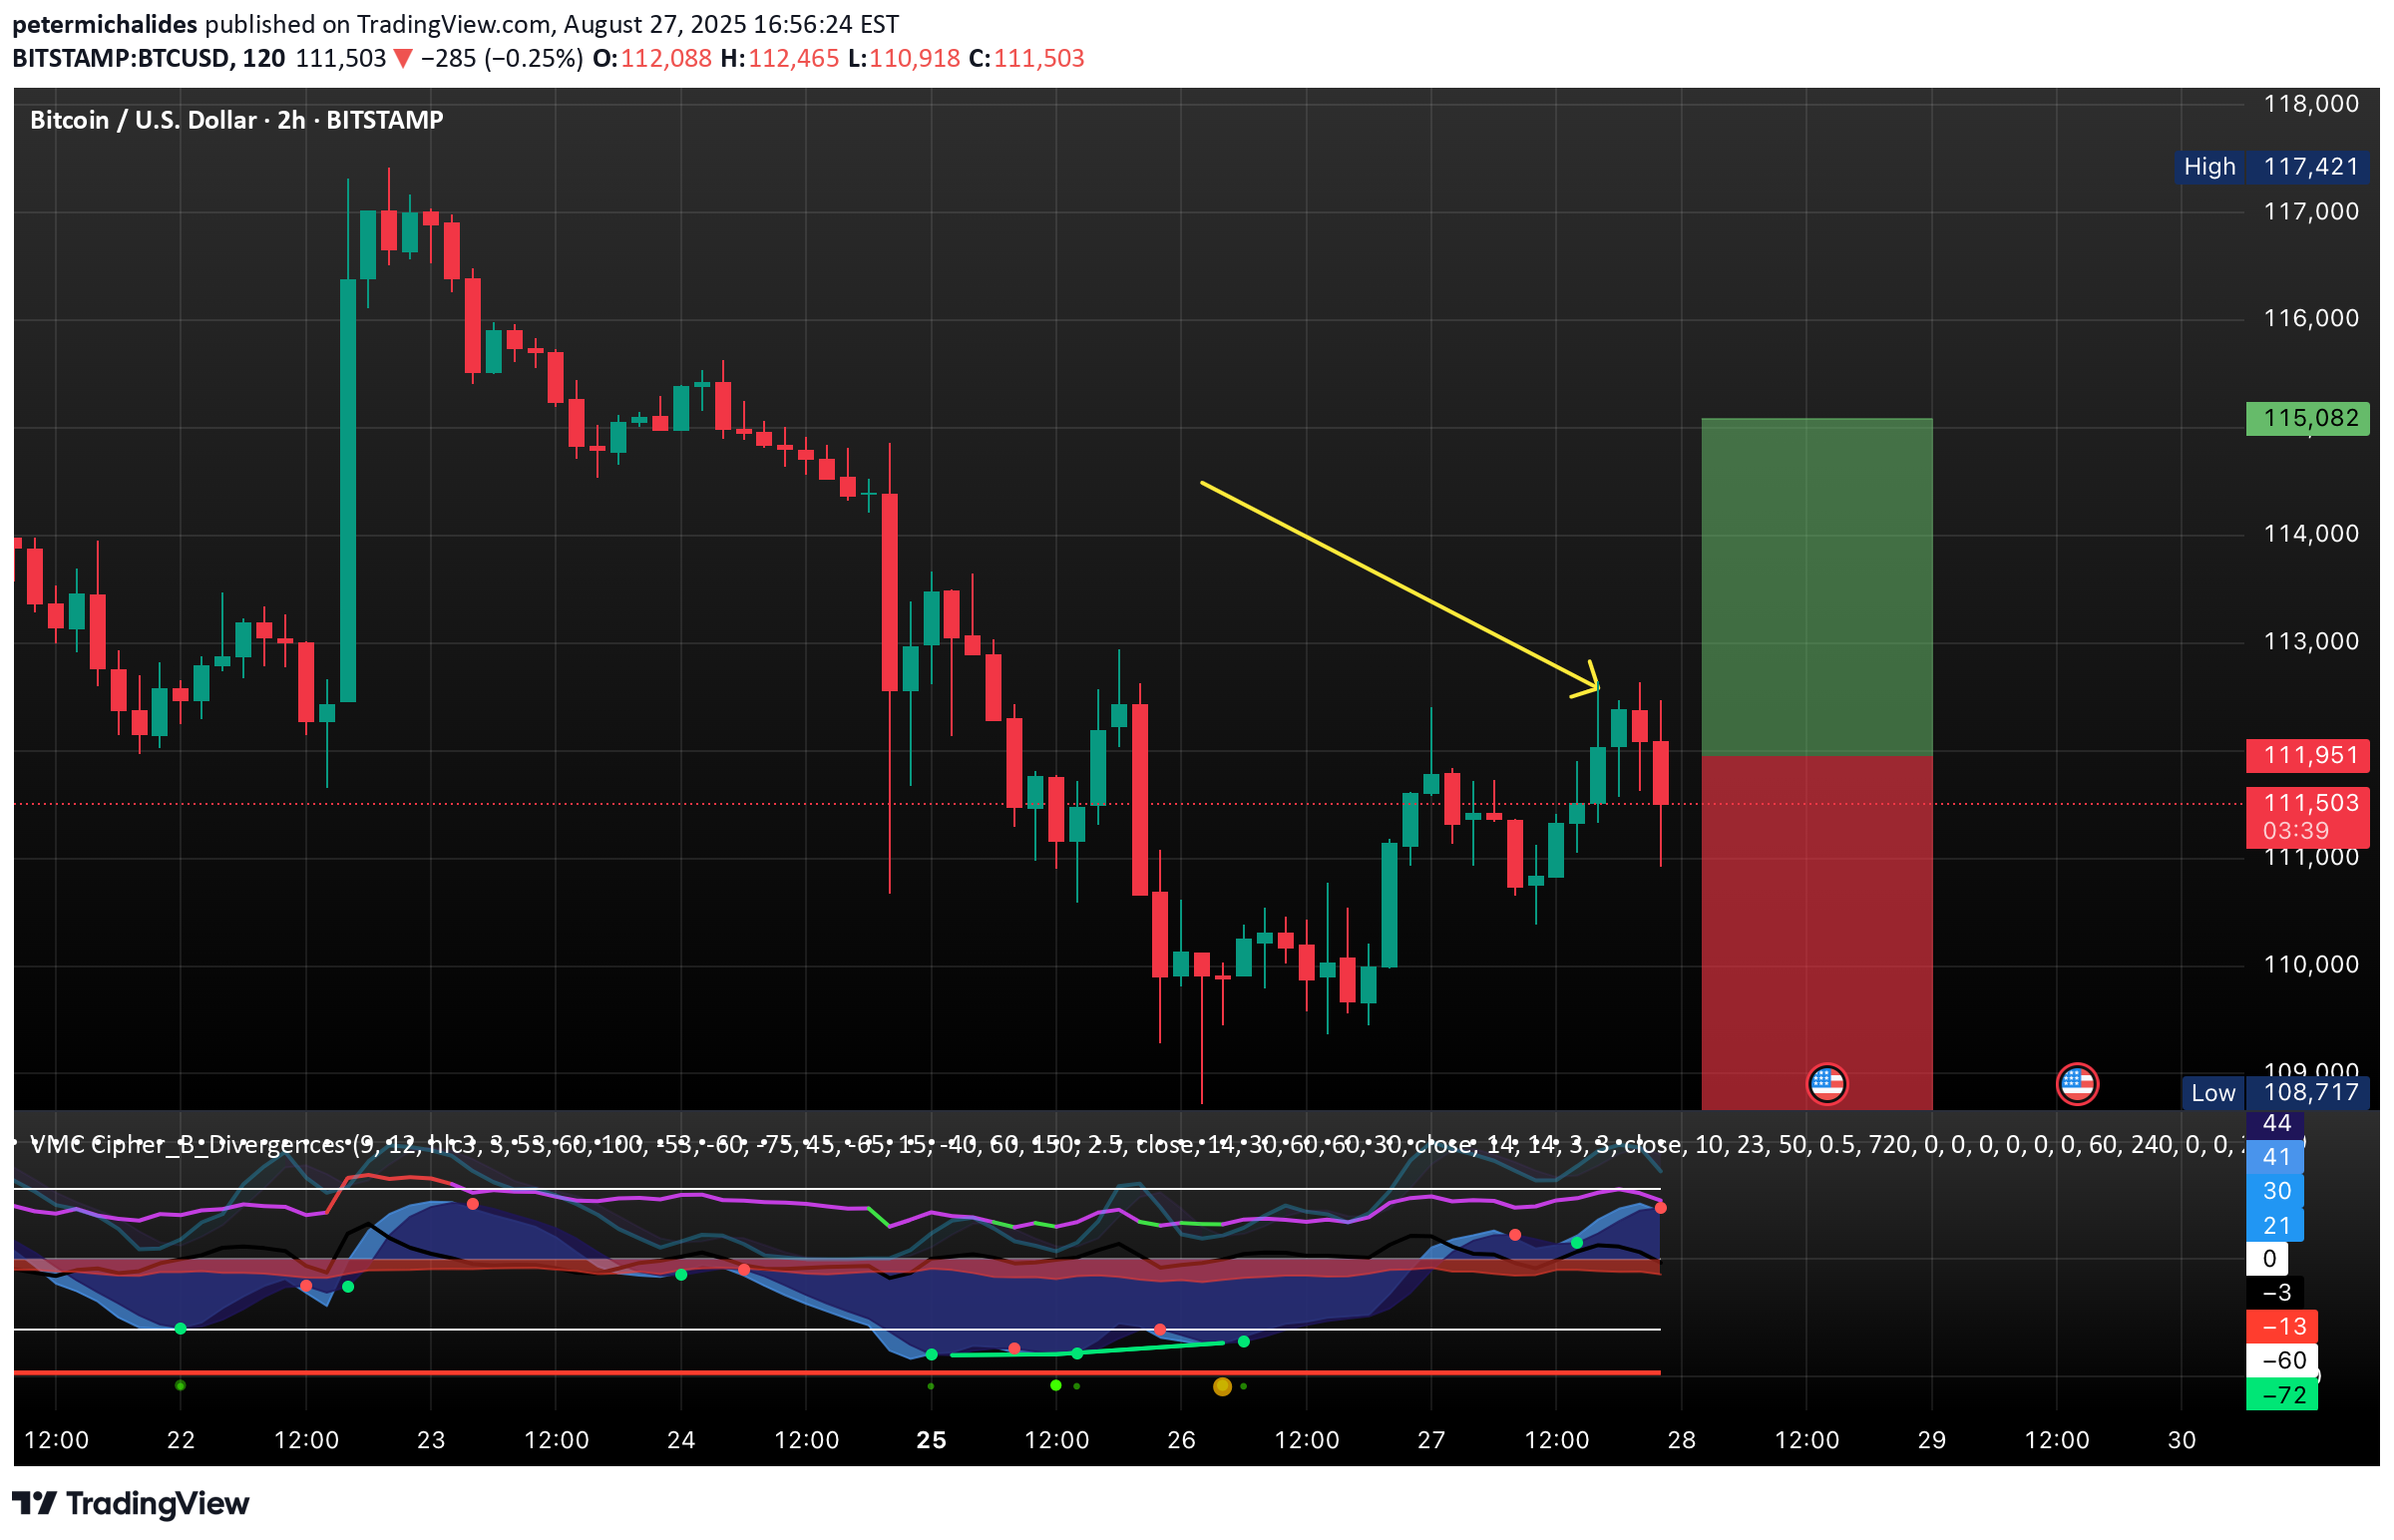
As of August 27, 2025, Bitcoin (BTC) is trading at approximately $111,612, reflecting a slight daily increase. The cryptocurrency market has experienced notable developments recently, influencing both short-term price movements and long-term trends. The U.S. government's establishment of the Strategic Bitcoin Reserve in March 2025, under President Trump's executive order, has significantly impacted market sentiment. This move positions Bitcoin as a national reserve asset, with the U.S. Treasury holding an estimated 198,000 BTC. Such institutional adoption has bolstered investor confidence, contributing to Bitcoin's recent price surge to over $124,000 earlier this month... Additionally, the rise of Bitcoin Treasury Companies (BTCs), such as MicroStrategy, which now holds around 630,000 BTC, has further reduced available supply on exchanges. Reports indicate that Bitcoin availability on exchanges fell below 15% in July 2025, a low not seen since 2018. This scarcity has intensified demand, driving prices higher. Bitcoin is currently consolidating between the $112,000 and $115,000 levels. The 50-day exponential moving average (EMA) near $114,000 has acted as a resistance point, while support is observed around $110,000. A breakout above $115,000 could pave the way for a retest of the $120,000 to $125,000 range. Conversely, a decline below $110,000 may lead to further downside, with potential support levels at $108,000 and $105,000. The Relative Strength Index (RSI) is hovering around 42, indicating that the market is not overbought, allowing room for upward movement. *Bitcoin's market is currently characterized by strong institutional support, reduced supply on exchanges, and positive regulatory developments. While short-term fluctuations are possible, the overall trend points towards continued growth. Investors should monitor key support and resistance levels, as well as macroeconomic indicators, to navigate the evolving landscape effectively.
petermichalides
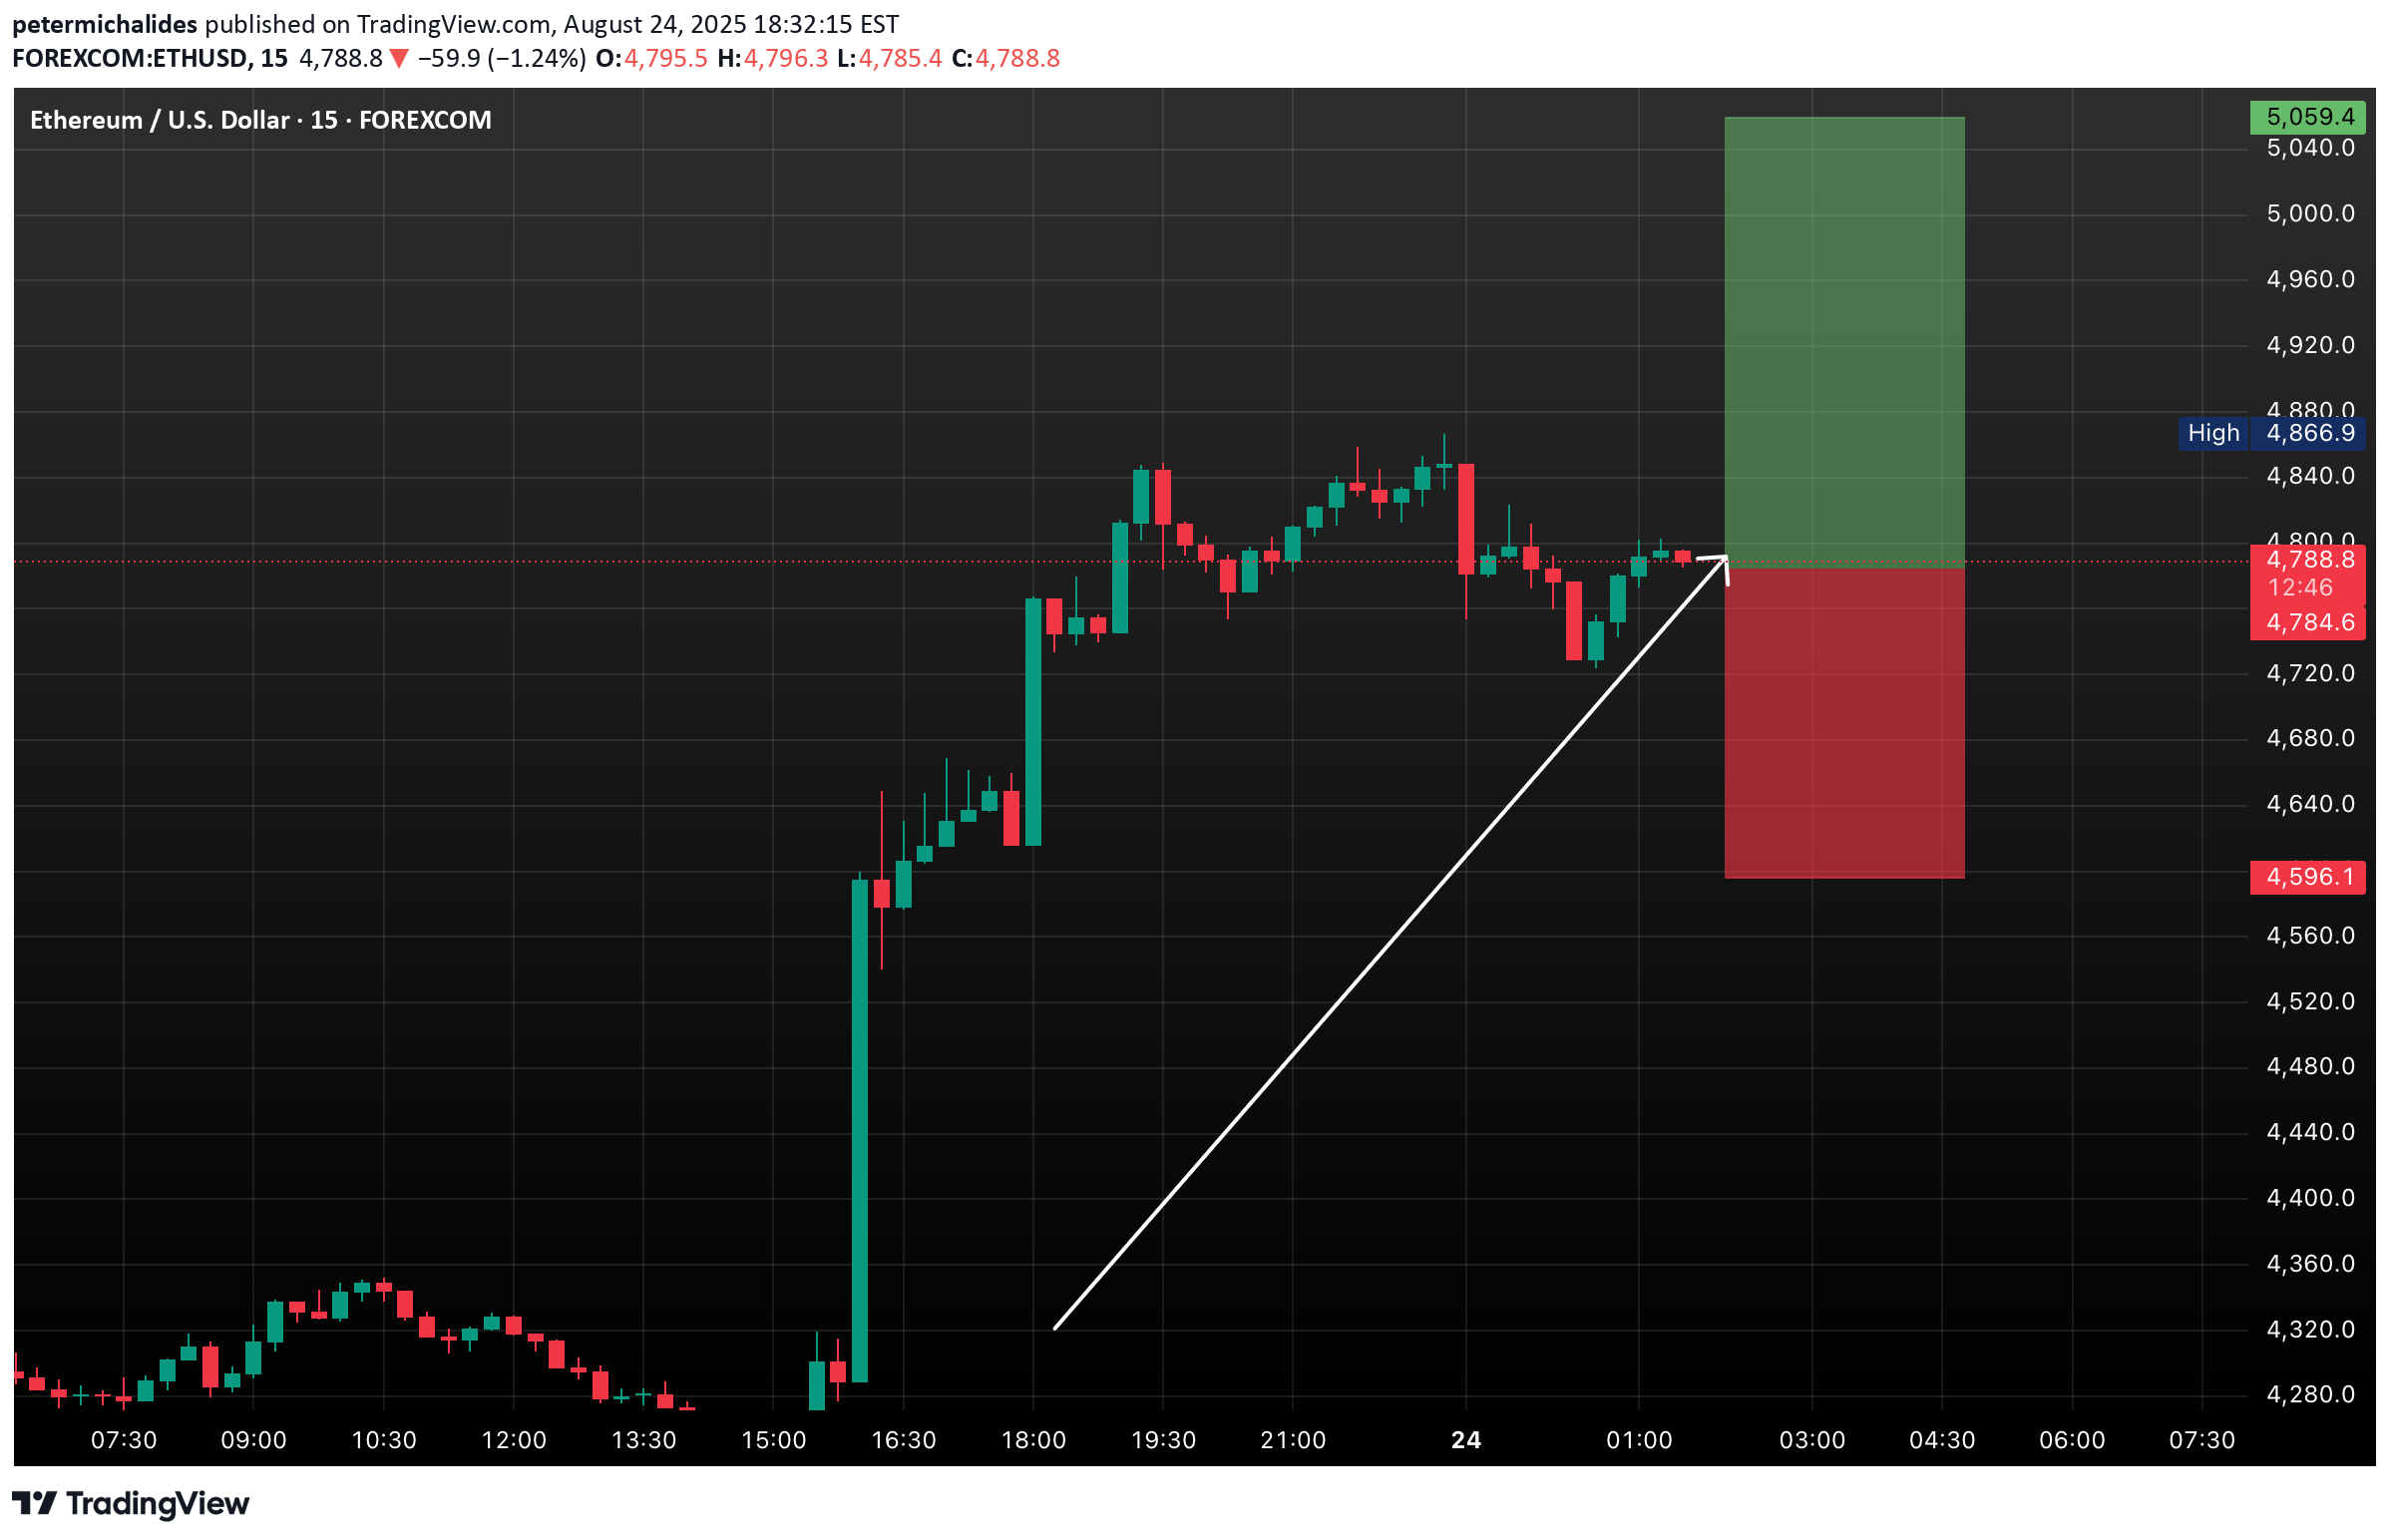
As of August 25, 2025, Ethereum (ETH) is trading at approximately $4,795.60, showing a steady upward trajectory since early August. This bullish momentum is supported by several key factors, including institutional interest, ETF inflows, and the ongoing strength of decentralized finance (DeFi) applications. ETH has recently surpassed the $4,750 resistance level, indicating a potential move towards the $5,000–$5,200 range. The next significant resistance is around $5,000, which, if broken, could pave the way for a retest of the all-time high near $5,200. Conversely, support levels are found at $4,700 and $4,600–$4,400. A drop below $4,600 could signal a short-term pullback. Ethereum's recent price surge is attributed to increased institutional demand, particularly following the launch of Ethereum ETFs, which have attracted significant capital inflows. Additionally, the Ethereum network's upgrades and the growing adoption of Layer 2 solutions have enhanced scalability and reduced transaction costs, further bolstering investor confidence. Outlook for Q4 2025 Looking ahead, if ETH maintains its current trajectory and breaks through the $5,200 resistance, it could target the $6,000–$7,000 range by the end of the year. However, market volatility remains a factor, and investors should be prepared for potential fluctuations. *Ethereum's current bullish trend is supported by strong technical indicators and positive fundamental developments. While the path to new all-time highs appears promising, it's crucial for investors to monitor key support and resistance levels and remain cautious of market volatility.
petermichalides
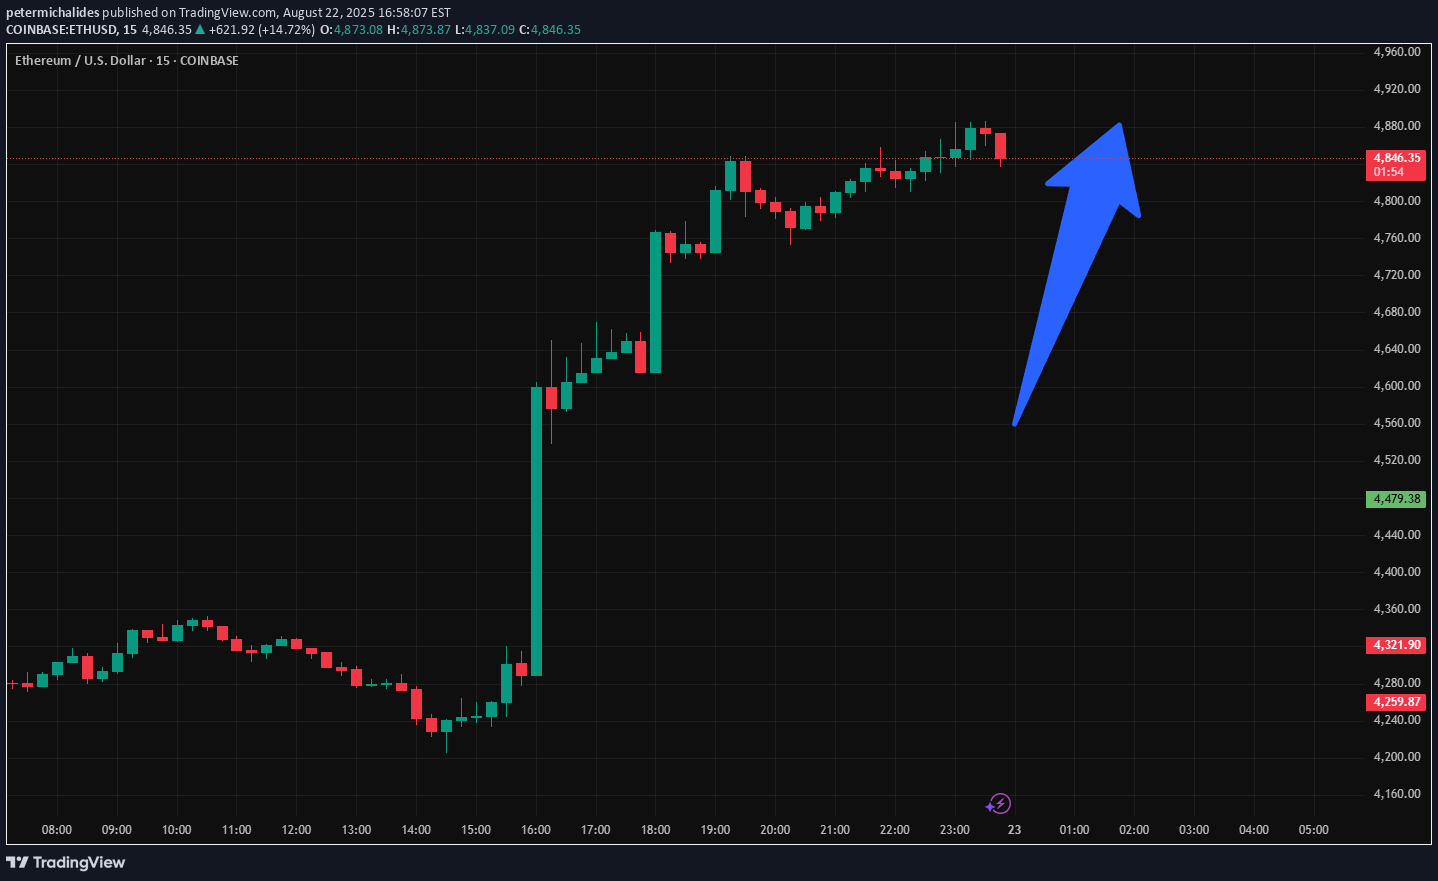
Over the next seven days, Ethereum (ETH) is projected to experience moderate bullish momentum, potentially reaching a price range between $4,800 and $5,000. Currently, ETH is trading at approximately $4,852.49, reflecting a recent uptick of 14.33%. This positive movement is attributed to favorable macroeconomic indicators, including expectations of an interest rate cut by the U.S. Federal Reserve, which has historically supported risk assets like cryptocurrencies. Technical analysis suggests that ETH is trading above key support levels and is approaching resistance zones. If the price breaks through these resistance levels, it could pave the way for further gains. Conversely, a failure to maintain upward momentum may lead to a consolidation phase or a slight pullback. Market sentiment remains cautiously optimistic, with institutional interest continuing to grow. However, investors should remain vigilant, as the cryptocurrency market is known for its volatility and susceptibility to sudden shifts in sentiment. In summary, ETH is poised for potential gains over the next week, but market participants should stay informed and prepared for any unforeseen developments that could impact price movements.
petermichalides
Ethereum has demonstrated a strong bullish trend in August, with prices approaching key resistance levels. Analysts suggest that a sustained break above $4,800 could propel ETH toward $5,500–$6,000 by the end of the month. Institutional interest remains robust, with significant inflows into Ethereum-based ETFs and increased holdings by digital asset treasury firms like Bitmine Immersion Technologies and Sharplink Gaming. * Resistance Levels: $4,800, $5,000, $5,500 * Support Levels: $4,000, $3,800 * Key Indicators: Strong Relative Strength Index (RSI) and bullish Moving Average Convergence Divergence (MACD) suggest continued upward momentum. Ethereum is poised for a potential breakout. A decisive move above $4,800, supported by strong trading volumes, could initiate a rally toward $5,500–$6,000. Conversely, a drop below $4,000 might lead to a retest of the $3,800 support zone.
petermichalides
Bitcoin has been trading in a strong bullish cycle, recently touching highs above $124,000, driven by institutional inflows, favorable macro sentiment, and expectations of Federal Reserve rate cuts. However, the market is now showing early signs of exhaustion, with prices struggling to maintain momentum above the $118,000–$120,000 resistance zone. From a technical perspective, the 50-day moving average currently sits near $107,000, acting as the first major support level. A decisive break below it could open the door to a deeper retracement toward the psychological $100,000 level, which also aligns with a key historical demand zone. The RSI on the daily chart is entering overbought territory, suggesting that a short-term pullback may be healthy for the market. Meanwhile, MACD momentum is flattening, indicating that bulls may be losing steam after an aggressive rally. Fundamentally, Bitcoin remains in a strong long-term uptrend, but short-term risks cannot be ignored. Regulatory headlines, macroeconomic shocks, or a failure to hold technical support could accelerate a correction. Many analysts, including Arthur Hayes, have mentioned the possibility of a drop to $100K, not as a collapse but as a potential accumulation phase before another leg higher. Key Levels to Watch: *Support: $107,000 – $100,000 *Resistance: $120,000 – $124,500 *Breakout Target: Above $125,000 could trigger a run toward $135,000+ *Breakdown Target: Below $100,000 could extend to $95,000 While the macro trend remains bullish, a short-term dip toward $100K is a realistic scenario if momentum continues to fade. Long-term holders may see such a move as an opportunity, while short-term traders should watch for a confirmed break of $107K to position accordingly.
petermichalides
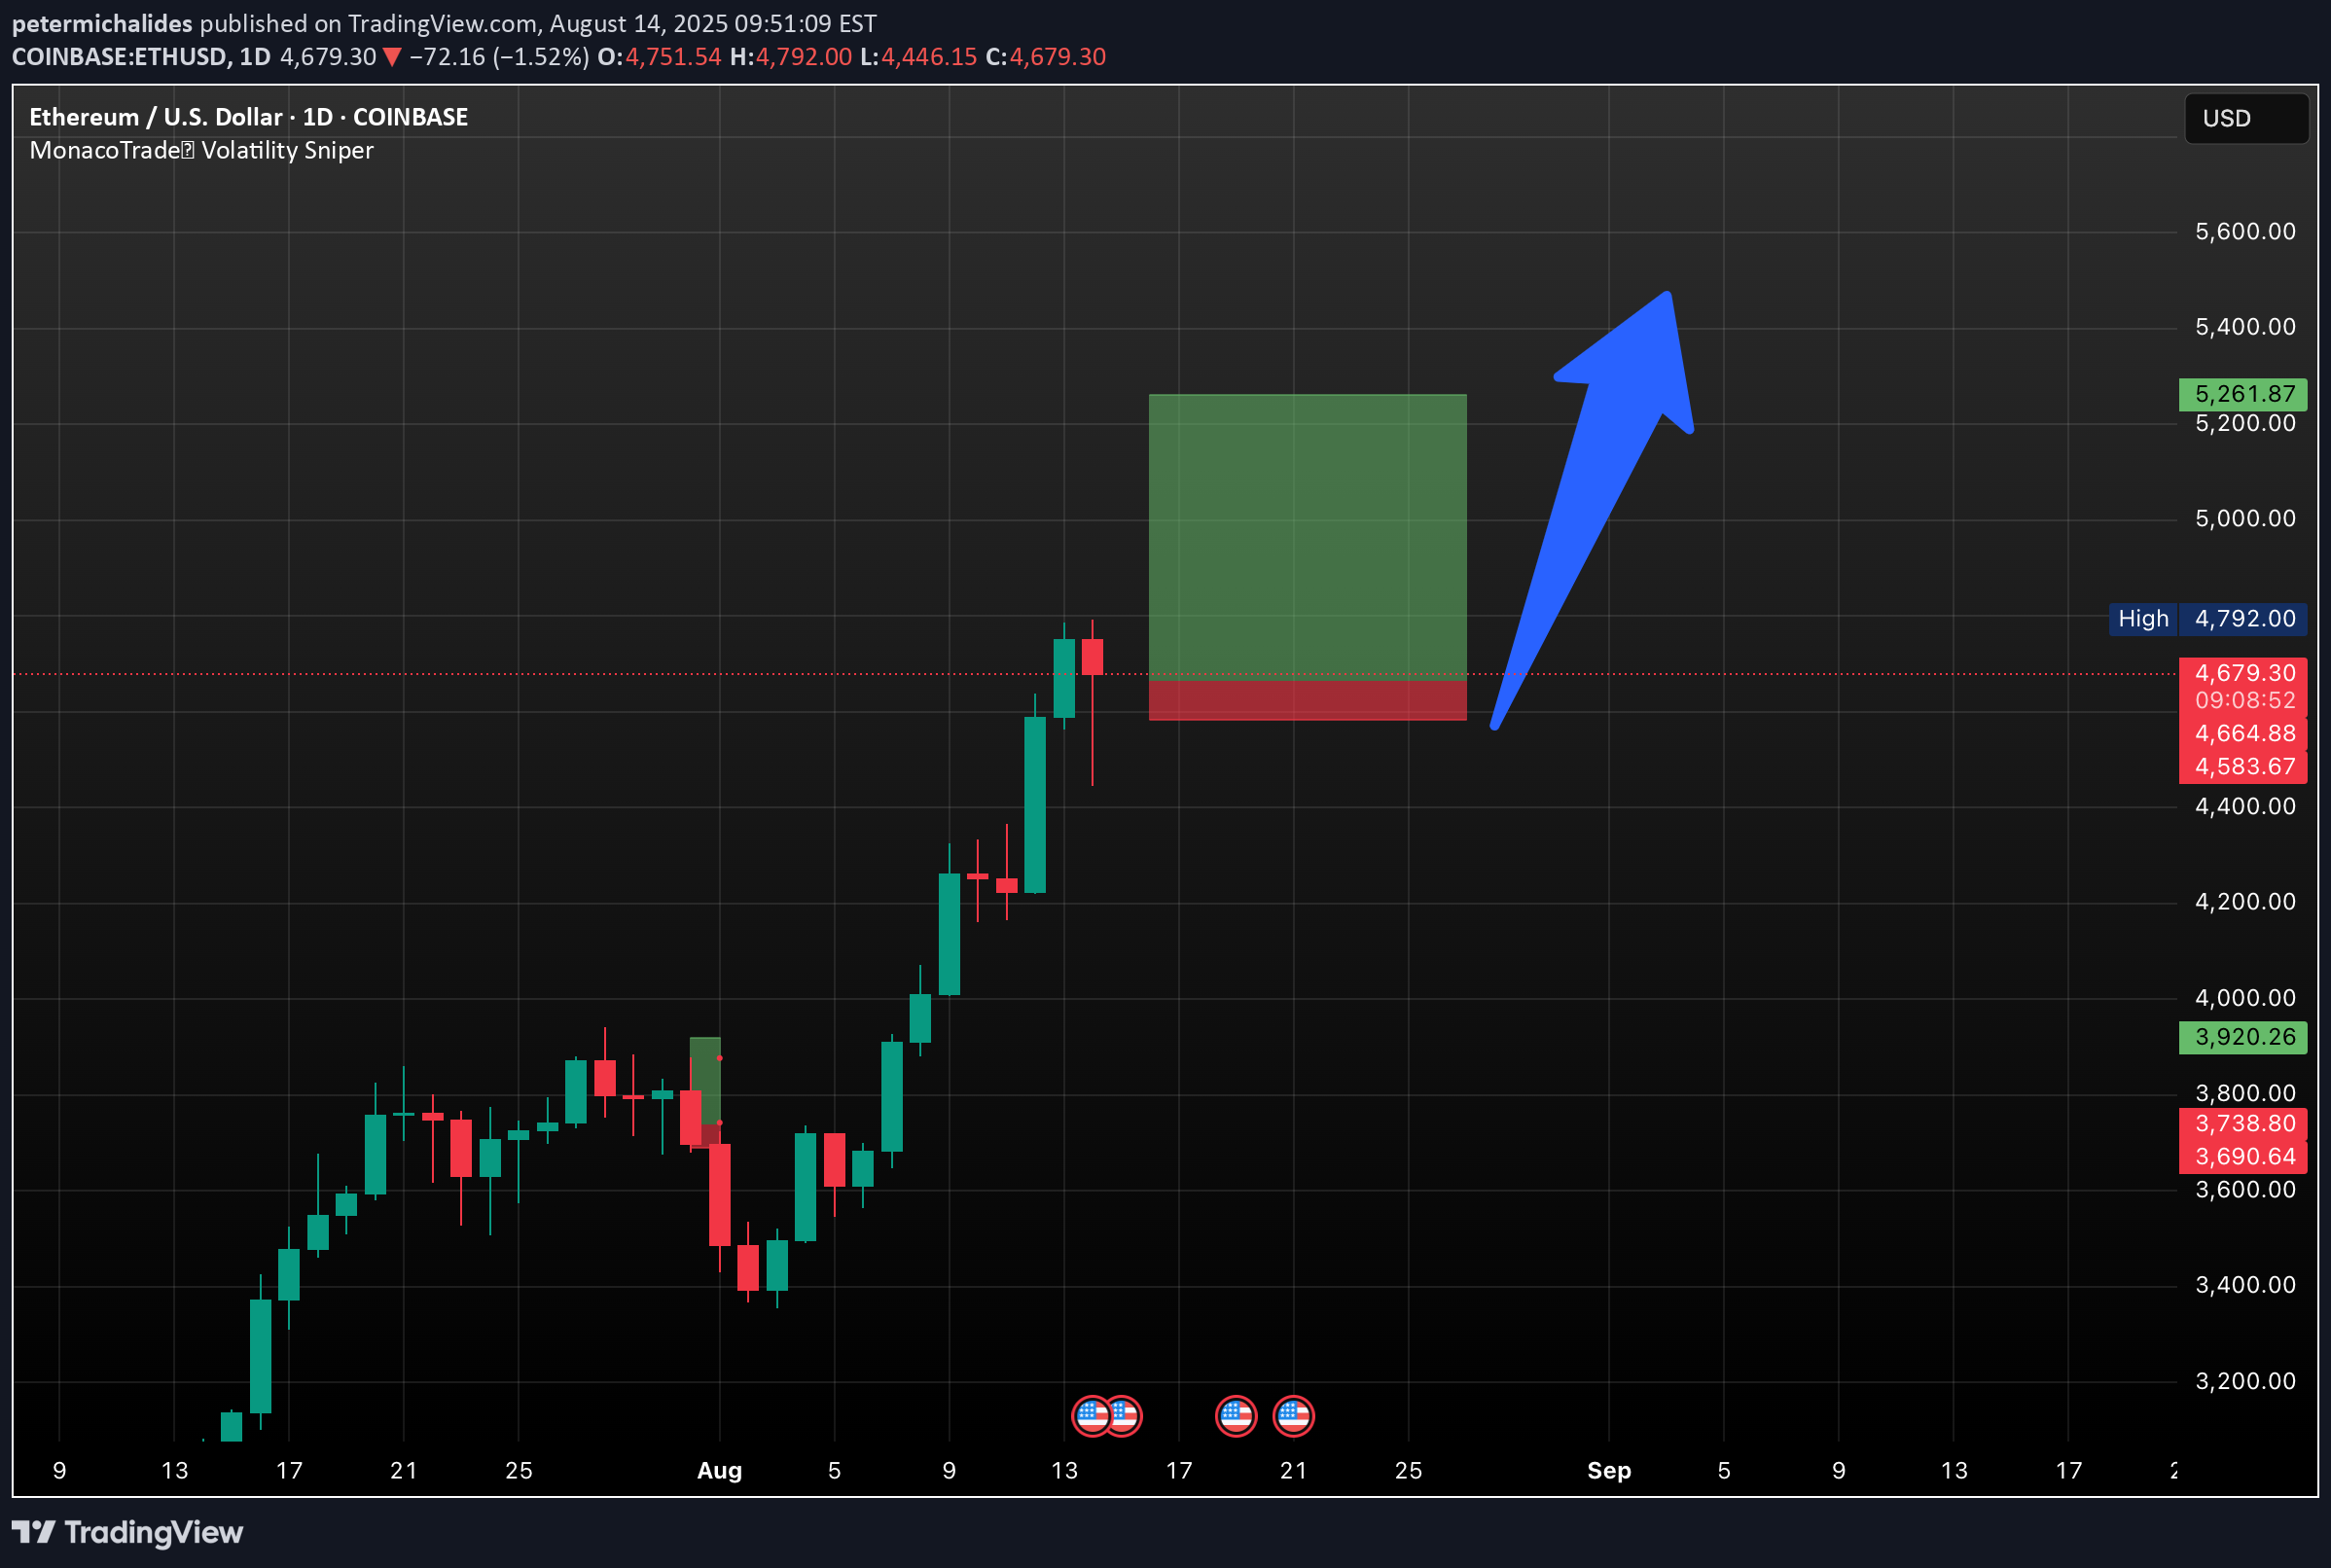
Ethereum recently surged over 50% in the last month, currently trading near $4,700, approaching its all-time high of ~$4,868 from November 2021. Weekly momentum remains strong; Ethereum is riding a bullish channel. Some technical indicators hint at potential overbought conditions, but these can persist in strong rallies. *Support lies between $4,400–4,500, with more substantial support around $4,145 and down to $3,800–3,700 in case of deeper pullbacks *Most indicators point toward a continuation of the bullish channel, with potential for slight corrections as Ethereum tests key resistance levels. Ethereum is currently in a strong bullish phase, trading near its all-time high, with momentum supported by institutional inflows, regulatory clarity, and recent protocol upgrades. Short-term projections suggest a possible breakout above $4,800, with targets between $5,200 and $6,000 in the coming weeks. By the end of 2025, most forecasts see ETH reaching at least $7,500, while more aggressive scenarios point toward $10,000 or higher. In the longer term, Ethereum’s expanding role in stablecoins, decentralized finance, and institutional adoption could drive substantial price appreciation, with major banks forecasting $25,000 by 2028 and some optimistic models aiming for $40,000+ by 2030. However, this growth path is not without risks; potential market corrections, regulatory changes, and competition from other blockchain platforms could affect momentum. Overall, Ethereum remains one of the most promising digital assets in the crypto market, with both technical and fundamental factors aligning for continued growth, provided broader market sentiment stays positive.
petermichalides
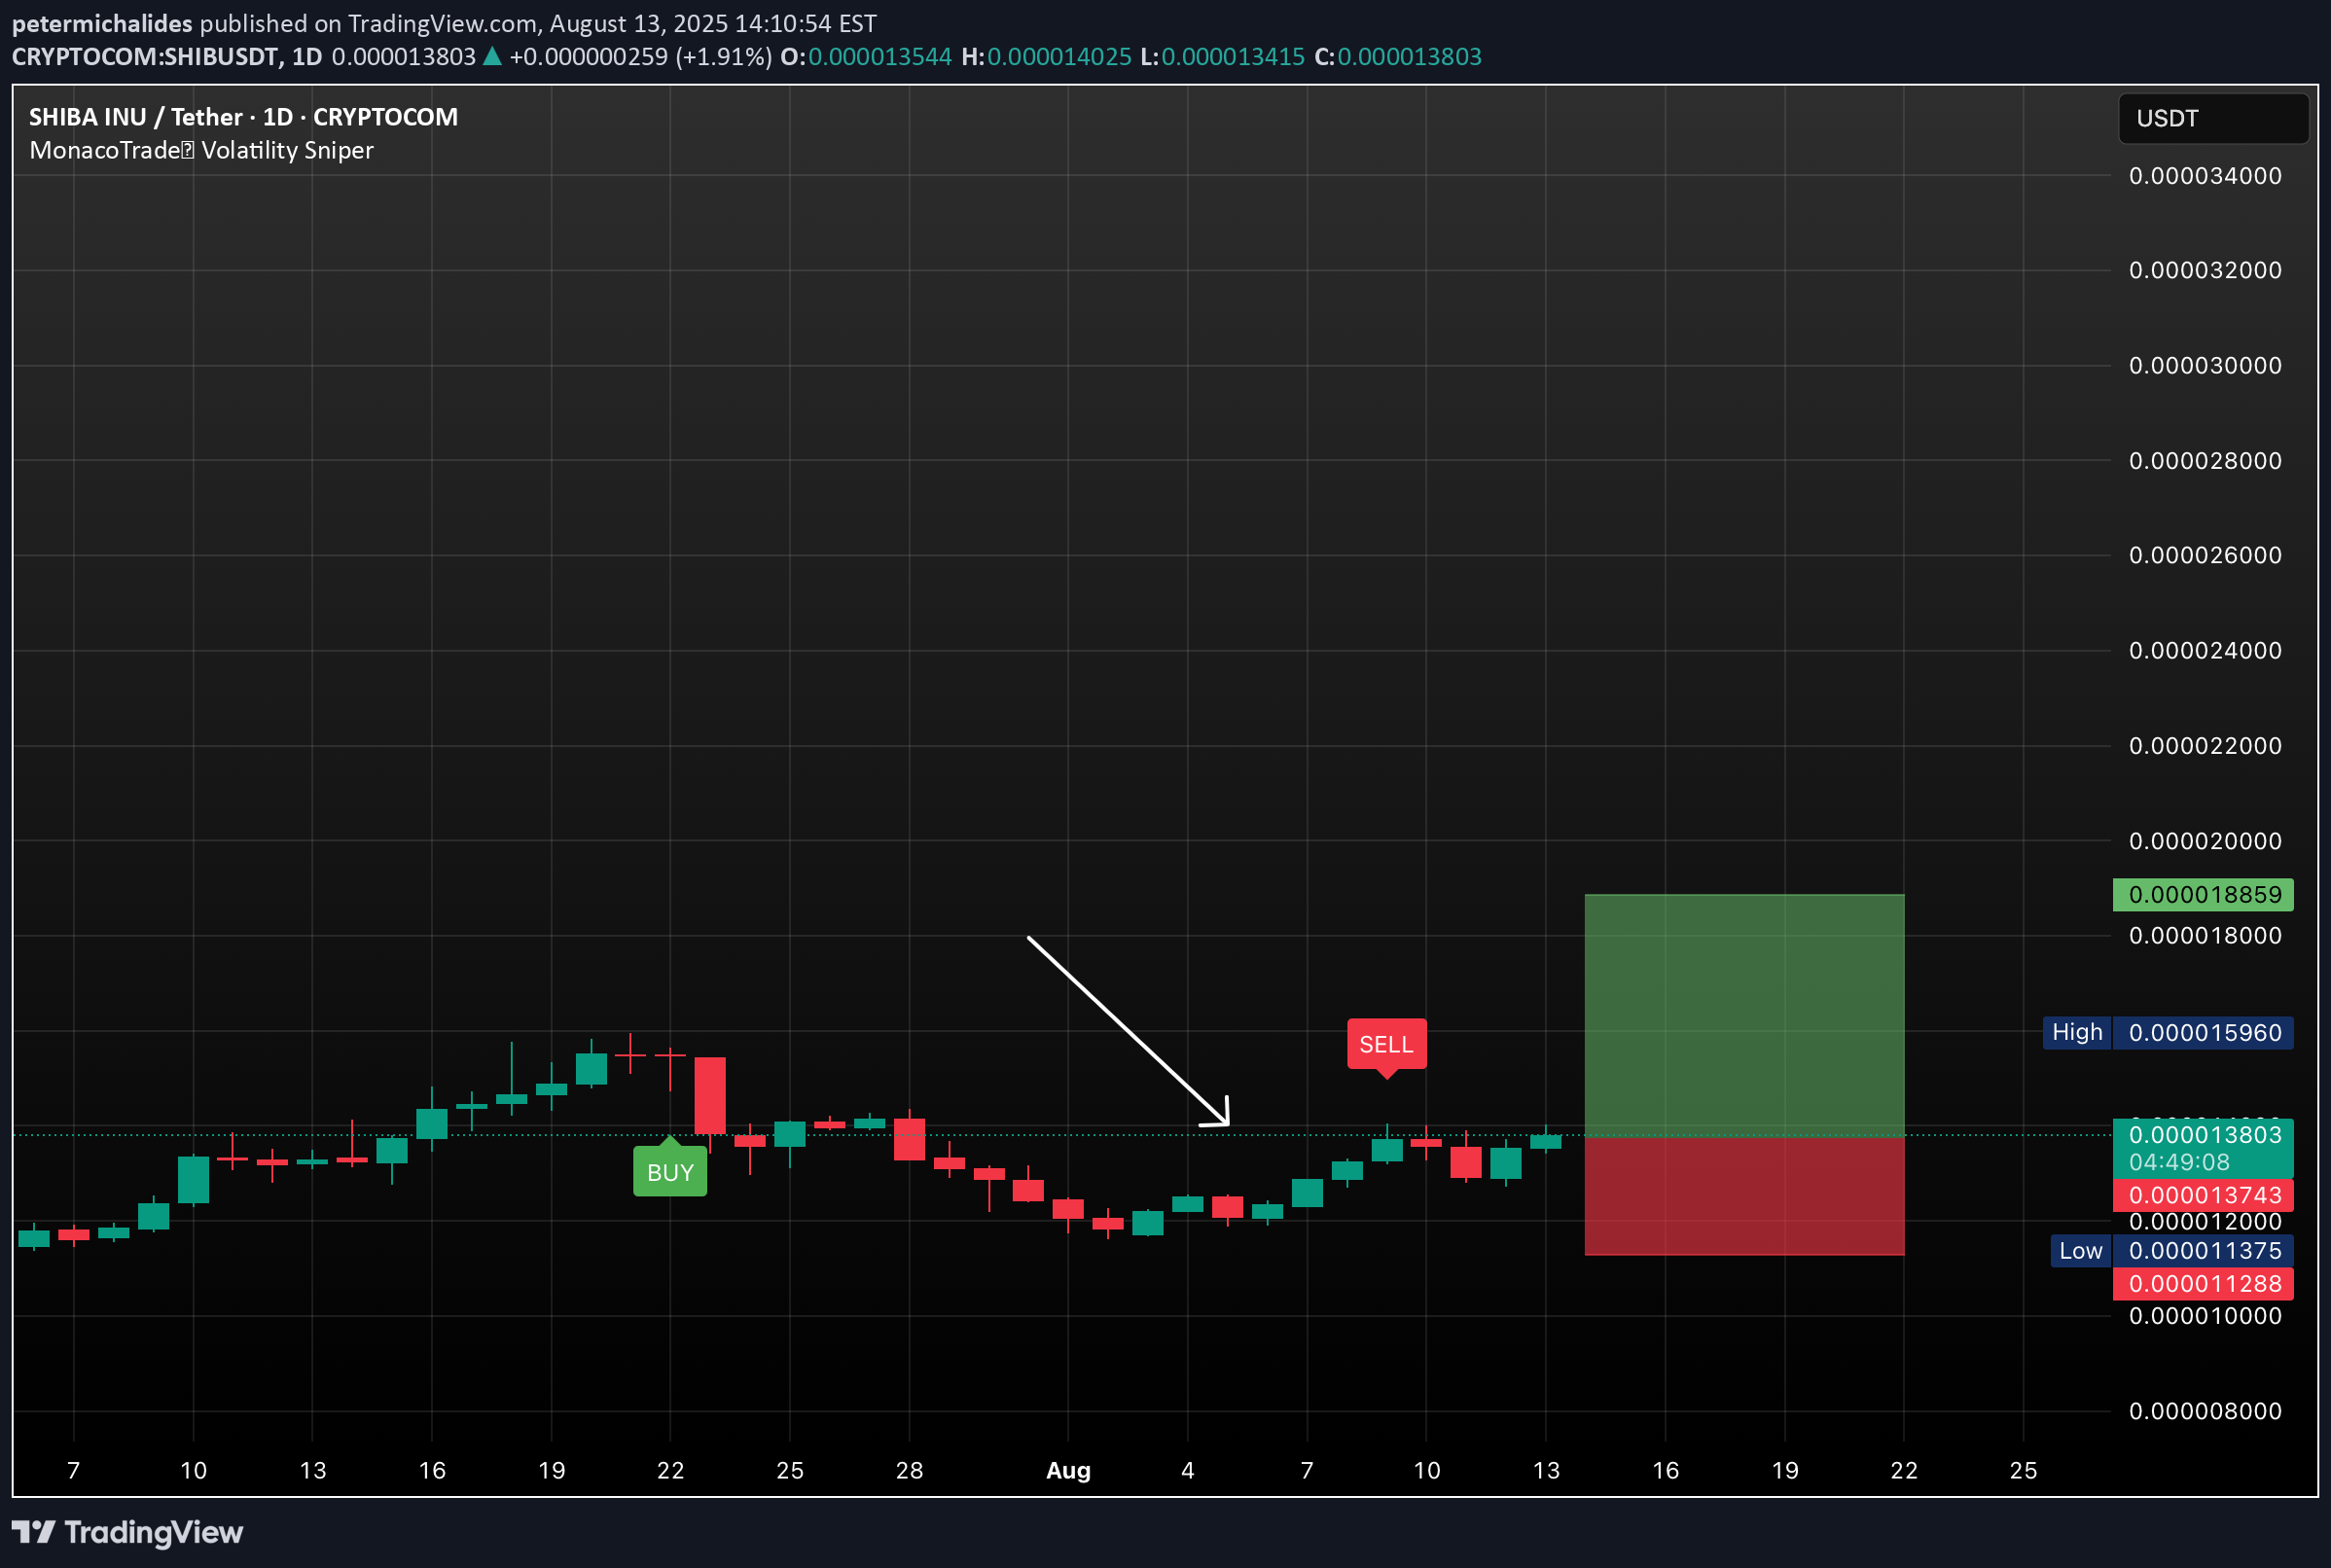
Shiba Inu is exhibiting a neutral to slightly bullish trend. The price is currently testing the support level around $0.00001350, with resistance near $0.00001400. A breakout above this resistance could signal a continuation of the upward momentum. *Bullish Scenario: A breakout above $0.00001400 could lead to a rally towards $0.00001500. *Bearish Scenario: A drop below $0.00001350 may result in a decline towards $0.00001250.
petermichalides
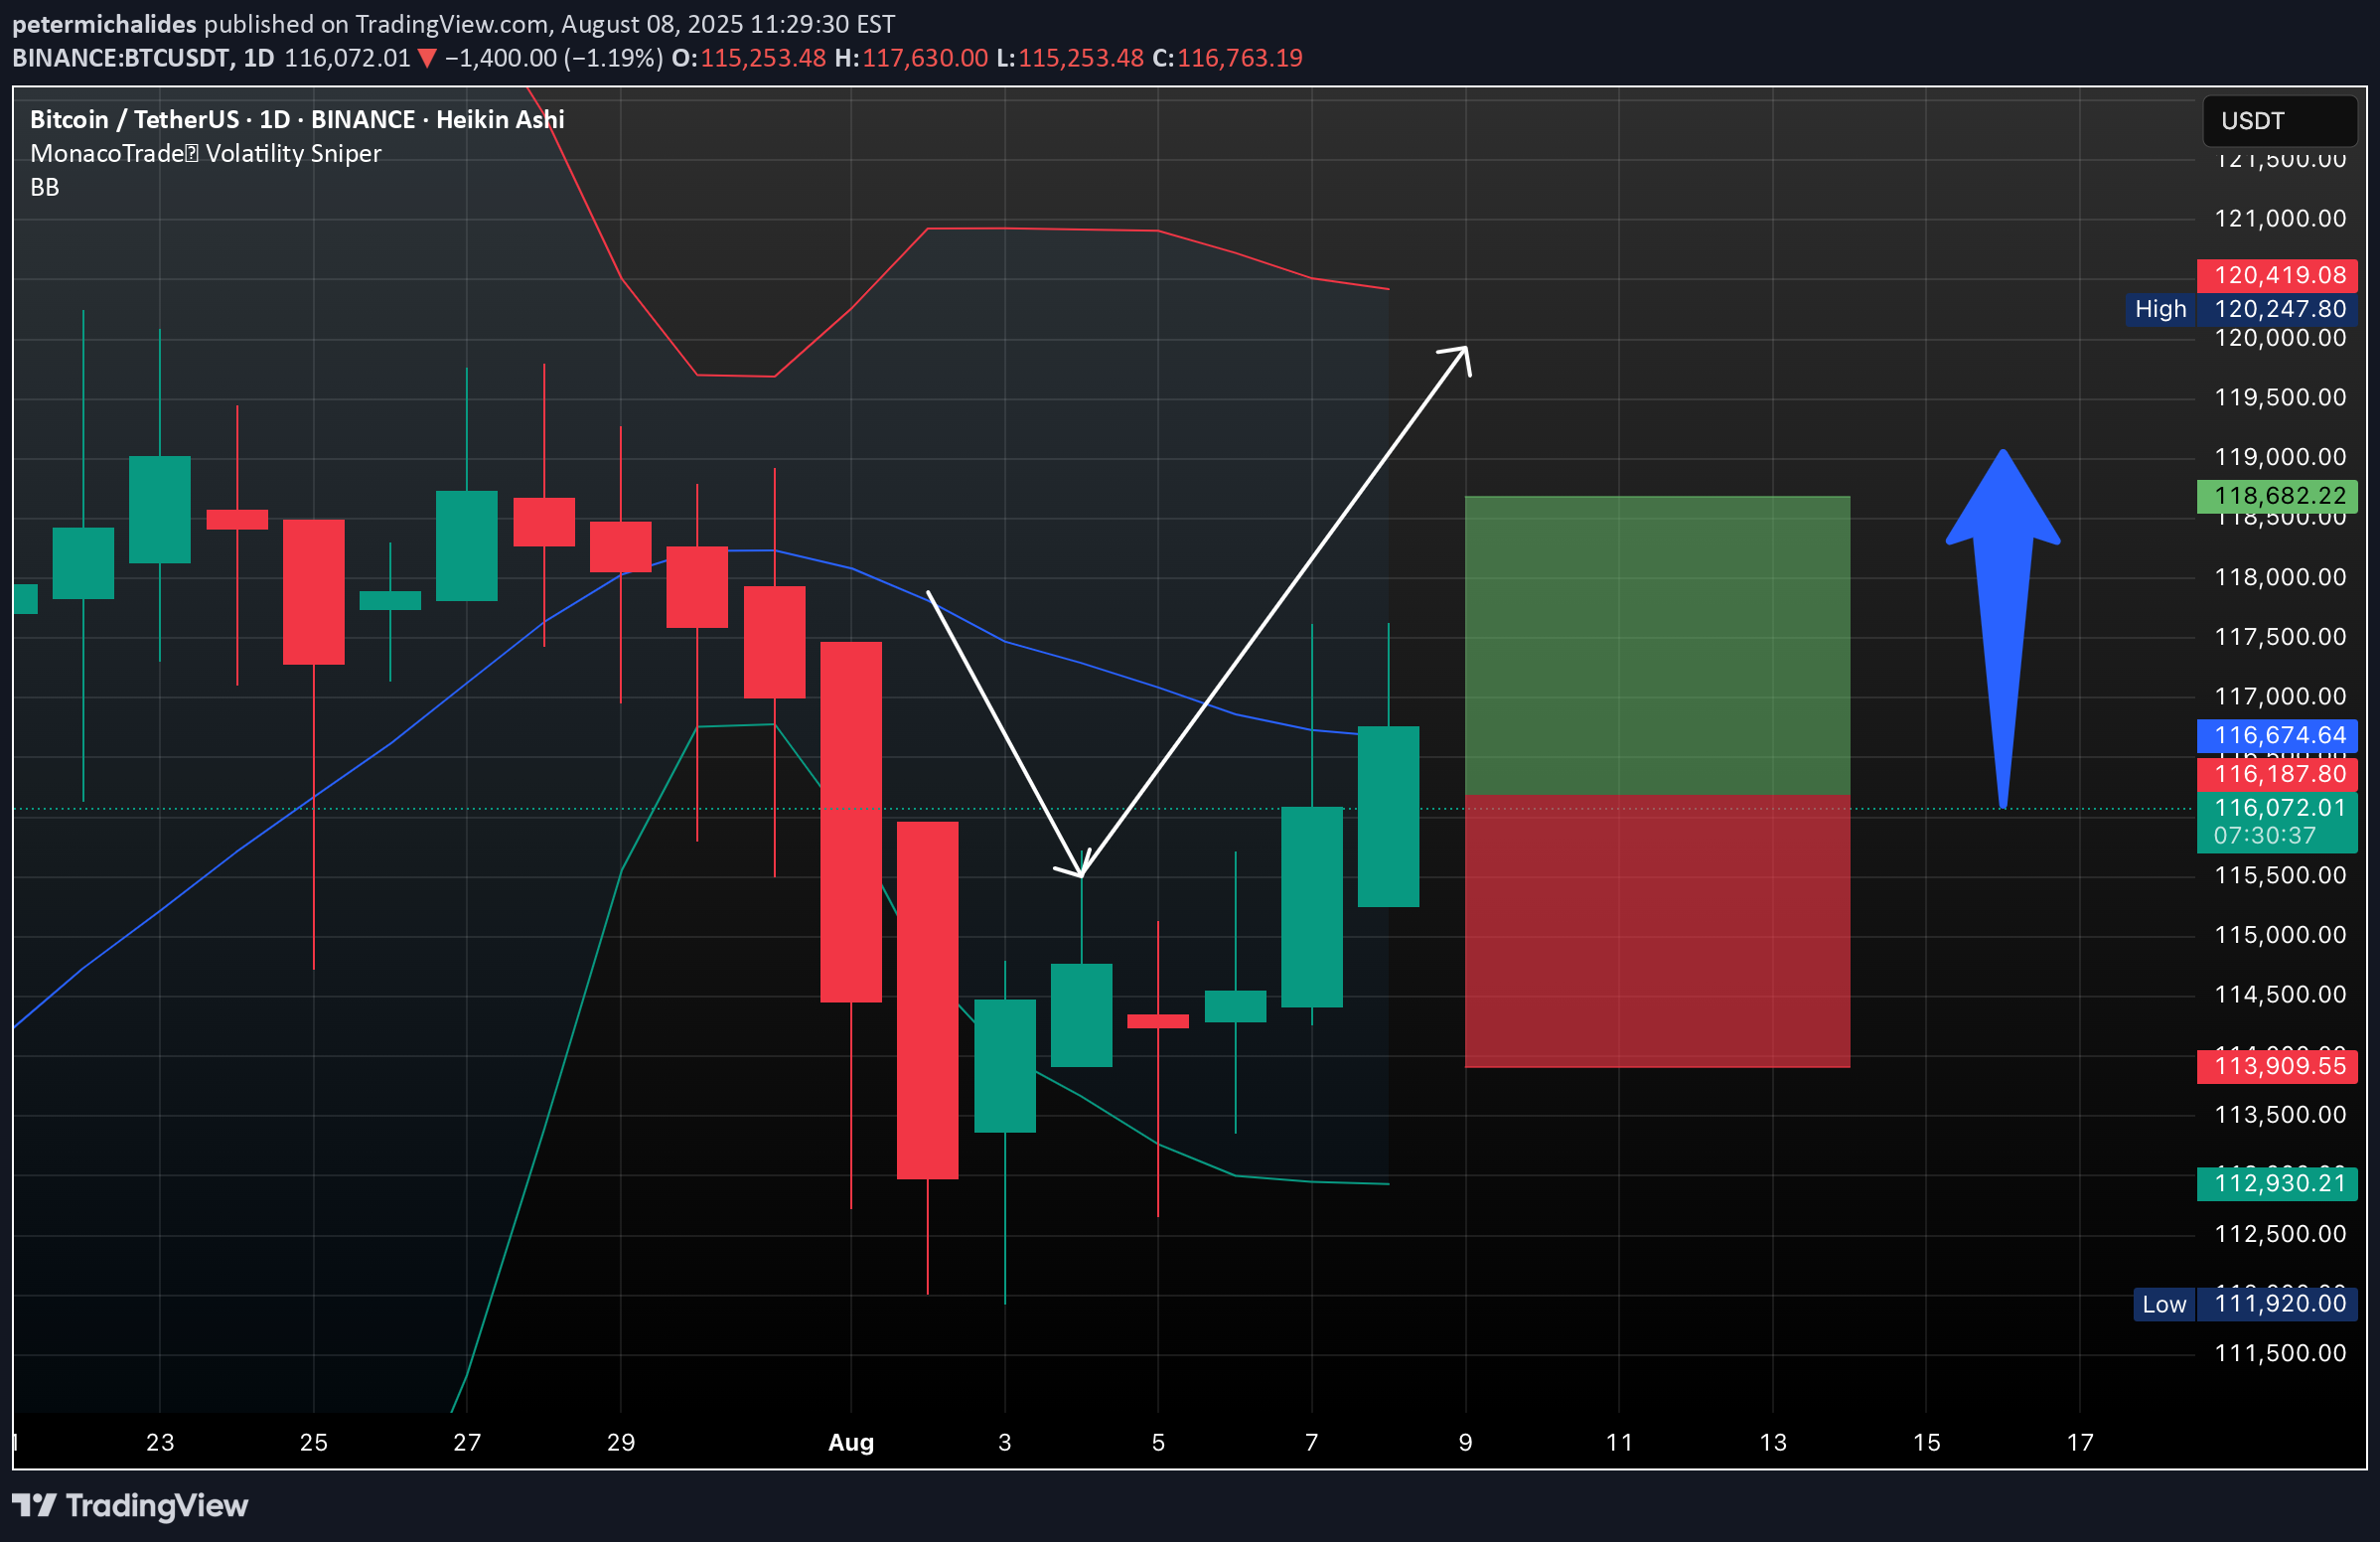
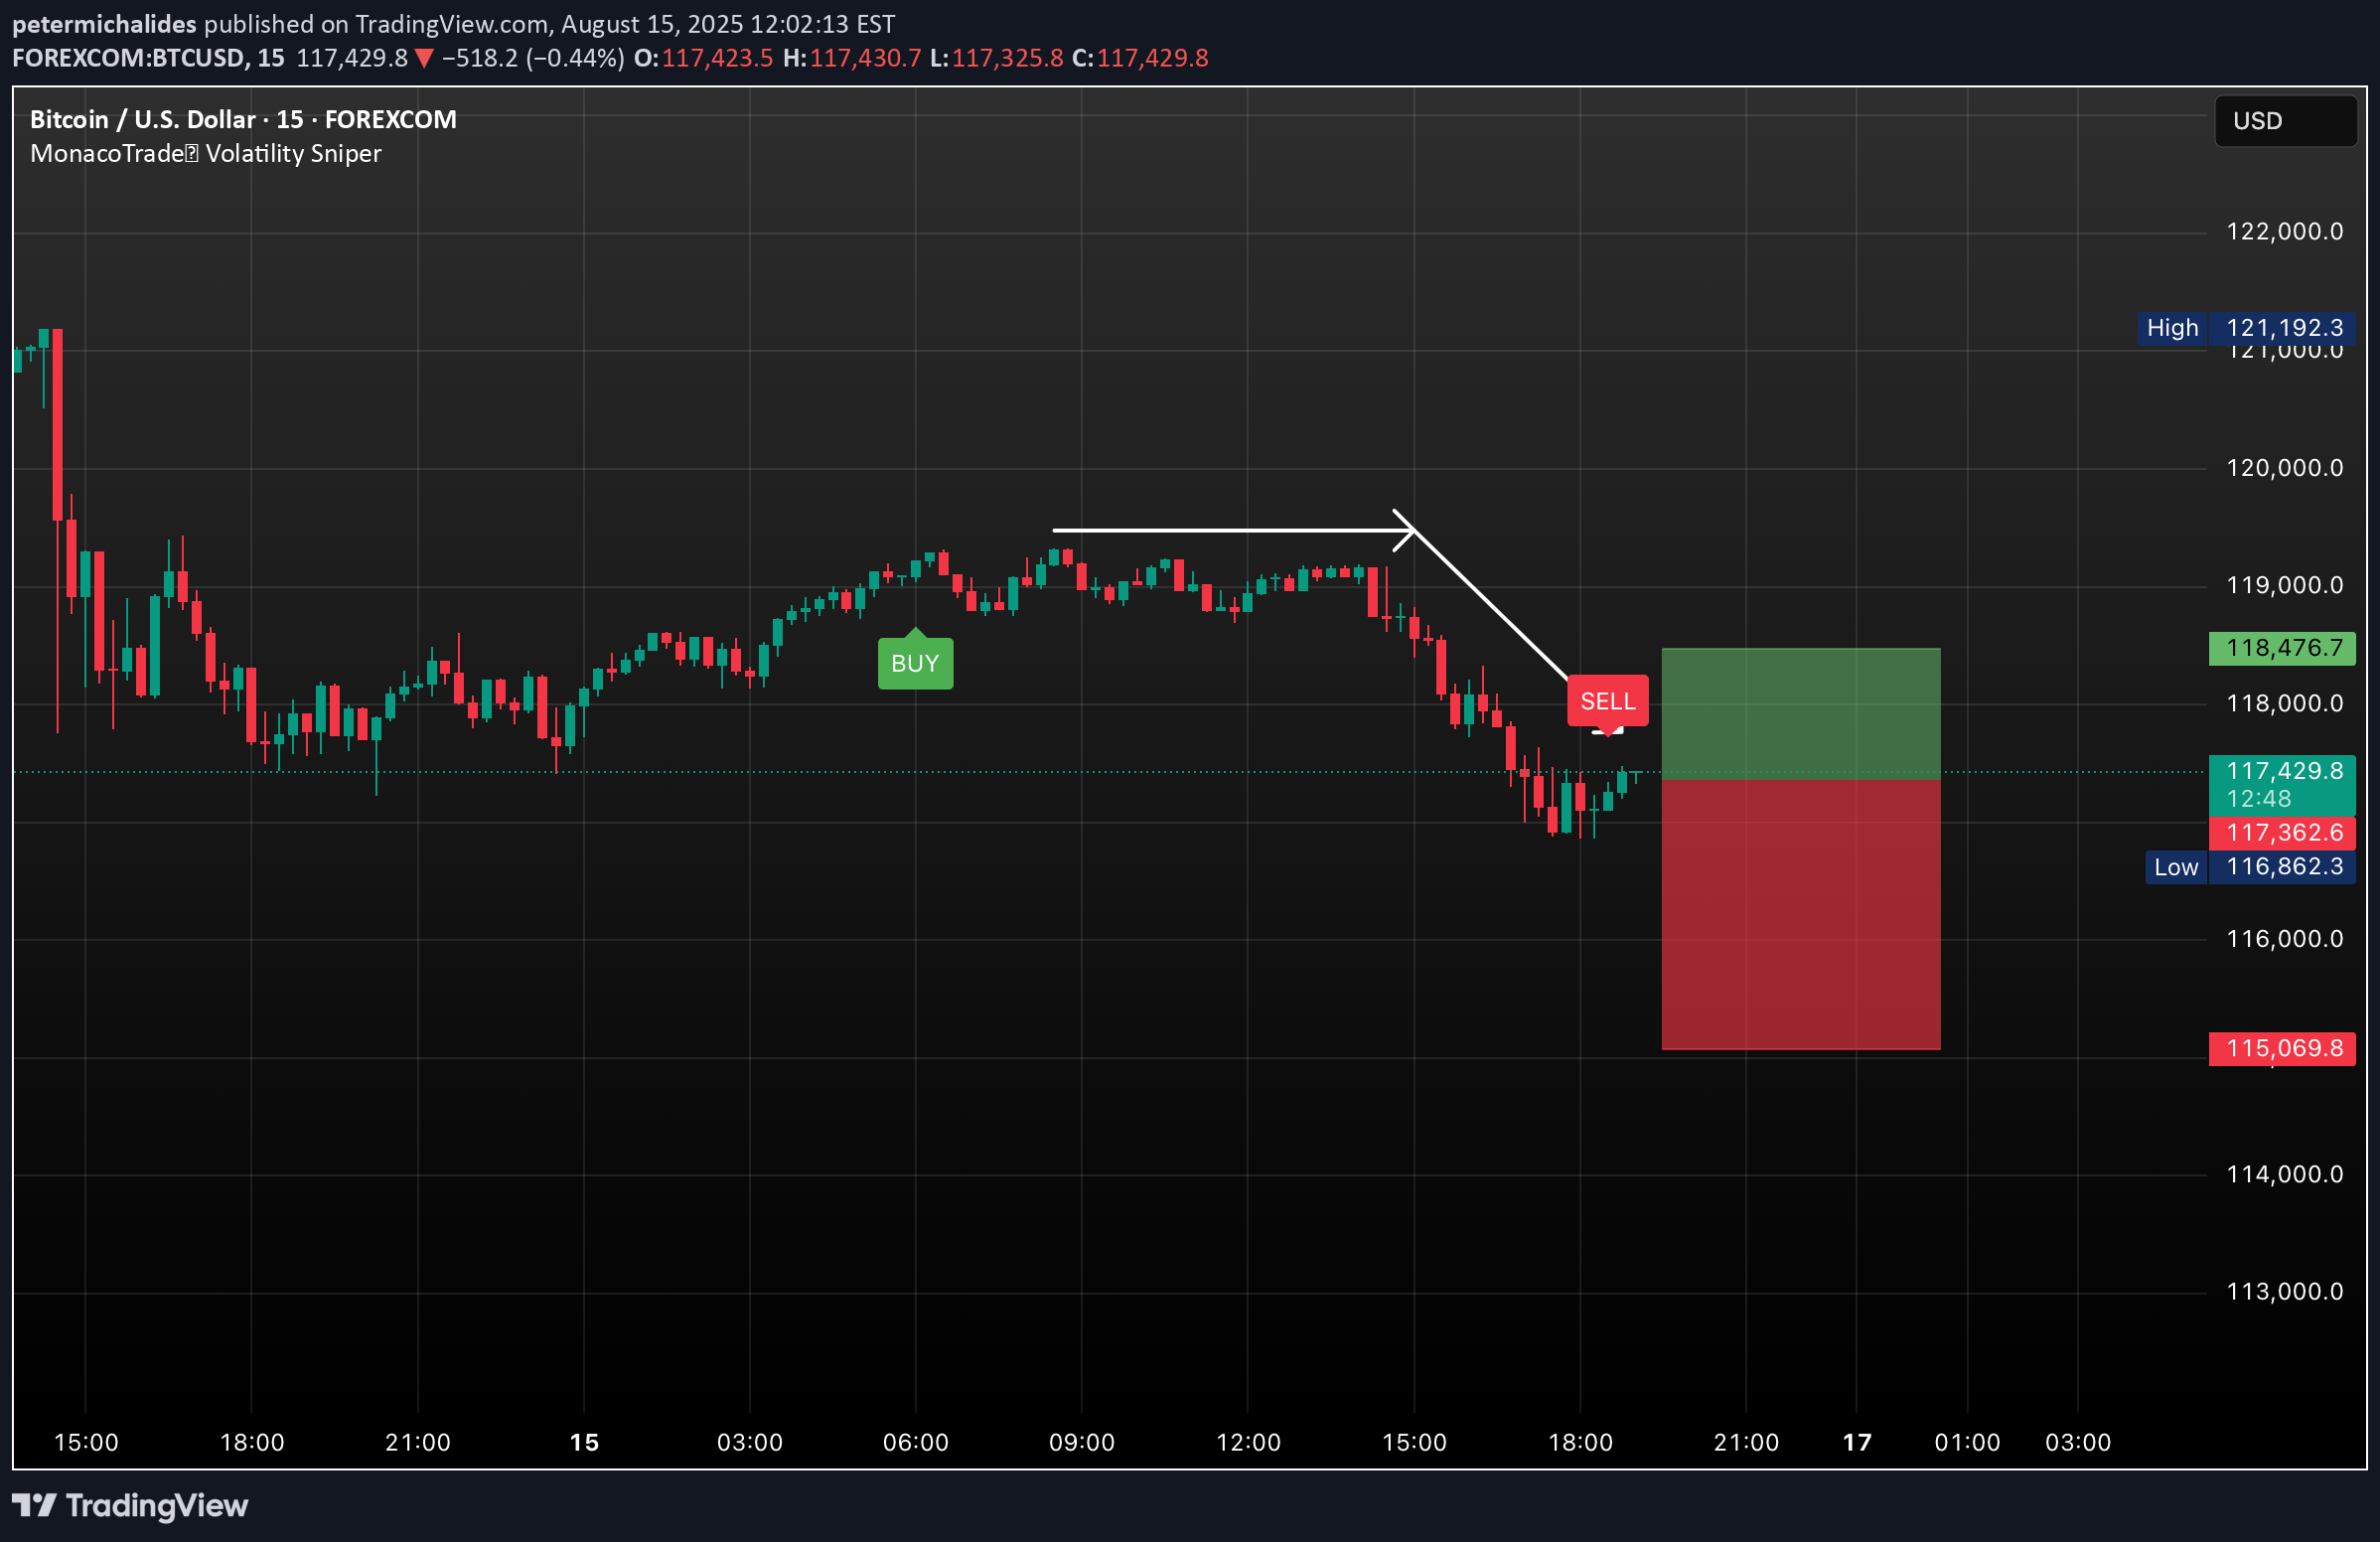
Bitcoin remains in a macro bullish structure, but recent price action shows consolidation after breaking through major resistance levels earlier this month. Similar to previous cycles, BTC tends to form short-term ranges after strong rallies before deciding the next move. Currently, BTC is trading near $116,500–$117,000, just above a key support zone from $115,200 to $114,500. This area aligns with previous breakout levels and the 20 EMA on the 4H chart, making it critical for the short-term trend. *Bullish Scenario: Holding above $115,200 and breaking $118,600 with strong buying volume could push BTC toward $120,500–$122,000 within days. *Bearish Scenario: A close below $114,500 could trigger a correction toward $112,800–$111,900. Losing this level may extend the retracement to $110,200 (major demand zone). Summary: BTC is consolidating near key support. Past scenarios suggest a breakout above $118,600 could fuel the next bullish leg, but losing $114,500 risks a deeper pullback toward $112,800. The next 2–4 days should define short-term direction.
Disclaimer
Any content and materials included in Sahmeto's website and official communication channels are a compilation of personal opinions and analyses and are not binding. They do not constitute any recommendation for buying, selling, entering or exiting the stock market and cryptocurrency market. Also, all news and analyses included in the website and channels are merely republished information from official and unofficial domestic and foreign sources, and it is obvious that users of the said content are responsible for following up and ensuring the authenticity and accuracy of the materials. Therefore, while disclaiming responsibility, it is declared that the responsibility for any decision-making, action, and potential profit and loss in the capital market and cryptocurrency market lies with the trader.