
paper_Trader1775
@t_paper_Trader1775

What symbols does the trader recommend buying?
Purchase History
پیام های تریدر
Filter
paper_Trader1775
بیت کوین در آستانه سقوط یا جهش؟ سطوح حمایتی حیاتی کجاست؟
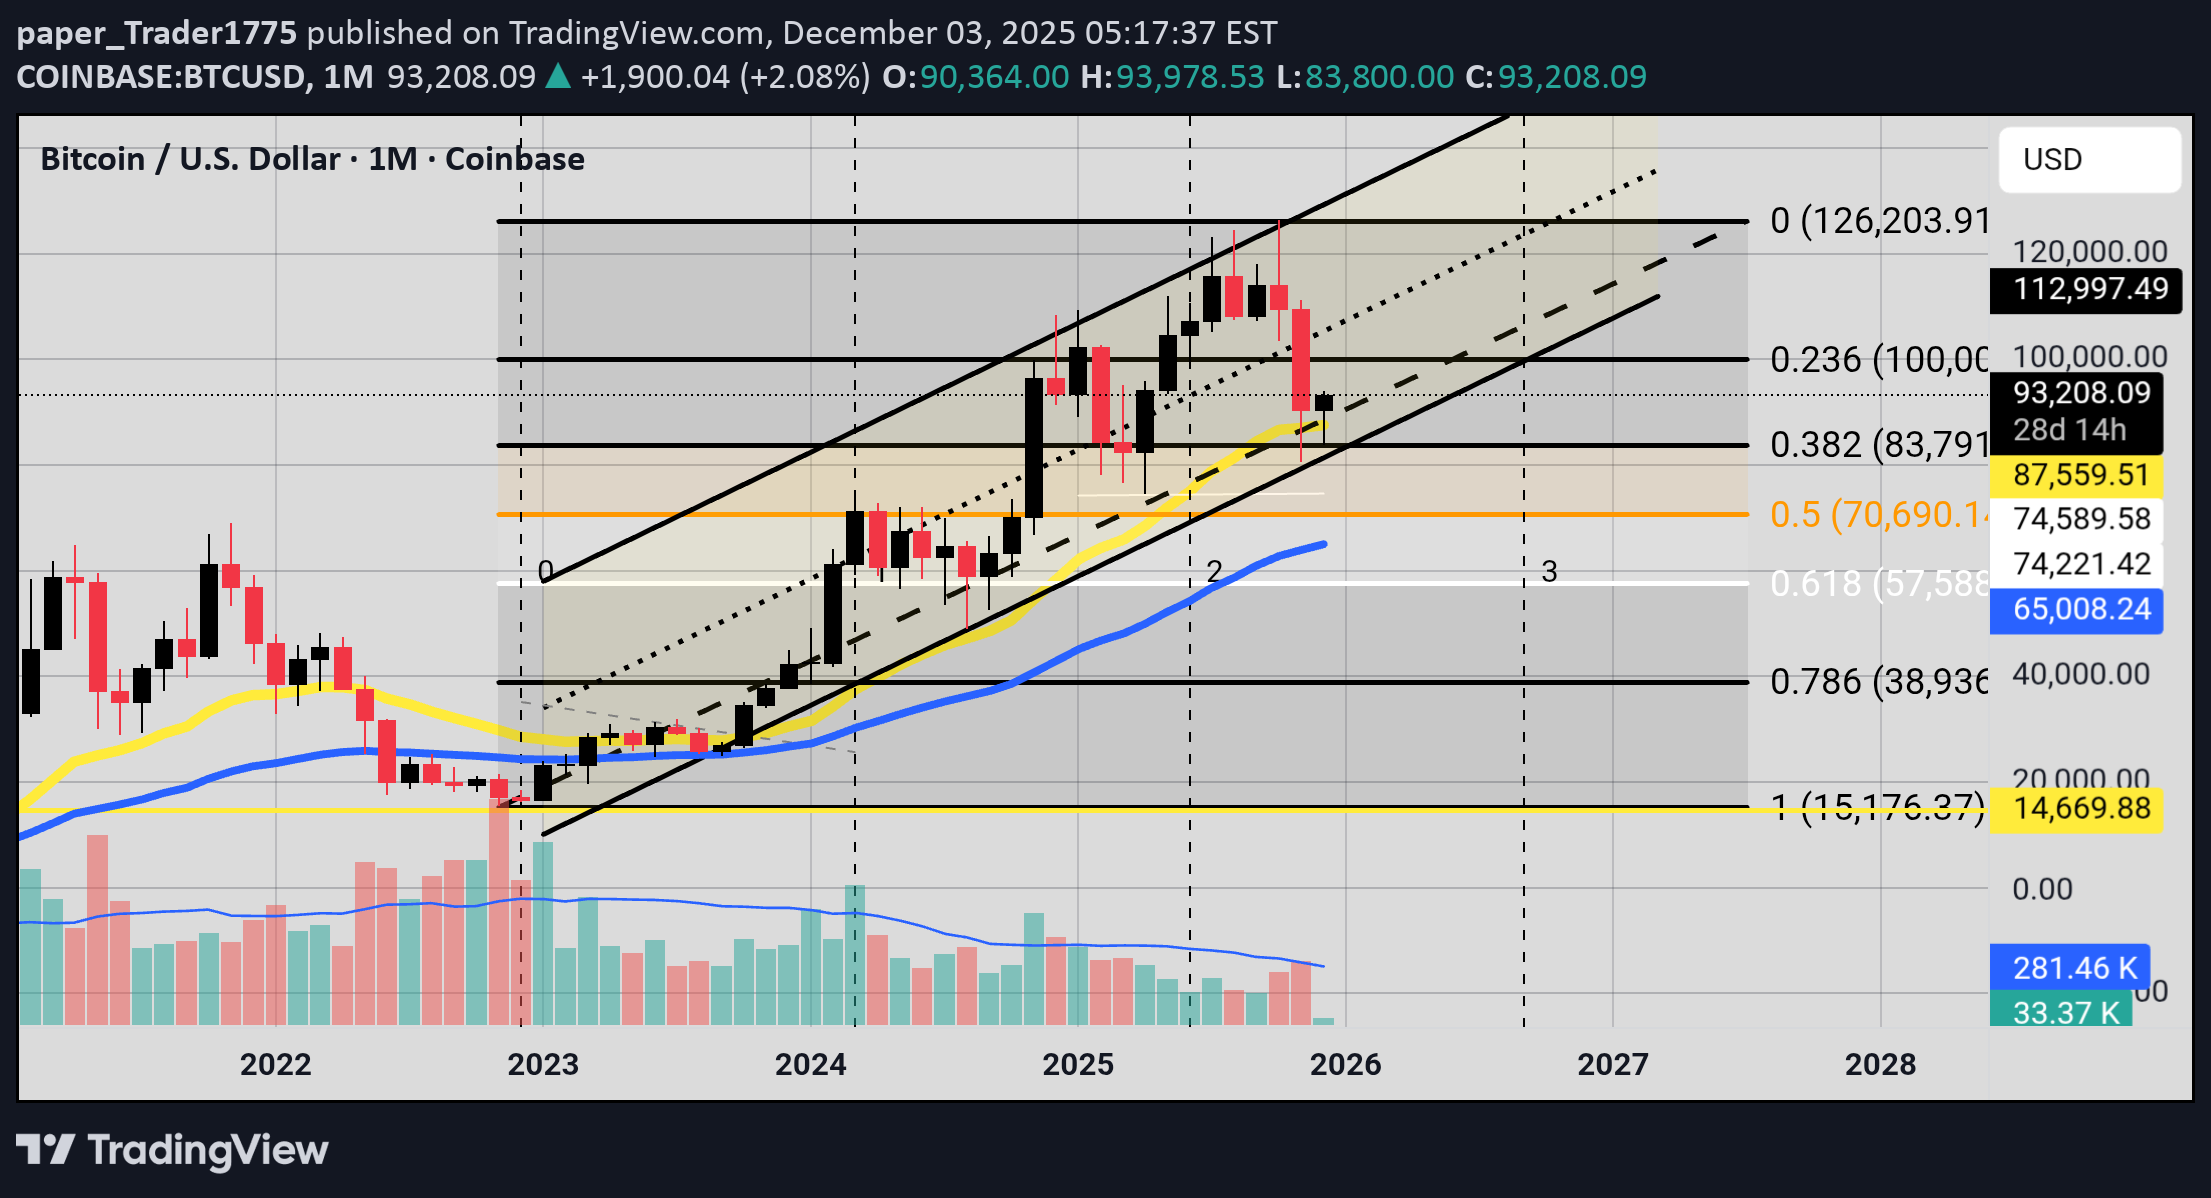
On the Monthly Chart BTC is hugging support on an upward parallel channel and the 21 EMA and the 0.382 Fibonacci level. If support fails price may see 70K or 60K prices. The positive however, price is still in the channel and above the 21 EMA. Be alert.
paper_Trader1775
اتریوم در نقطه انفجار: کلید صعود ماهانه بالای ۳۲۰۰ کجاست؟
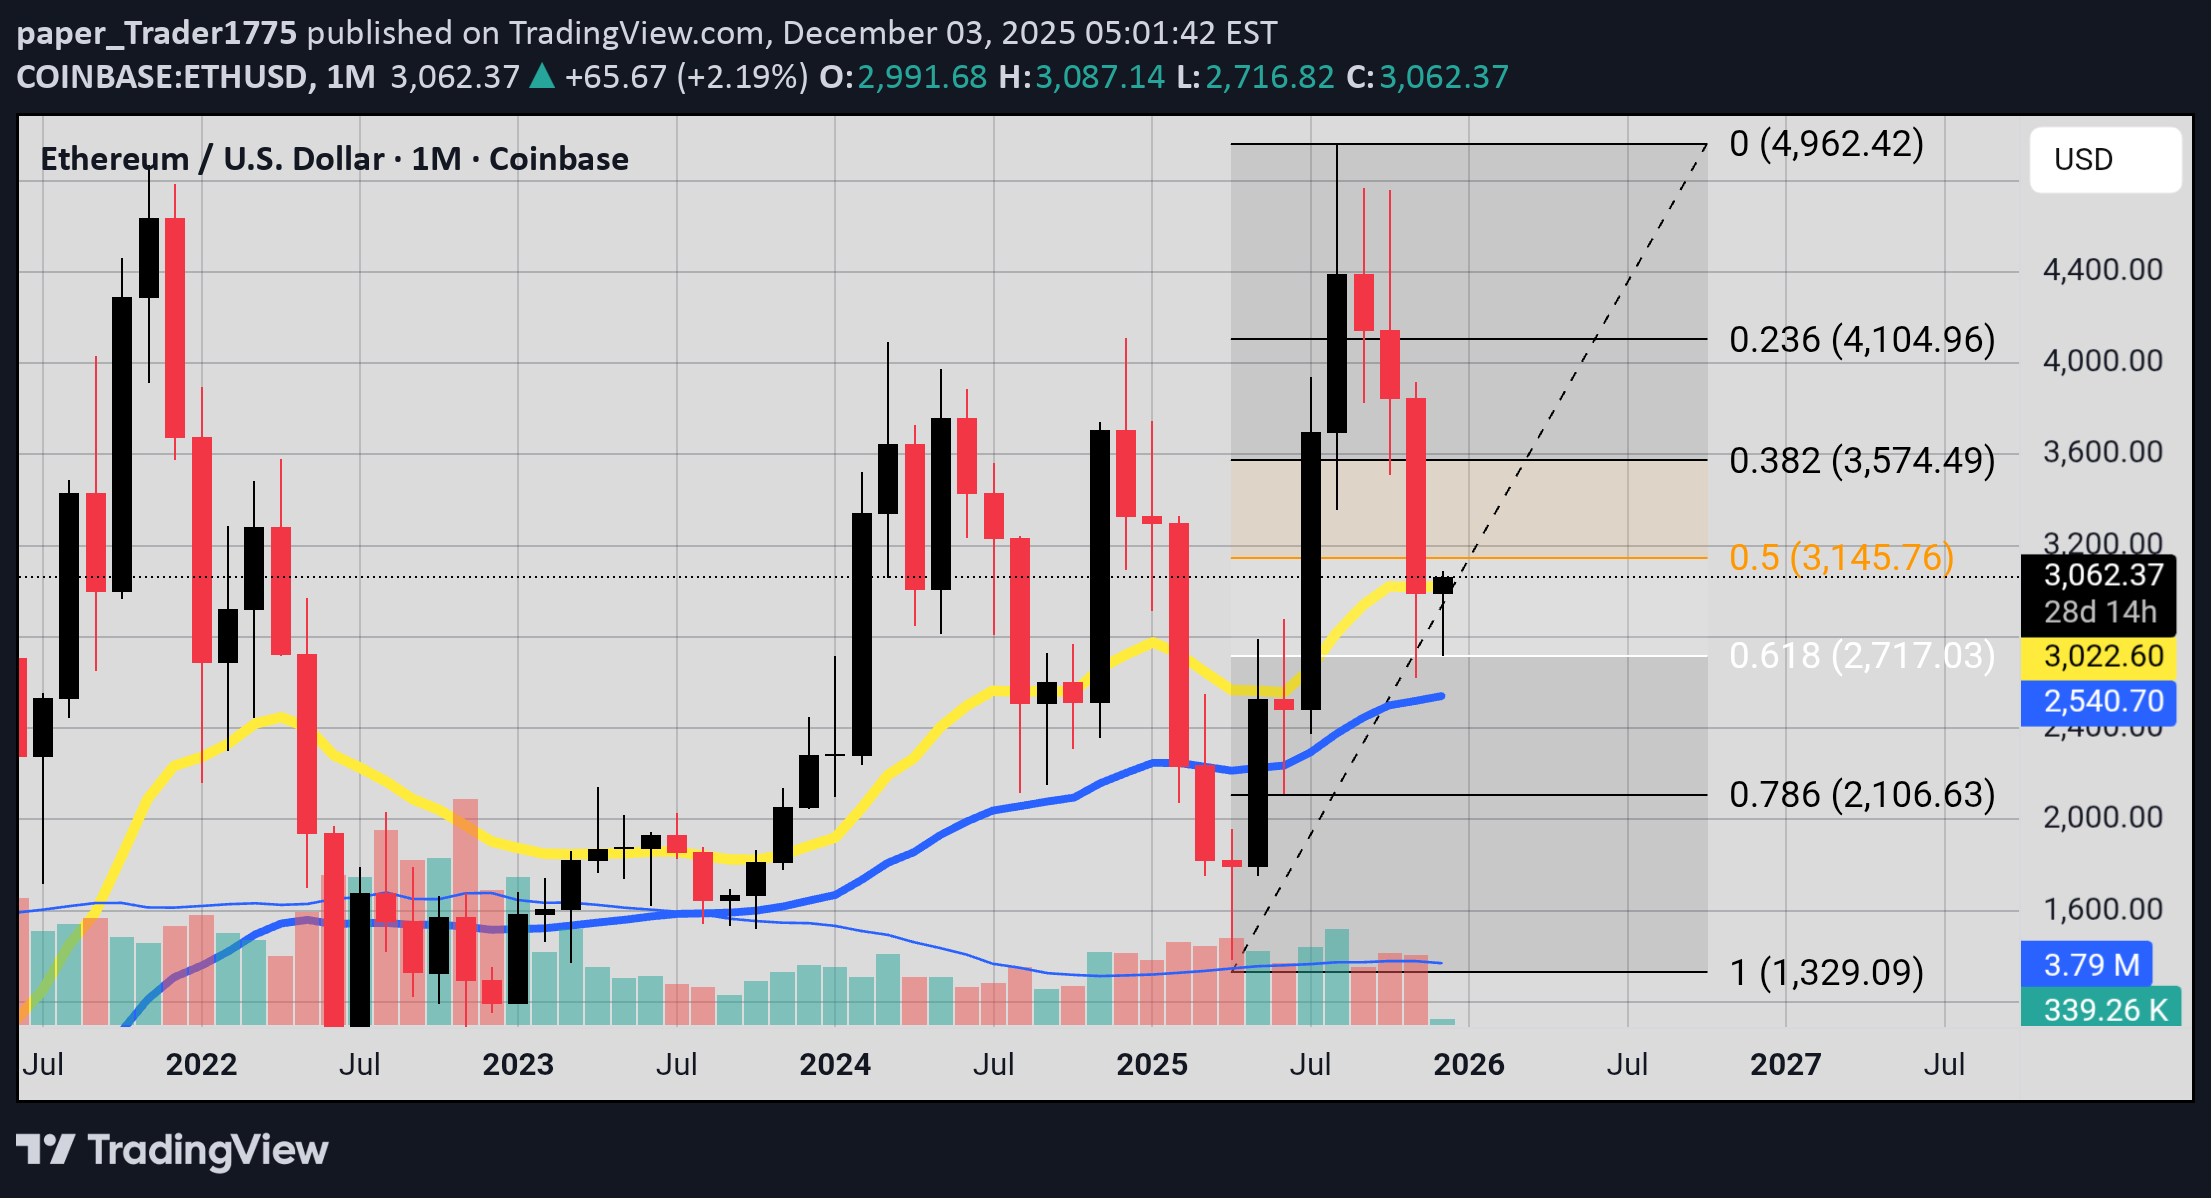
We have ETH currently resting between two powerful EMAs the 21 EMA in yellow and the 50 EMA in blue, also we have price action forming around the Fibonacci golden zone. We would like to see some bullish price action next month or in the few weeks above 3200 that would increase the probability that the pull back is over. The Chris Moody MACD is still above the zero line and did not make a bearish cross over at this time and the RSI is clinging to the 50 levels also.
paper_Trader1775
بیت کوین در دوراهی: نوسانات کوتاهمدت و آینده بلندمدت در گروی این مقاومت!
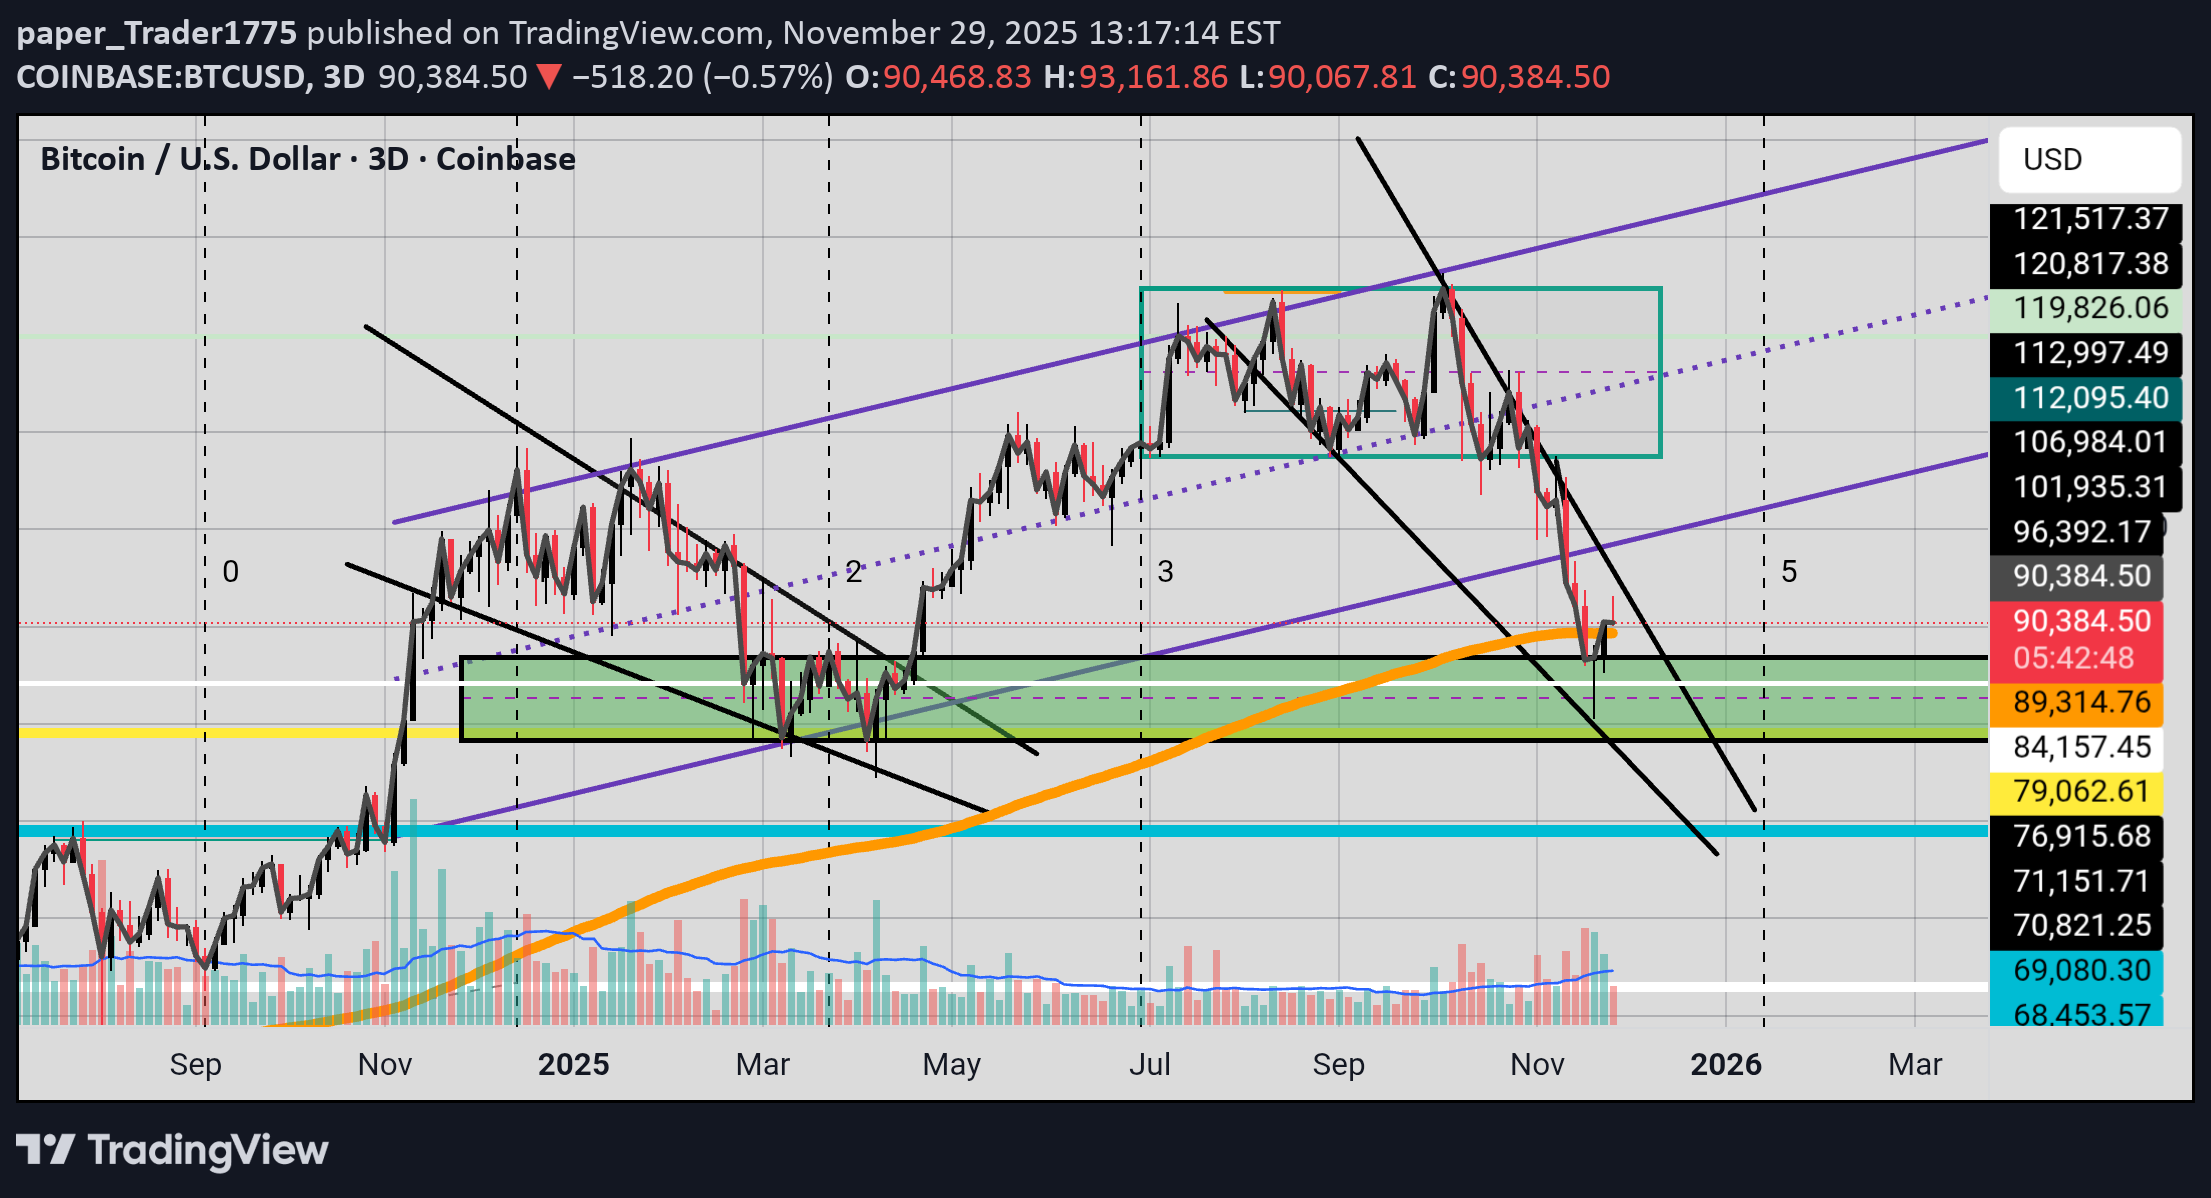
BTC seems to be clinging to life on the 3DAY 200EMA, and also appears to be consolidating inside a wedge like structure. Hopefully the break of the parallel structure was a fake out. Caution! We need positive(bullish) price action from the 200 EMA with a breakout from the wedge, to get the short term aligned with the long term bullish!
paper_Trader1775
امید به بازگشت قیمت: چه زمانی منتظر صعود بزرگ باشیم؟
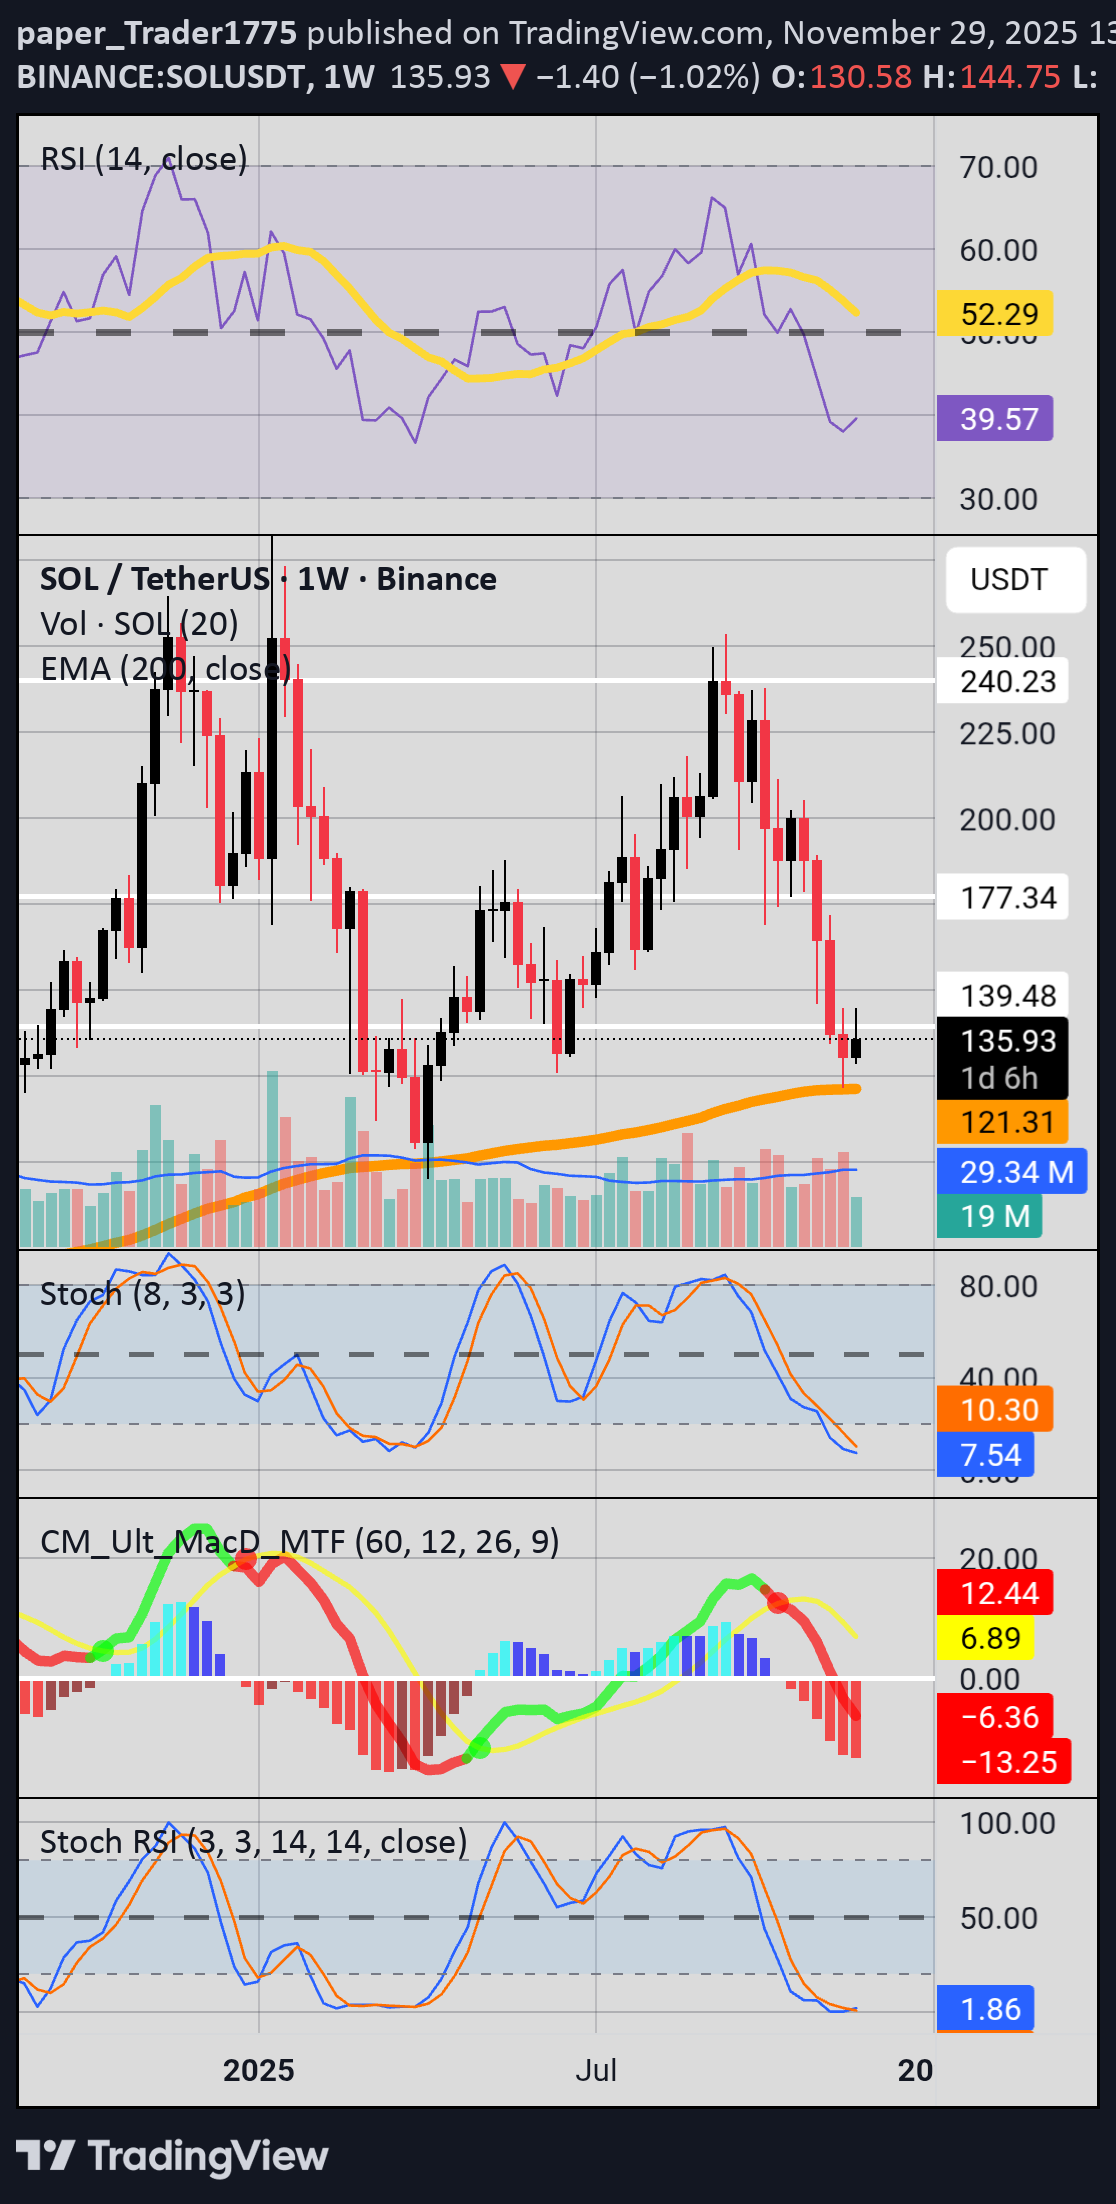
If we can get some bullish action above price 140, that combined with the oscillators moving up from the undersold area we could see a nice mean reversion from the 200 EMA(orange curve)
paper_Trader1775
نقطه عطف هفتگی بیت کوین: آیا 94 هزار دلار سقوط میکند؟ (آماده باشید)
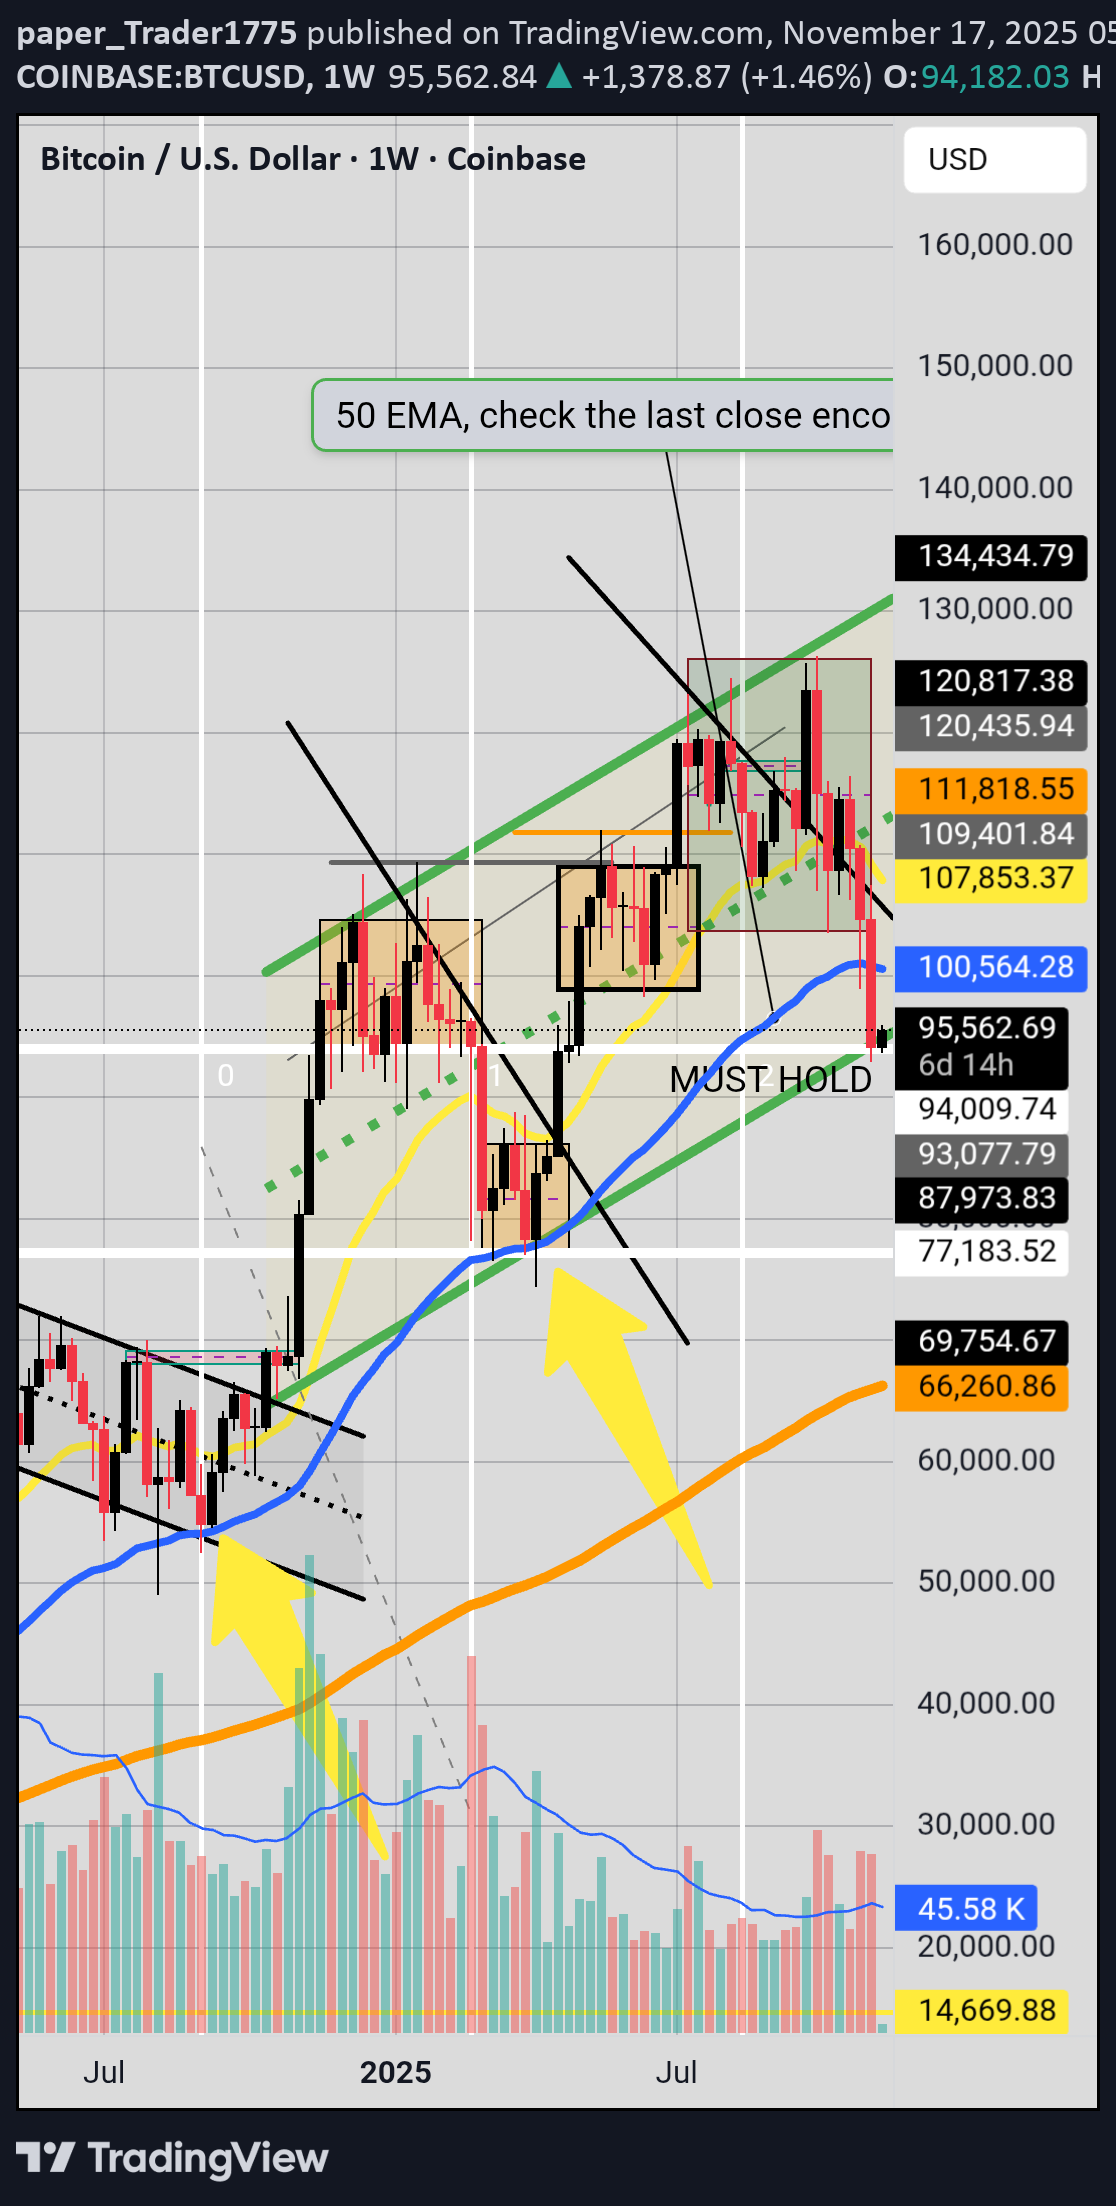
Warriors good day to you all. BTC needs to hold the 94K level if not it may decline to the 75K levels, if we do not get a fakeout. Intriguing how we revisited the 50EMA which is confluent to the 94K level support. Concerns- we had a breach below the 50 EMA with a full body bearish candle and alot of volume. Oscillators are still in bearish deep oversold territory. Hopeful- MACD (Chris Moody) still above zero line, BTC breached the 50 EMA but not too significantly. Resting on a key level. May be forming support on a parallel structure. Be careful and keep your eyes open.
paper_Trader1775
نقطه عطف انویدیا: آیا نوسانگیرها آماده بازگشت هستند؟ (تحلیل دقیق قیمت NVDA)
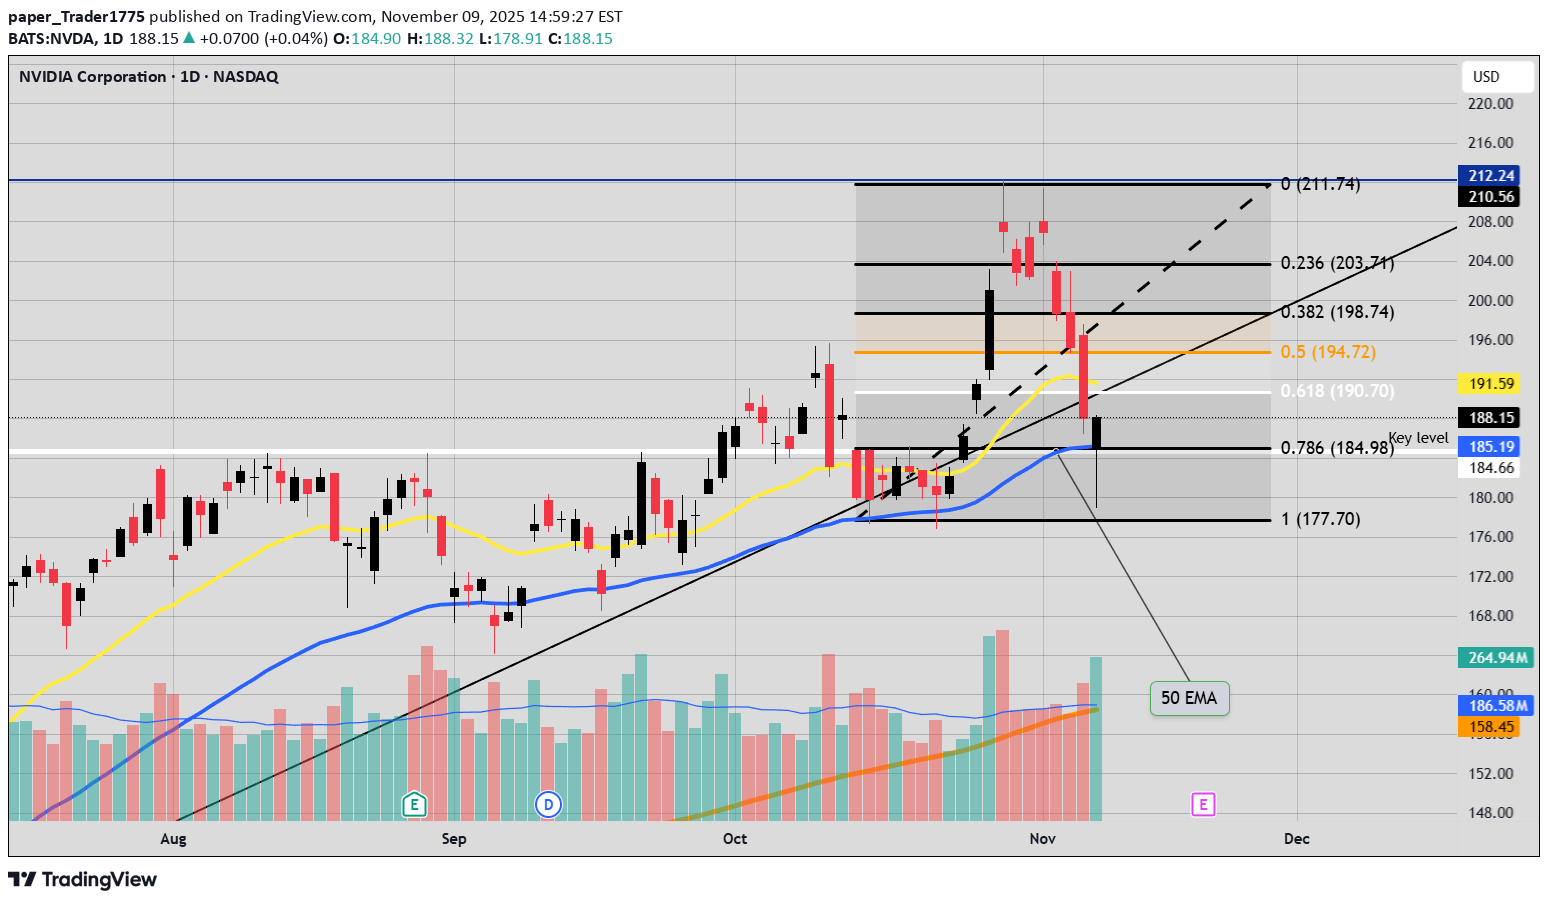
NVDA has a hammerhead candle on a key level and the 50 EMA and the 0.786 Fibonacci level. Oscillators are flashing oversold. For bullish activity we need a bullish candle with a close above 188.15 and next resistance will be around 191 or 190.70. If price breaks below the 50 EMA(185.19) next key level will be 177.10
paper_Trader1775
مناطق طلایی و میانگین متحرک سولانا: آیا قیمت به ۱۵۵ دلار سقوط میکند؟

paper_Trader1775
نقطه عطف بازار: آیا کندل چکش، سرنوشت قیمت را رقم میزند؟
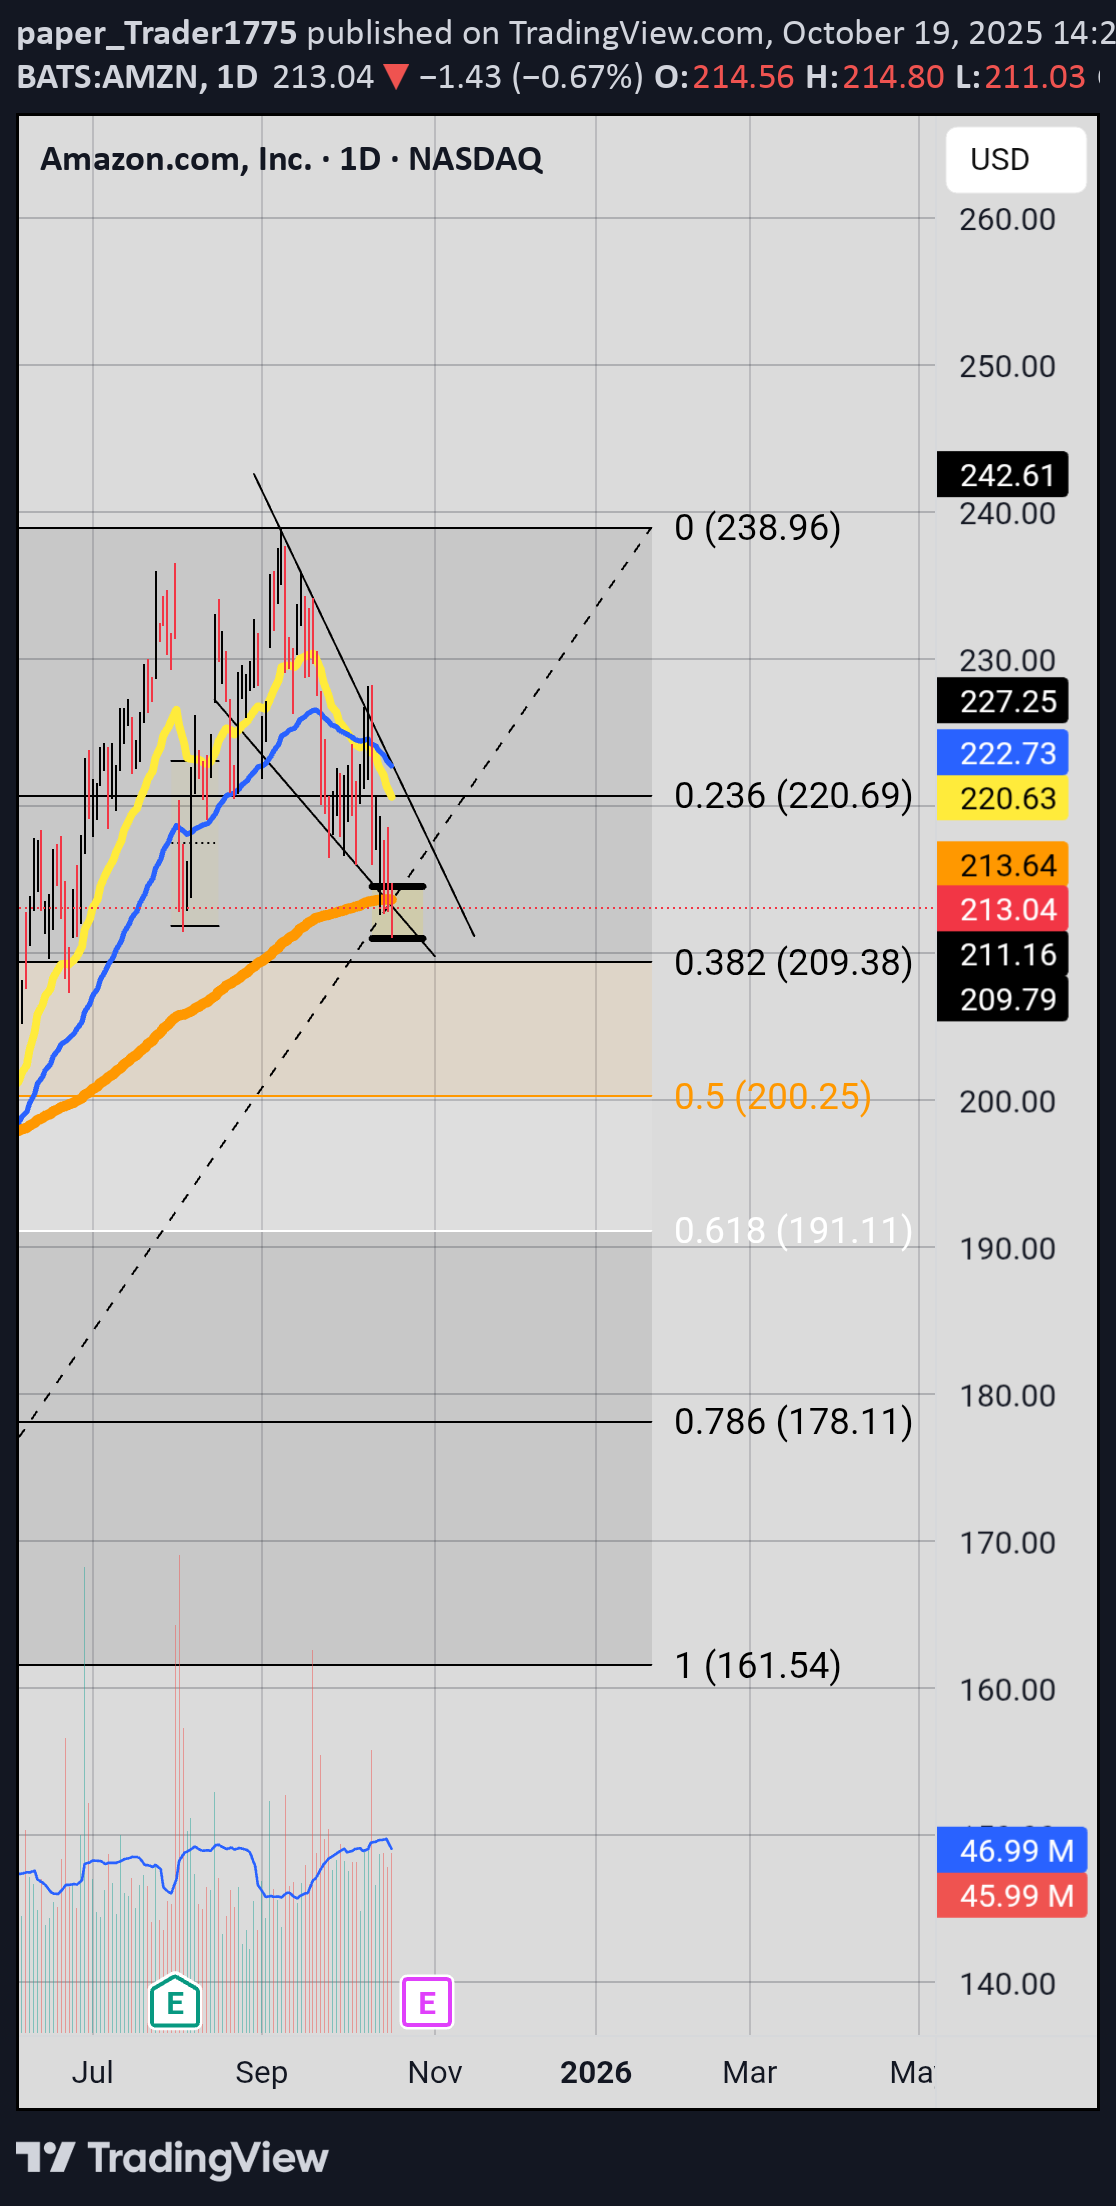
We have a hammer candle near the 200 EMA and the 0.382 Fibonacci Level. The 200 EMA 213.64$ needs to be held. If we get strong bearish activity below 209$ with a break below the fallen wedge the bears will celebrate. Bulls need in a few days bullish activity with a higher close above Friday hammer candle.
paper_Trader1775
سقوط زیر ۱۵ سنت؛ آیا خرسها پیروز میشوند و گاوها ناامید؟

If price falls out of the parallel structure and below 15 cents the bears shall rejoice and the bulls will not be please.
paper_Trader1775
نبرد گاوها و خرسها: آیا طلا از سقوط نجات مییابد؟
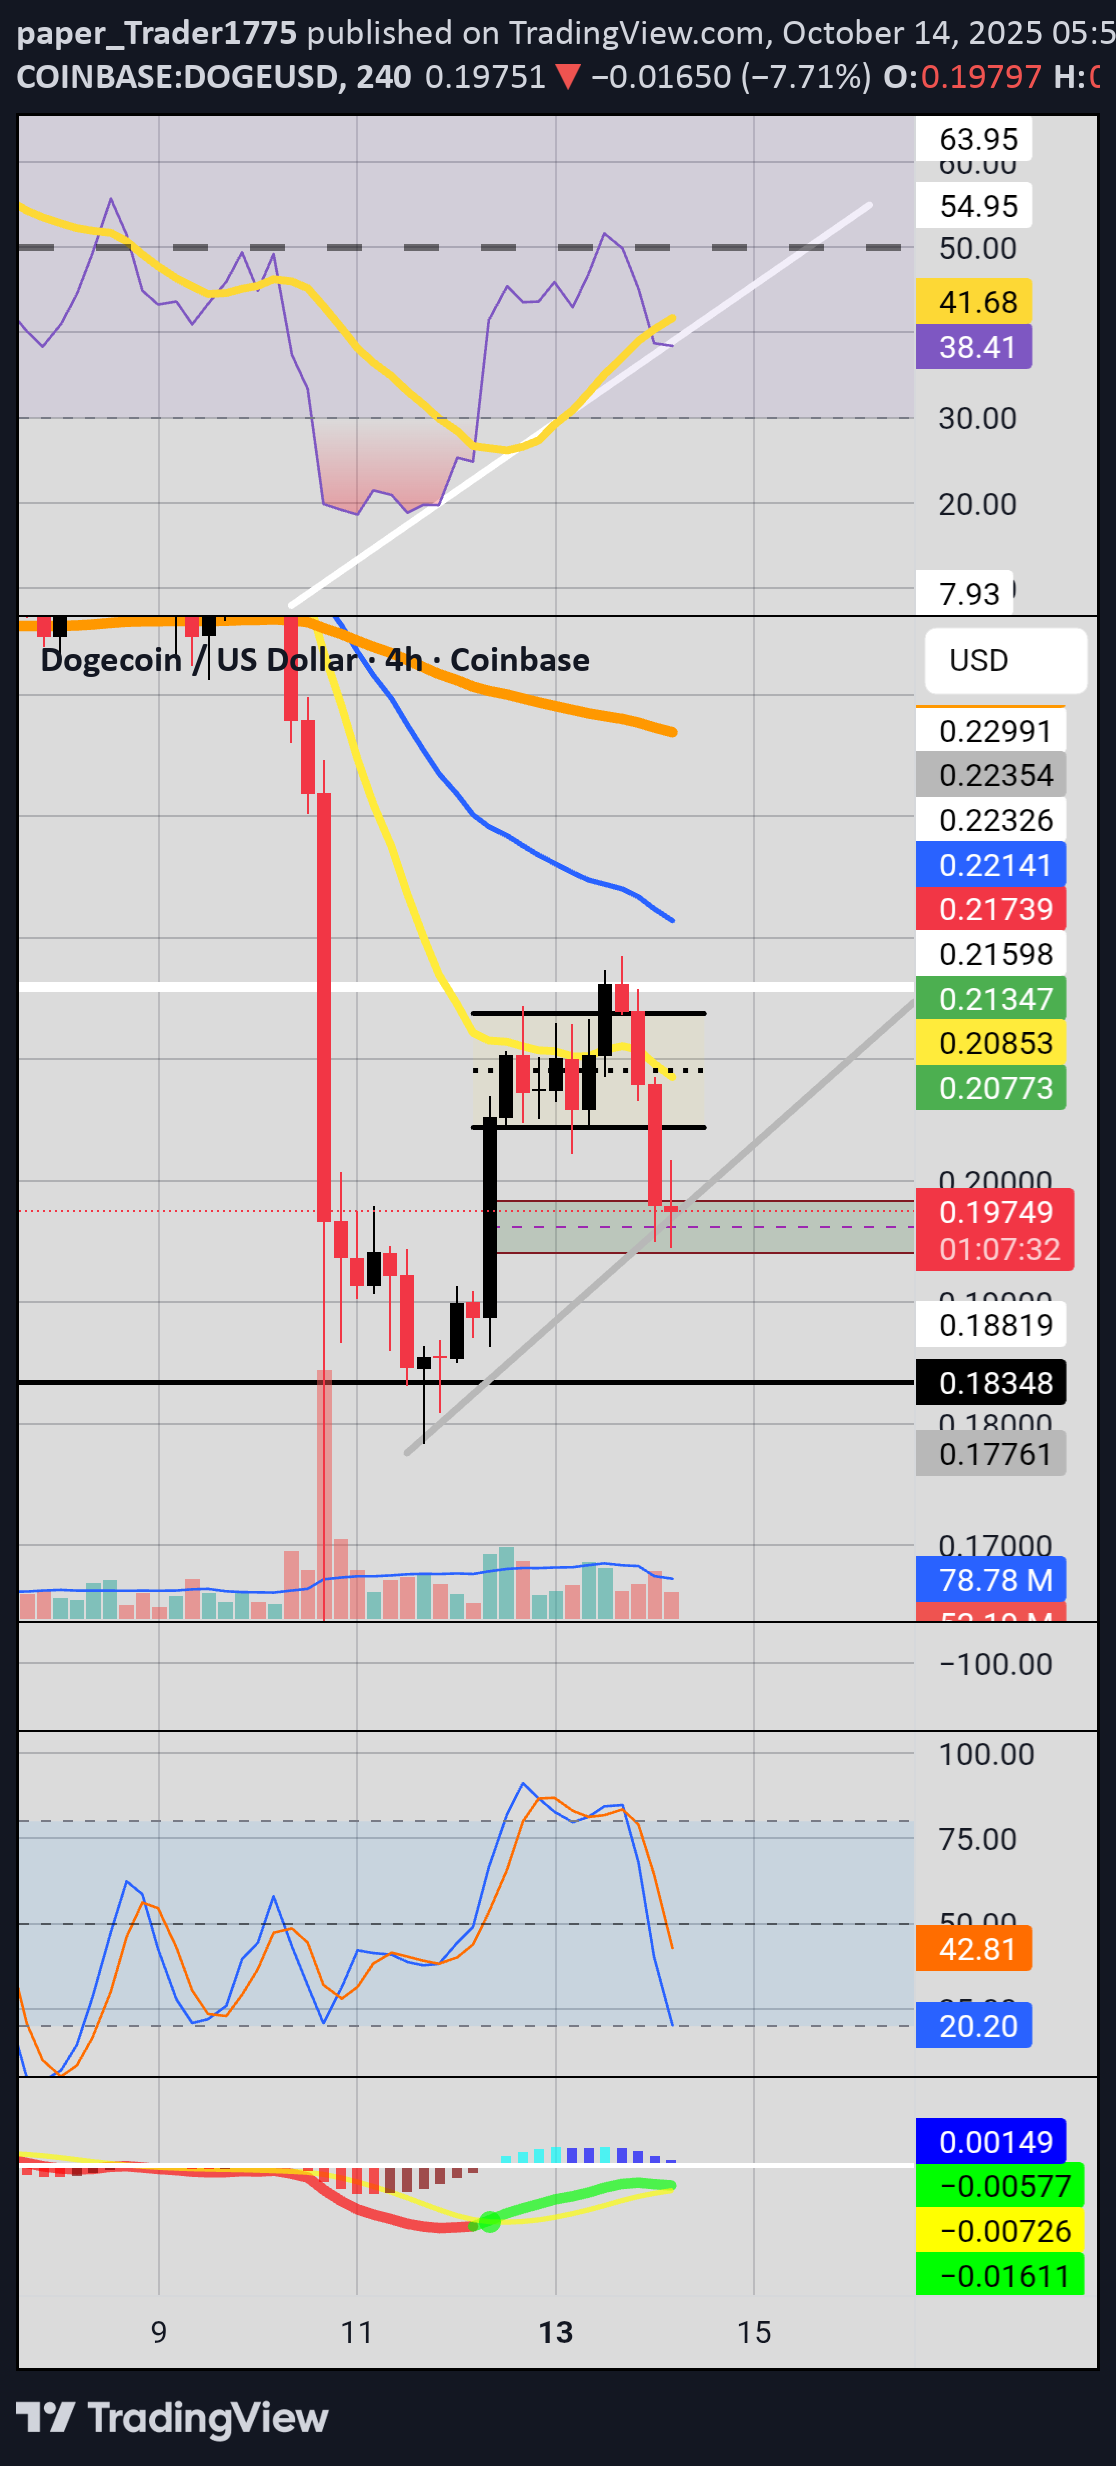
Investors need to hold and over come the 19 cents price range and stop the bears from breaching the trendline. The bears previously had a victory with a bearish breakout the bulls need to stop their march.
Disclaimer
Any content and materials included in Sahmeto's website and official communication channels are a compilation of personal opinions and analyses and are not binding. They do not constitute any recommendation for buying, selling, entering or exiting the stock market and cryptocurrency market. Also, all news and analyses included in the website and channels are merely republished information from official and unofficial domestic and foreign sources, and it is obvious that users of the said content are responsible for following up and ensuring the authenticity and accuracy of the materials. Therefore, while disclaiming responsibility, it is declared that the responsibility for any decision-making, action, and potential profit and loss in the capital market and cryptocurrency market lies with the trader.