
paltena
@t_paltena

What symbols does the trader recommend buying?
Purchase History
پیام های تریدر
Filter
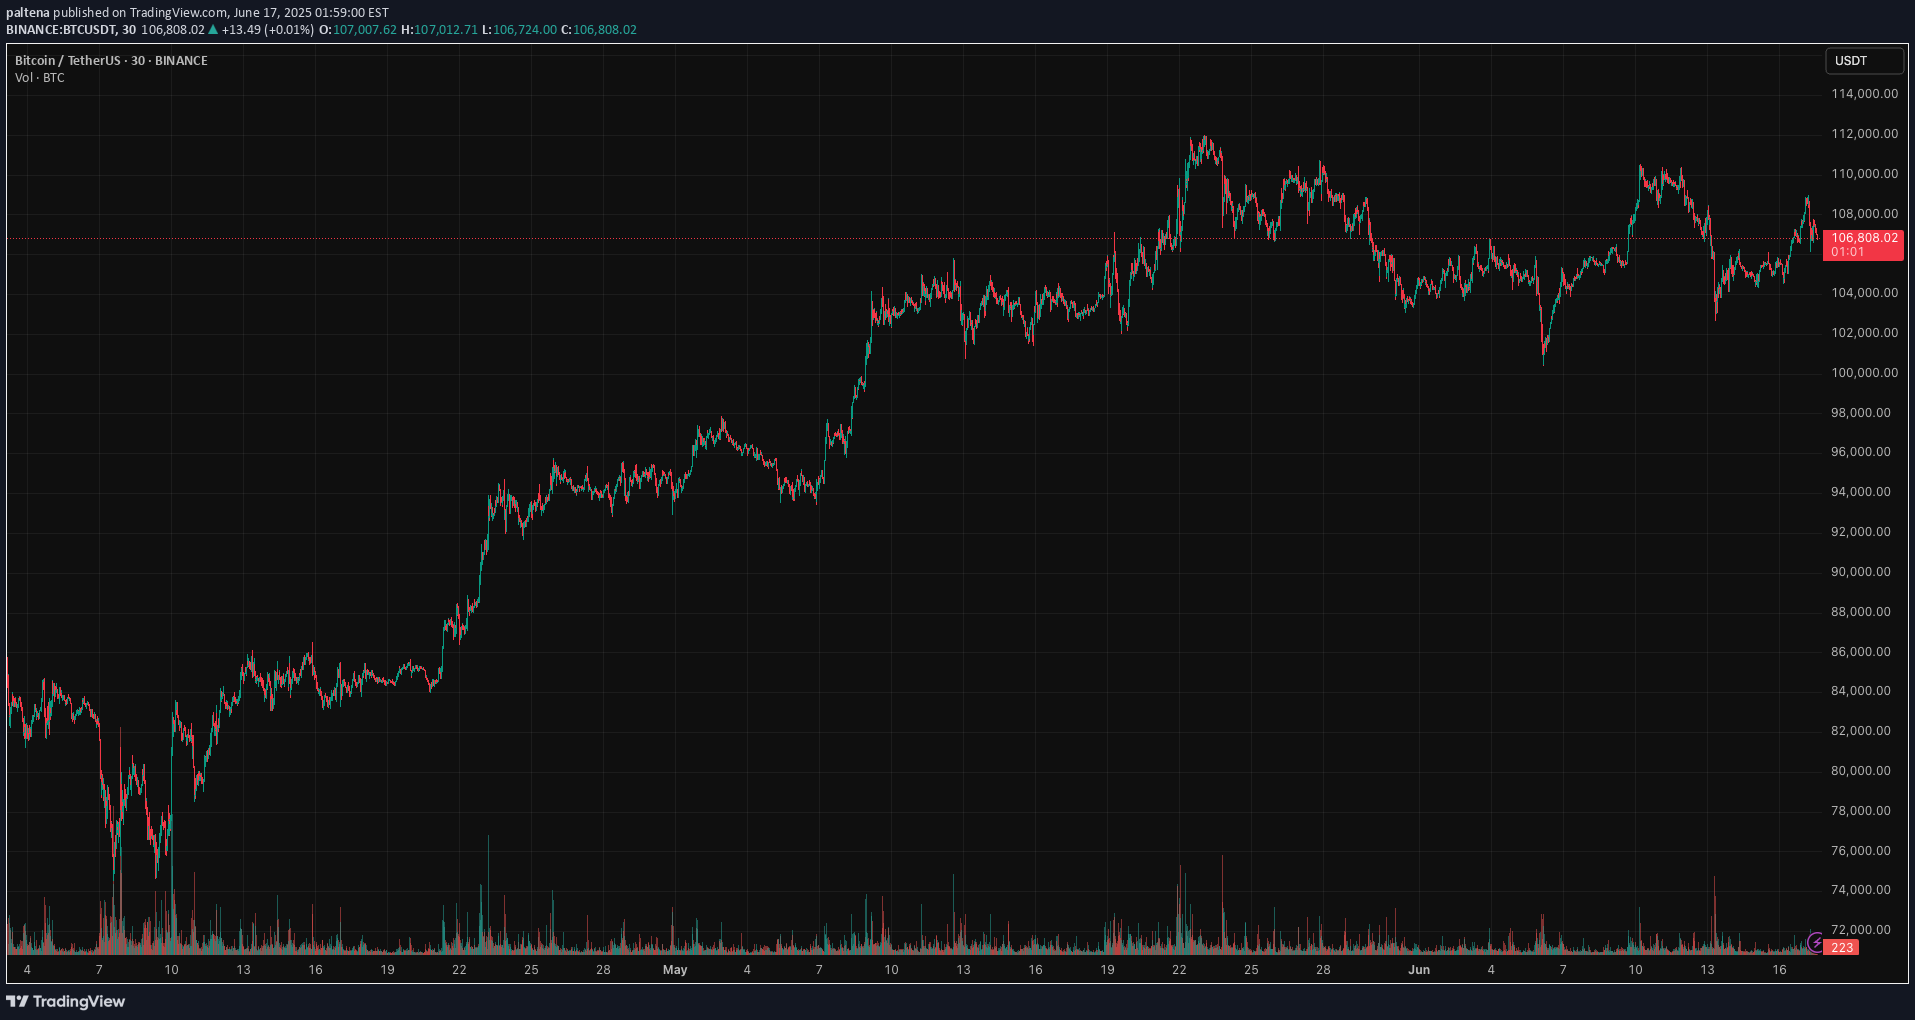
Bitcoin - Trend Shift Confirmed, Eyes on $102.8K Liquidity

Market ContextBitcoin showed signs of exhaustion after a strong short-term rally within a clean upward channel on the 1H chart. Price action had been respecting the trend structure until a key deviation occurred near $108,500, where we saw an internal liquidity sweep that hinted at potential distribution.Fake-Out Confirmation and Shift in MomentumAfter taking out local highs around $108.5K, price failed to continue higher and instead reversed sharply, confirming the sweep as a classic fake-out. This kind of internal liquidity grab is typically used to trap breakout buyers before reversing and targeting previous lows.Break of Structure and Channel RetestThe rising channel was broken convincingly, and price has now retested the underside of the channel, aligning with the 50% equilibrium of the entire high-to-low range. This reinforces the bearish bias and suggests the market has likely shifted from accumulation to distribution.Downside Targets and Key LevelsImmediate support sits around $104.6K, which served as a consolidation base during the earlier run-up. If this level fails to hold, the next key target would be a sweep of the previous significant low at $102.8K. This area is marked as a point of interest and could offer a reaction or reversal.Price Expectations and Trade OutlookAs long as price remains below the broken channel and under $107K, the bearish scenario remains in play. I’m watching for bearish continuation into $104.6K first, and a potential full sweep toward $102.8K if that support fails.ConclusionThe internal sweep followed by impulsive rejection, combined with a clear channel breakdown and retest, shifts the bias to bearish. A move into the $104.6K region seems probable, with a lower liquidity target at $102.8K in sight if downside pressure accelerates.Disclosure: I am part of Trade Nation's Influencer program and receive a monthly fee for using their TradingView charts in my analysis.___________________________________Thanks for your support!If you found this idea helpful or learned something new, drop a like 👍 and leave a comment, I’d love to hear your thoughts! 🚀
Sui Update, Retest of Support; Bullish Confirmed

It's been 9 days since my last Sui update. The chart looks good.For context, see the previous analysis:We started at the C wave of an ABC correction. There was an attempt to push prices higher but resistance was found at MA200. The resistance produced retrace and the same support zone is tested and holds. If a new advance develops here, which is exactly what is going to happen, then you can expect much higher prices next. This time around, MA200 as resistance will break, which means a new high. The highest prices in more than six months, since January 2025.This is where the next move will take us and this is easy to predict now that support has gone through a retest and holds.
Sui Turning Green ($6.65 Target = 100%+ PP)

Just like that Sui was red for 24 days. 24 days might not be that long but when you consider that the rise lasted 35 days, then yes, within this context it is a very long retrace... And look at the levels on the chart.Support found at 0.5 Fib. retracement. This level was pierced followed by a recovery the next day. Double-bullish signal; the recovery and the fact that 0.618 wasn't tested.I can honestly say that it is still early, but I can also say that this zone where the bounce just happened is a very strong classic support zone. This support zone can lead to the next leg-up, a strong rise with targets reaching $5.19 and $6.65.The chart looks good for a new bullish wave. The $6.65 target means more than 100%. Taken from the 7-April low, we are talking about a 285% total growth, profits of course. And this wouldn't be the end, only the start.SUIUSDT has much more to give. We can expect the market to turn and remained green.
Bitcoin - Bears vs Bulls: $100k next?

Price recently tapped into a well-defined 4H and daily resistance zone and was met with an immediate rejection. That rejection wasn’t just a reaction, it led to a confirmed market structure shift as price broke the previous low. This transition from higher highs to a lower low signals the first sign of bearish control, flipping the short-term bias and setting the tone for a move lower.Retest of MSS and Inversion Fair Value GapAfter the break in structure, price retraced directly into the origin of the move, retesting the same zone where the shift occurred. A previously bullish 4H gap has now flipped into resistance, rejecting price perfectly. This inversion, where a bullish imbalance turns into a bearish reaction zone, confirms the change in direction and strengthens the downside narrative.New FVG as Entry OpportunityThe latest bearish impulse created a clean new fair value gap just above current price. A retest of this gap would offer a high-probability continuation setup, as it aligns with both recent structure and order flow. This zone becomes the critical level for bears to defend, and unless price reclaims it, the expectation remains for continuation toward lower liquidity.Liquidity Outlook and Bearish TargetBelow current price, a large pool of liquidity is sitting just above a major psychological round number. That level hasn’t been swept yet and is a likely downside magnet. With no meaningful support between the current FVG and that draw on liquidity, price is likely to reach for it next. This fits the typical sequence following a market structure shift: rejection, shift, retest, continuation, and liquidity sweep.Momentum and Contextual ConfluenceZooming out slightly, the current move fits within broader bearish momentum that has been developing across timeframes. There’s no sign of strong bullish absorption, and each push higher has been met with efficient selling. This isn’t a chaotic breakdown, but a controlled sequence of lower highs and lower lows, supported by clean structural shifts and consistent rejection zones.ConclusionThe chart tells a clear story. A clean rejection from a key resistance zone led to a confirmed bearish structure shift, followed by a textbook retest and fresh fair value gap. As long as price remains below that gap, the setup favors continuation lower, with the nearest liquidity pool being the most likely draw. This remains a high-probability bearish scenario until proven otherwise by a shift back above invalidation levels.___________________________________
bitcoin oh bitcoin

Bitcoin has been pumping in the past few days pretty massively. Why? There are 2 main reasons - the first reason is that Bitcoin has finished a major WXY corrective wave, and the second is that Bitcoin swept liquidity below a triangle (see my previous post for details). That was a very good opportunity to buy/long Bitcoin at that specific level I described in the previous analysis. But let's focus on the present and future!We always want to find strong levels on the charts so we have a great entry point/take profit target. The next strong level is definitely the 0.618 FIB, which Bitcoin can hit in the very short term. Also, below the 0.618 FIB, we have a strong horizontal zone, which can also act as a strong resistance. Bitcoin should definitely go there and retest this zone.We want to see how Bitcoin is going to react in the zone and FIB, but you can create a new limit order to short Bitcoin there so you don't miss anything. So currently I am temporarily bullish on Bitcoin, and in the next update I will make a big analysis on Bitcoin and a very likely scenario for the next months. What will the price of Bitcoin be in December? Please like/boost my idea right now.Write a comment with your altcoin + hit the like button, and I will make an analysis for you in response. Trading is not hard if you have a good coach! This is not a trade setup, as there is no stop-loss or profit target. I share my trades pri
bitcoin is hot
Bitcoin has been pumping in the past few days pretty massively. Why? There are 2 main reasons - the first reason is that Bitcoin has finished a major WXY corrective wave, and the second is that Bitcoin swept liquidity below a triangle (see my previous post for details). That was a very good opportunity to buy/long Bitcoin at that specific level I described in the previous analysis. But let's focus on the present and future!We always want to find strong levels on the charts so we have a great entry point/take profit target. The next strong level is definitely the 0.618 FIB, which Bitcoin can hit in the very short term. Also, below the 0.618 FIB, we have a strong horizontal zone, which can also act as a strong resistance. Bitcoin should definitely go there and retest this zone.We want to see how Bitcoin is going to react in the zone and FIB, but you can create a new limit order to short Bitcoin there so you don't miss anything. So currently I am temporarily bullish on Bitcoin, and in the next update I will make a big analysis on Bitcoin and a very likely scenario for the next months. What will the price of Bitcoin be in December? Please like/boost my idea right now.Write a comment with your altcoin + hit the like button, and I will make an analysis for you in response. Trading is not hard if you have a good coach! This is not a trade setup, as there is no stop-loss or profit target. I share my trades privately. Thank you, and I wish you successful trades!
bitcoin testing water

Bitcoin has been pumping in the past few days pretty massively. Why? There are 2 main reasons - the first reason is that Bitcoin has finished a major WXY corrective wave, and the second is that Bitcoin swept liquidity below a triangle (see my previous post for details). That was a very good opportunity to buy/long Bitcoin at that specific level I described in the previous analysis. But let's focus on the present and future!We always want to find strong levels on the charts so we have a great entry point/take profit target. The next strong level is definitely the 0.618 FIB, which Bitcoin can hit in the very short term. Also, below the 0.618 FIB, we have a strong horizontal zone, which can also act as a strong resistance. Bitcoin should definitely go there and retest this zone.We want to see how Bitcoin is going to react in the zone and FIB, but you can create a new limit order to short Bitcoin there so you don't miss anything. So currently I am temporarily bullish on Bitcoin, and in the next update I will make a big analysis on Bitcoin and a very likely scenario for the next months. What will the price of Bitcoin be in December? Please like/boost my idea right now.Write a comment with your altcoin + hit the like button, and I will make an analysis for you in response. Trading is not hard if you have a good coach! This is not a trade setup, as there is no stop-loss or profit target. I share my trades privately. Thank you, and I wish you successful trades!
bitcoin is cool

Bitcoin has been pumping in the past few days pretty massively. Why? There are 2 main reasons - the first reason is that Bitcoin has finished a major WXY corrective wave, and the second is that Bitcoin swept liquidity below a triangle (see my previous post for details). That was a very good opportunity to buy/long Bitcoin at that specific level I described in the previous analysis. But let's focus on the present and future!We always want to find strong levels on the charts so we have a great entry point/take profit target. The next strong level is definitely the 0.618 FIB, which Bitcoin can hit in the very short term. Also, below the 0.618 FIB, we have a strong horizontal zone, which can also act as a strong resistance. Bitcoin should definitely go there and retest this zone.We want to see how Bitcoin is going to react in the zone and FIB, but you can create a new limit order to short Bitcoin there so you don't miss anything. So currently I am temporarily bullish on Bitcoin, and in the next update I will make a big analysis on Bitcoin and a very likely scenario for the next months. What will the price of Bitcoin be in December? Please like/boost my idea right now.Write a comment with your altcoin + hit the like button, and I will make an analysis for you in response. Trading is not hard if you have a good coach! This is not a trade setup, as there is no stop-loss or profit target. I share my trades privately. Thank you, and I wish you successful trades!
bitcoin is going crazy

Bitcoin has been pumping in the past few days pretty massively. Why? There are 2 main reasons - the first reason is that Bitcoin has finished a major WXY corrective wave, and the second is that Bitcoin swept liquidity below a triangle (see my previous post for details). That was a very good opportunity to buy/long Bitcoin at that specific level I described in the previous analysis. But let's focus on the present and future!We always want to find strong levels on the charts so we have a great entry point/take profit target. The next strong level is definitely the 0.618 FIB, which Bitcoin can hit in the very short term. Also, below the 0.618 FIB, we have a strong horizontal zone, which can also act as a strong resistance. Bitcoin should definitely go there and retest this zone.We want to see how Bitcoin is going to react in the zone and FIB, but you can create a new limit order to short Bitcoin there so you don't miss anything. So currently I am temporarily bullish on Bitcoin, and in the next update I will make a big analysis on Bitcoin and a very likely scenario for the next months. What will the price of Bitcoin be in December? Please like/boost my idea right now.Write a comment with your altcoin + hit the like button, and I will make an analysis for you in response. Trading is not hard if you have a good coach! This is not a trade setup, as there is no stop-loss or profit target. I share my trades privately. Thank you, and I wish you successful trades!7 days agoNoteBitcoin hit my profit target of 0.618 FIB and continues to the upside. It looks like we are going to hit 109,000 USD in the short term, which is a very strong resistance! Middle of the previous big range, so prepare for a bounce here.
bitcoin is pumping

Bitcoin has been pumping in the past few days pretty massively. Why? There are 2 main reasons - the first reason is that Bitcoin has finished a major WXY corrective wave, and the second is that Bitcoin swept liquidity below a triangle (see my previous post for details). That was a very good opportunity to buy/long Bitcoin at that specific level I described in the previous analysis. But let's focus on the present and future!We always want to find strong levels on the charts so we have a great entry point/take profit target. The next strong level is definitely the 0.618 FIB, which Bitcoin can hit in the very short term. Also, below the 0.618 FIB, we have a strong horizontal zone, which can also act as a strong resistance. Bitcoin should definitely go there and retest this zone.We want to see how Bitcoin is going to react in the zone and FIB, but you can create a new limit order to short Bitcoin there so you don't miss anything. So currently I am temporarily bullish on Bitcoin, and in the next update I will make a big analysis on Bitcoin and a very likely scenario for the next months. What will the price of Bitcoin be in December? Please like/boost my idea right now.Write a comment with your altcoin + hit the like button, and I will make an analysis for you in response. Trading is not hard if you have a good coach! This is not a trade setup, as there is no stop-loss or profit target. I share my trades privately. Thank you, and I wish you successful trades!
Disclaimer
Any content and materials included in Sahmeto's website and official communication channels are a compilation of personal opinions and analyses and are not binding. They do not constitute any recommendation for buying, selling, entering or exiting the stock market and cryptocurrency market. Also, all news and analyses included in the website and channels are merely republished information from official and unofficial domestic and foreign sources, and it is obvious that users of the said content are responsible for following up and ensuring the authenticity and accuracy of the materials. Therefore, while disclaiming responsibility, it is declared that the responsibility for any decision-making, action, and potential profit and loss in the capital market and cryptocurrency market lies with the trader.