
p4917
@t_p4917

What symbols does the trader recommend buying?
Purchase History
پیام های تریدر
Filter
p4917
$MSTR - The Rocket Takes Off
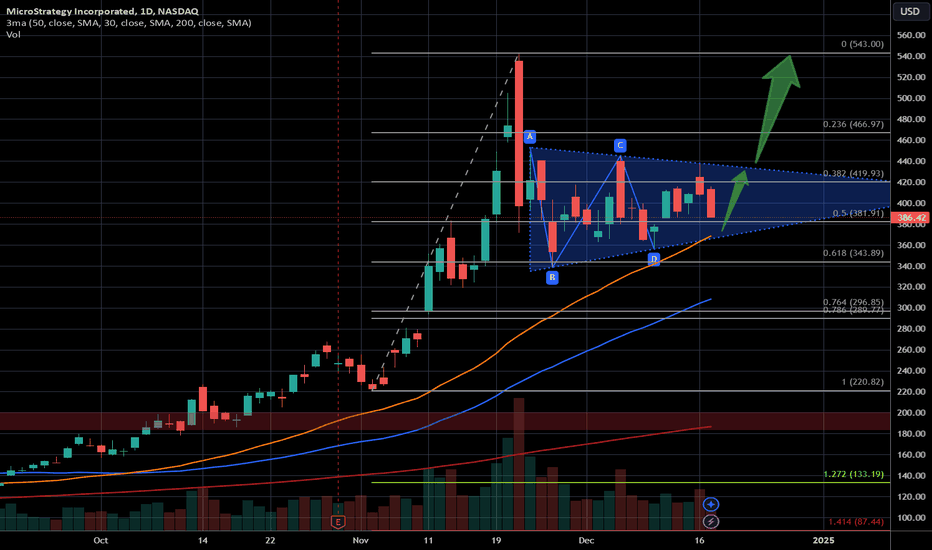
Here is the daily chart for $MSTR. With its recent inclusion in QQQ , the stock appears poised for further growth. From a technical perspective, the current triangle formation suggests potential downside movement toward $368, where the price may test the lower boundary of the pattern. Following this, I anticipate a bullish breakout to the upside. The resistance near the previous all-time high (ATH) is unlikely to hold for long, and I expect MSTR to surpass this level in its upward trajectory.The triangle completely failed (haters put shame on me ;) ), but I'm staying bullish for now. The line chart is offering a bullish flag like this: Let's see if it plays out. Price should stabilize by the 23rd of Dec because all ETFs got to buy by this date. Maybe we see tomorrow already a bullish day. Let's see.
p4917
Two weeks of bullish momentum ahead?
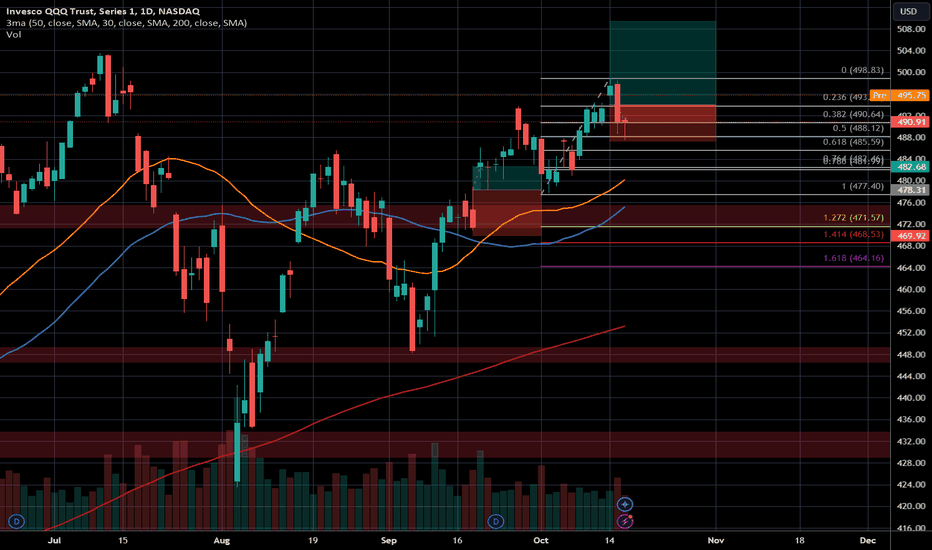
I entered a long position in the QQQ ETF a few days ago after the price pulled back to the previous high. It was a slightly premature entry, as the price continued to pull back to the 50% retracement level of the last bullish move. 😉 The overall chart looks a bit exhausted from the bullish run following the August low, but I still expect the NASDAQ to rise until the US election. Statistically, since the 1950s, there has been over an 80% chance that the stock index rises before the election. Additionally, we're supported by the SMAs, and there’s still some room left until the ATH is reached. Good trades, folks!
p4917
Long swing in Gold

Looks like XAUUSD has done an ABC correction to the downside, has re-tested no the 61.8 % fib retracement and the SMA 30.I've placed my stop underneath the 50 SMA - let's see how this works out.Bang! SL was been hit. If the next candle is green and makes it above the 61.8 retracement again, I'll enter again long.Okay, now again stopped in:If the yellow metal gives me again a face punch, I'll stay out of the market till Q4 - but let's see how it works this time;)
p4917
Building a long position
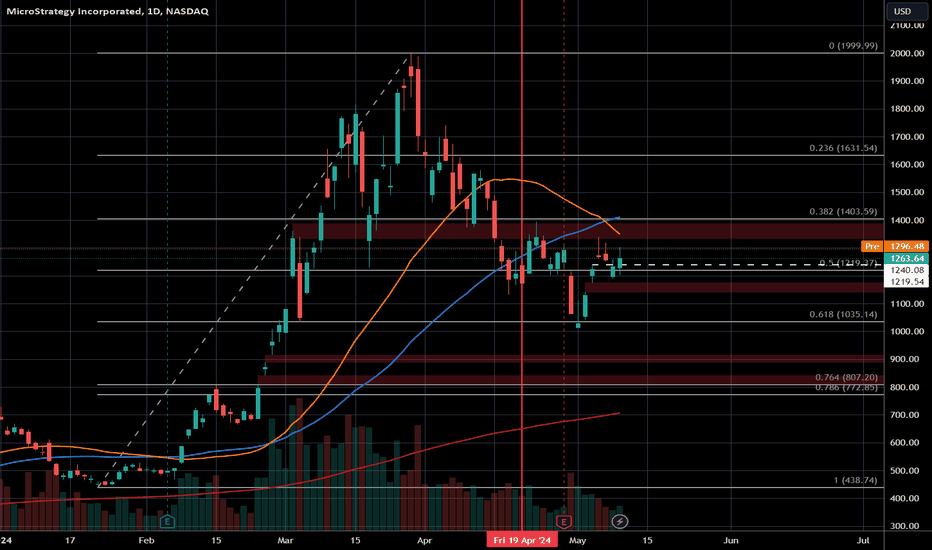
So, in the last days I'm building a new long position in MSTR. Technically I should wait until the 38.2 fib retracement is broken to the top. But I'm partly entering already around current prices and got a limit order waiting at the next gap around 1,150. Let's see how this works out. ;)
p4917
Pretty bullish, Bitcoin

As show here - bullish flag in Bitcoin. Despite this, I would not enter long before BTCUSD reaches or surpasses prices around 52,100 USD.Bullish scenario activated
p4917
2nd view on $MSTR vs. $BTCUSD
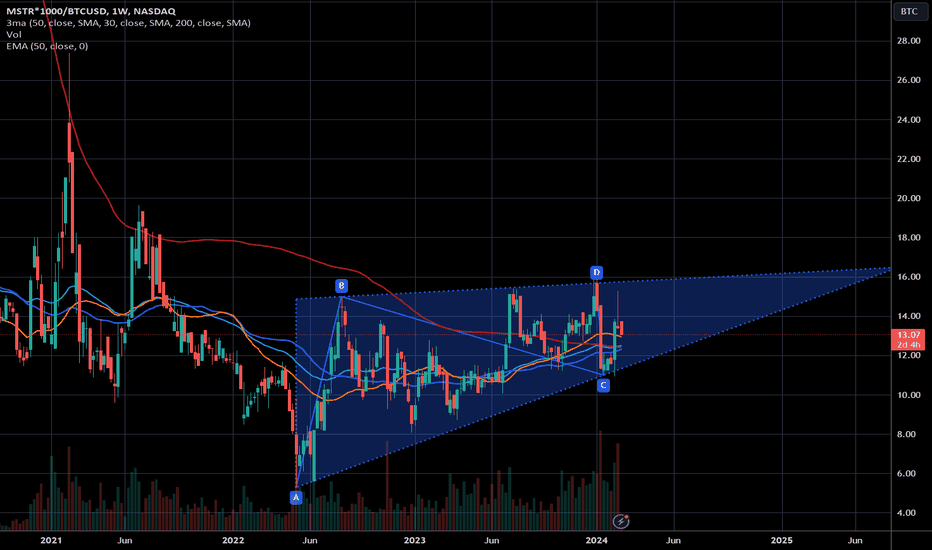
Normalized view on the MSTR stock price vs. Bitcoin (BTCUSD). On this weekly timeframe you can see, that we're about to get an golden cross (blue MA 50 crosses red MA 200 to the upside). If this price keeps on moving upwards and breaks the triangle/wedge to the upside, it's a clear indicator that one should be better in MicroStrategy than in Bitcoin itself.Breakout. MSTR seems to win the race ...
p4917
Pure technical analysis quick and simple 📈

Looks like we can open the bullish case.Triangle formation has broken to the upper sideRe-Test of the triangle on the upside on FridayPrice above still above the 50 SMAShort-term MAs are bullish aligned (17 EMA > 30 SMA > 50 SMA)Could be a nice long setup. Valid on the daily and weekly timeframe. If the price drifts further down, I would see this setup invalidated.Unfortunately, the triangle didn't work. I've adjusted the shape now and see what we've got: A rising channel. But this could be considered also as a bearish flag. However from the current position it seems to be more likely that BTC is doing a bounce to the upside. But it's questionable if BTC can leave the channel ...Looks like tomorrow we can see a pump in BTC - or a dump. ;) I'm expecting rather a pump, but could also be wrong ...Yesterday's assumption was wrong - it went south. But I've re-drawn the channel now because it has confirmed some significant points on the chart. The upward channel seems to be nevertheless still valid. Waiting for a bounce to the upside of this channel:
p4917
With Ether we'll fly ...

Usually, I don't watch ETH, but this seems to be a no brainer:The triangle pattern got broken on a weekly scale to the upside.+ Price seems to close above the 50's weekly MA.My price target is around 4125 USD. Then we need to re-evaluate the market.So far it seems like a classical re-test of the broken chart pattern. If ETH stays above ~2925 I would see this setup still as valid.
p4917
KISS BTC 😘

Keep It Simple Stupid - also in Bitcoin.I've drawn a triangle over the chart in D1 and a bigger triangle in W1. Using only the daily resp. weekly closing prices. And this triangle looks valid to me.I've seen people drawing wedges or flags in the charts but the triangle is a more reliable chart pattern. So it may take a few days in the daily chart or 1-2 weeks in the weekly chart until this formation gets resolved but it will get resolved finally. ;)And yes, it's more likely that symmetric triangles get broken to the upside. I think then we see 75k as the next stop.The triangle pattern drawn on the daily timeframe has to break at the latest on Thursday - so only a few days left to wait. 🍾Went faster than yesterday expected. But yes - that's the way. We're temporarily stuck at the closing high of the ATH candle but I don't expect a major resistance here. If we don't overcome this level even today than it will be surely broken during the next days.
Disclaimer
Any content and materials included in Sahmeto's website and official communication channels are a compilation of personal opinions and analyses and are not binding. They do not constitute any recommendation for buying, selling, entering or exiting the stock market and cryptocurrency market. Also, all news and analyses included in the website and channels are merely republished information from official and unofficial domestic and foreign sources, and it is obvious that users of the said content are responsible for following up and ensuring the authenticity and accuracy of the materials. Therefore, while disclaiming responsibility, it is declared that the responsibility for any decision-making, action, and potential profit and loss in the capital market and cryptocurrency market lies with the trader.