
otantikripto
@t_otantikripto

What symbols does the trader recommend buying?
Purchase History
پیام های تریدر
Filter
otantikripto
Bitcoin (BTCUSDT) Analizi

Bitcoin, adhering to Total M.Cap; Support and resistance levels created after examination with technical, on-chain and fundamental analysis methods.
otantikripto
BITCOIN GÜNCEL GRAFİK / 1D.

We have come to the days when daily closings are individually important. There is no such situation as in the chart right now, but closings below $31,000 may turn the picture to this. In fact, we can add around $28600 to this in the short term, but #bitcoin must exceed $31,000 to be sure of an increase. At the same time, these levels must be exceeded on the weekly chart for an increase expectation. If sales are heavy in this process, the price may first decline to around $25,000 (MA200 at $25,000 levels). We entered an uptrend with the reaction we received from around $15,000. It seems as if the market needs to test the trend again and take this level as support. When we check the price orders, we can see that there are buyers first around $25,000 and then in the $21,500-22,000 band. In the coming days, a possible FUD and/or negative news that will affect our market may cause 25K to lose its support and a pullback to around $21,500 $22,000 may occur. At this point, point D may be a turning point for us. In this context, when we come to the formation on the chart; we cannot talk about a 5-0 Pattern structure here for now, but I will follow its formation. If the basic and technical conditions I mentioned above occur, the price may fall to point D of the pattern. I will not explain the pattern in detail, but Scott Corney interprets this pattern as the last correction before the big rise. In technical terms, there is a lot of data that supports this data ''for now''. However, of course, we need to see a return from point D to take action.
otantikripto
SOL (SOLANA) HODL DEVAM...

The level we entered months ago for SOL was 28.5k. The rise to $260 was faster than I expected and therefore we took profits in the regions. A possible rally with the market starting to rise again is also on the chart for SOLANA... I always look at such projects as an opportunity to buy as they fall... If we are going to HODL, Solana will come next for me after Bitcoin and Ethereum...YTD.
otantikripto
ETHEREUM ALIM-SATIM LOKASYONLARI

Hello friends; I have determined the green areas as partial purchase locations for Ethereum. I have also determined the sales locations as red areas according to the purchase location... The levels I have determined with Fibonacci numbers may vary depending on the market situation. For this reason, I would like to remind you that it is dangerous to enter with a large amount.
otantikripto
BITCOIN'DE BEKLENEN HAREKET NEDİR?

In the short term, if bitcoin 38700 is exceeded and remains above this level, the channel target will be around 47k. If the channel is not exceeded, $31K will be a critical level. If there is an increase above the channel, the 47k level also coincides with the 100-day moving average. There may be selling pressure here, but a needle may also come to $51k to explode short positions...
otantikripto

otantikripto
BITCOIN Stop ve Likidite Operasyonu

Hello friends..Everyone has an expectation of an exit in market dynamics. If it rises or rises according to expectations, everyone wins. This decline in Bitcoin seems to me to be done to a great extent to blow up the stops of margin transactions and to liquidate these transactions. For this reason, I think the main direction of the market is still up, as it was in the 30k decline. When we examine it technically, if a closing below 57.7k comes on Bitcoin's daily chart, we can see other levels, but this seems like a strong buying point. We have seen support from -2 sigma in the Bollinger band for now. There is still no problem in the medium and long term. I will share instant updates from my twitter account according to the closing.
otantikripto
IOTA KANAL HAREKETİNE DEVAM EDİYOR.
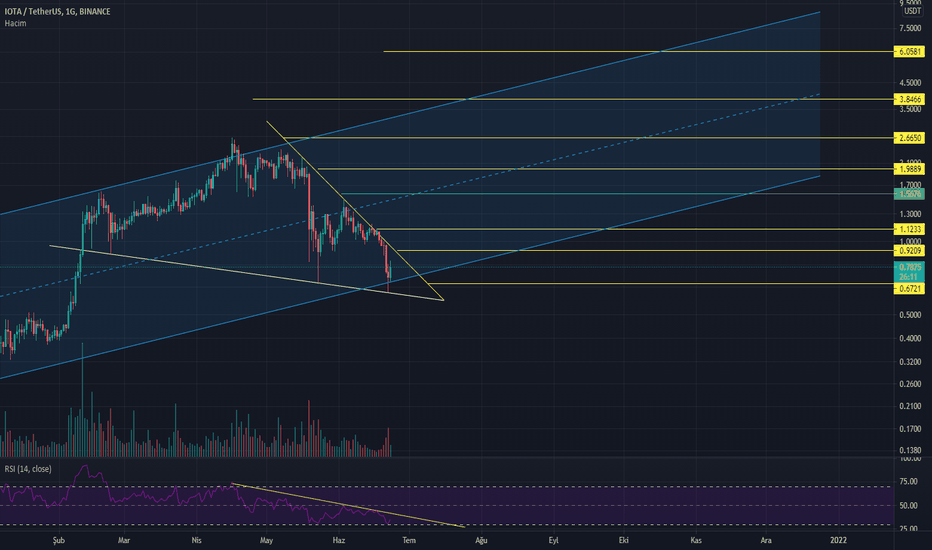
Hello friends, the 1G log. chart I drew in IOTA the other day is still valid. There was a diagonal (white line) trend line I drew days ago, but I waited for another touch point to be sure. With BTC falling to 28k, I became sure of this line. As in all alt coins, IOTA also fell and created a clear descending wedge formation here. There is no change for me in the previous chart I drew. I just wanted to share it when I saw that there was a supportive element regarding the direction of IOTA. I would also like to emphasize that BTC continues its channel movement that we determined in its 28k decline. A coin that I follow in the medium term, short-termists can act according to the break of the yellow horizontal line as I stated in the previous chart I drew. Please note that the chart is daily. Note: The charts I have drawn are definitely not investment advice.
otantikripto
BTC 28K' LARI GÖRDÜ. AYI MI? AKÜMÜLASYON MU?

Hello friends, when we look at the general situation of BTC in recent days, it broke the strong support at 34,600 and hit its first stop, 33k. We said that 30k would come to the agenda with the break of this level. In the daily chart, it broke below the 30k support, which is still an important support for me, to the 28,600 level. At this point, are we bearish? Or are we accumulating? There were two important data that I followed to be able to answer the question. 1- Whether it closed the daily candle below 30k. 2- Volume data formed during the decline or rise. When we look at our first data, we see that it closed above 30k as a result of buying at 28,600. When we look at our other data, we can see that the volume has increased significantly, that is, there are heavy buyers at 28k. In this table, I cannot say that we are in the bear season. In addition to 30k being a good resistance in technical terms, it was also an important psychological limit. Despite falling below this level, the dominance of buyers is a positive situation for me. So when we think about why there was buyer pressure at 28k, Bitcoin was stuck at resistance when it reached 42k levels on January 10, 2021 and its decline began. The point where this decline turned was the 28600 level. After this turn, Bitcoin saw the ATH level of 64k. In other words, we can say that those who invested in volume in the market did not allow the market to fall below this level. When we ask, are we bears in light of all this data? When we take into account that the bear season does not cover a period of 3-5 months, I still do not think we are bears. When volume day closings occur below 30k and when 30k appears as a strong resistance, then we can talk about the bear scenario. When we examine the current situation of BTC, we see that it closed a candle above the upward trend formed in the medium term with the reaction received from 28k. Afterwards, we come across the 34,600 level, which has not yet been passed. BTC It has created too much resistance and support between 33-41k. For this reason, it seems like there are too many points to be passed. Our first limit is 34,600, then the short-term downtrend needs to break. If these two points are passed, the 41k and -43k ranges that we have been saying for days are very, very important. If this is passed, our first stop will be the 46k level. However, please do not forget that we always need to follow the volume break of the resistance points in order for these levels to come. As a result, this decline in BTC did not change the analyzes we have done in the past weeks. We only confirmed that we are in the accumulation that I said on Twitter. Support and resistance ranges can be used to open a transaction, but the market is very prone to sudden dumps and pumps right now. Panic buying or selling should not be done. As I stated in the previous charts, I do not expect a decline in the medium and long term before closing below 30k. I still indicated the points that may come when it falls below 30k on the chart, but in such a case, we will update the chart again. I am currently doing an analysis on indicator data. When it is finished, I will share the indicator data along with the fundamental analysis. I hope what I said was understandable. If you have any additional ideas or opinions, I would be happy if you could state them. Information increases as it is shared. Note: The charts I have drawn are definitely not investment advice.
otantikripto
DENT MUAZZAM BİR SİMETRİK ÜÇGEN FORMASYONU

Hello friends, Dent 4's log. has created a nearly perfect symmetrical triangle formation on the chart. It will bring its target without any surprise in whichever direction it breaks. The targets in the upward break and the targets in the downward break are on the chart. I hope it creates a good opportunity for those who stay inside. Note: The charts I have drawn are definitely not investment advice.
Disclaimer
Any content and materials included in Sahmeto's website and official communication channels are a compilation of personal opinions and analyses and are not binding. They do not constitute any recommendation for buying, selling, entering or exiting the stock market and cryptocurrency market. Also, all news and analyses included in the website and channels are merely republished information from official and unofficial domestic and foreign sources, and it is obvious that users of the said content are responsible for following up and ensuring the authenticity and accuracy of the materials. Therefore, while disclaiming responsibility, it is declared that the responsibility for any decision-making, action, and potential profit and loss in the capital market and cryptocurrency market lies with the trader.