
ntulilwageophrey
@t_ntulilwageophrey

What symbols does the trader recommend buying?
Purchase History
پیام های تریدر
Filter
ntulilwageophrey
BTCUSD SELL SETUP
POSSIBLE SELL SETUP BTCUSD SL ABOVE SUPPLY ZONE TP 1 BELOW DEMAND ZONE TP 2 OPEN USE PROPER RISK MANAGEMENT FOLLOW YOUR TRADING PLAN !!!! SIMPLE BTCUSD TRADING PLAN 1️⃣ Timeframe 15m or 1H only 2️⃣ Indicators 200 EMA → trend 50 EMA → entry RSI (14) → confirmation 3️⃣ BUY RULES ✅ Price above 200 EMA ✅ Pullback to 50 EMA ✅ RSI above 50 ✅ Bullish candle ➡️ Then BUY 4️⃣ SELL RULES ✅ Price below 200 EMA ✅ Pullback to 50 EMA ✅ RSI below 50 ✅ Bearish candle ➡️ Then SELL 5️⃣ Risk Rules Risk 1% per trade Always use Stop Loss Target = 2× Stop Loss (1:2) 6️⃣ Management At 1:1, move stop to breakeven Do nothing else 7️⃣ Golden Rules ❌ No stop loss = no trade ❌ No emotions ❌ No overtrading ONE LINE RULE If all rules aren’t met → NO TRADE
ntulilwageophrey
آمادهسازی خرید بیت کوین (BTCUSD): استراتژی ورود، حد ضرر و سود (معامله در محدوده 100,000 دلاری)
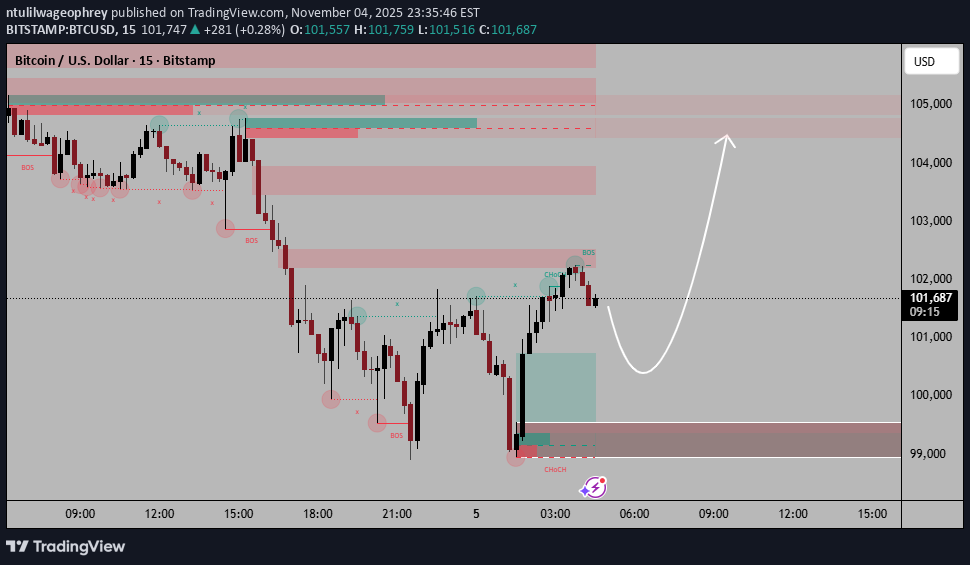
🎯 Entry Plan Step 1 – Wait for Retracement Be patient and wait for price to come back into the demand zone (around 100,000–99,500). Do not enter while price is still retracing — you want confirmation inside the zone. Step 2 – Confirmation Entry On a lower timeframe (5M or 1M): Watch for: Liquidity sweep (price takes out a recent low inside the demand zone). Change of Character (ChoCH) to the upside. Bullish engulfing or strong momentum candle confirming buyers are active. Step 3 – Entry Trigger Enter long (buy) on the candle after the ChoCH confirmation. This helps ensure you’re catching the start of the bullish leg. Step 4 – Stop Loss and Take Profit ParameterPlacement Stop Loss (SL)Below the demand zone (below 99,000) Take Profit 1 (TP1)103,000 (mid supply area) Take Profit 2 (TP2)104,500–105,000 (main supply area) A typical risk-to-reward ratio here would be 1:3 or better.
ntulilwageophrey
تحلیل طلای جهانی (XAUUSD): استراتژی قطعی خرید یا فروش در این منطقه حساس!
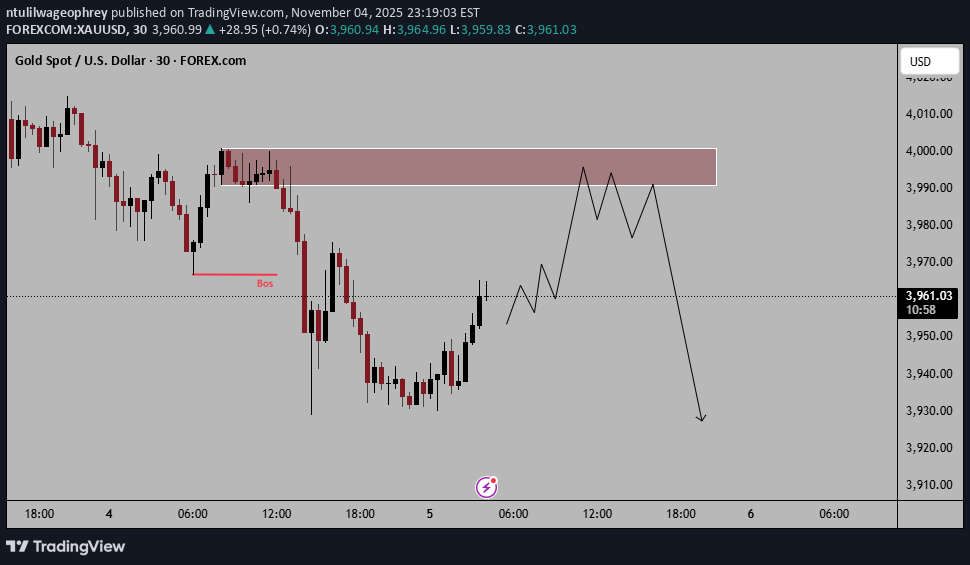
🎯 Entry Plan Step 1 – Wait for Price to Reach Supply Zone Don’t enter early. Wait until price comes into the highlighted supply area. Step 2 – Look for Reversal Confirmation Once price is inside the zone, look for lower timeframe confirmations (on 5m or 15m): Break of structure (BoS) to the downside within the zone. Rejection candles (like bearish engulfing, pin bar). Liquidity grab above previous highs. Step 3 – Entry After confirmation, enter a short position when price breaks the internal structure downward (mini BoS). This ensures you are entering after momentum shifts. Step 4 – Stop Loss & Take Profit Stop Loss (SL): Just above the supply zone (e.g., above 4,005). Take Profit (TP): First target: Previous low (around 3,930). Extended target: 3,910 or lower depending on continuation.
ntulilwageophrey
سیگنال فروش طلا (XAUUSD): تله نقدینگی و سقوط احتمالی تا 3950 دلار!
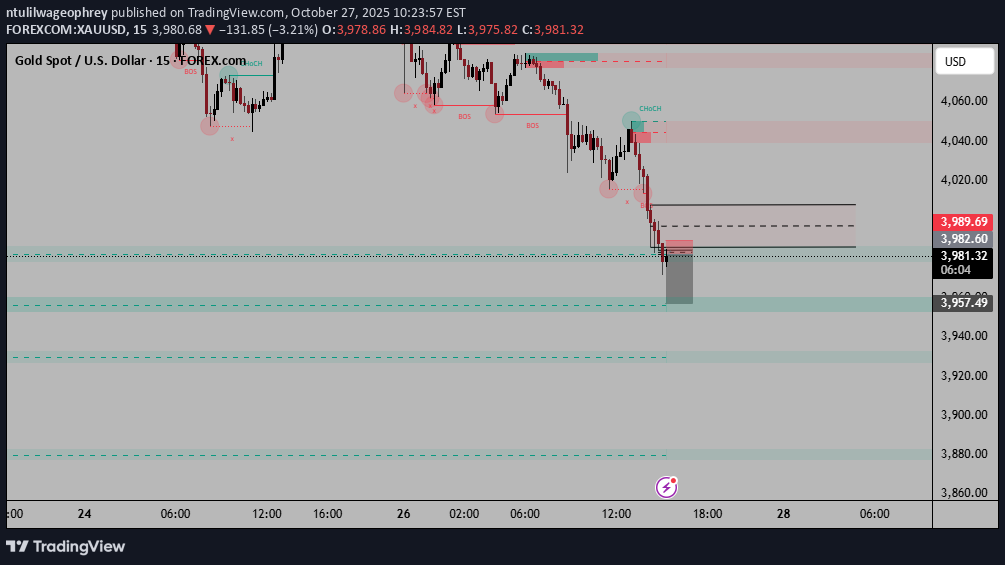
🧭 Market Context Pair: Gold / USD (XAU/USD) Timeframe: 15-minute Current price: ≈ $3,981.72 The chart shows a clear bearish structure, with consecutive lower highs and lower lows. A Break of Structure (BOS) has confirmed bearish control after liquidity was taken from the previous high. 🧱 Key Zones Supply Zone (Sell area): Highlighted in red: around $3,985 – $3,990 This zone aligns with a prior imbalance and structure break, where sellers stepped in. Demand Zone (Target area): Highlighted in green: around $3,957 – $3,950 This is where previous buying occurred and where liquidity likely rests below. 📉 Sell Setup Details Entry (Sell limit): ~$3,985.00 Inside the lower half of the red supply zone for best risk-to-reward. Stop Loss (SL): ~$3,990.00 Above the supply zone and last minor high to protect against false breakouts. Take Profit (TP): TP1: $3,970.00 — midpoint between current price and main target (≈1:2 R:R) TP2: $3,957.00 — lower demand zone (≈1:4 R:R) ⚙️ Trade Logic Liquidity Grab: The previous high near $3,990 was taken out — a classic liquidity sweep before the drop. Break of Structure: A clean BOS confirms sellers now dominate. Retracement: Price is currently pulling back toward the supply zone, ideal for short re-entry. Imbalance fill: The retracement aligns with a fair value gap (FVG) that may get mitigated before continuation down. 💡 Trade Management Tips If price rejects strongly before entering the full zone, consider a market entry after a bearish engulfing or M1 BOS confirmation. Move SL to breakeven once price passes $3,972. Partial close at TP1, let remainder run to TP2.
ntulilwageophrey
سیگنال فروش بیت کوین: آیا ریزش تا ۱۱۳ هزار دلار قطعی است؟
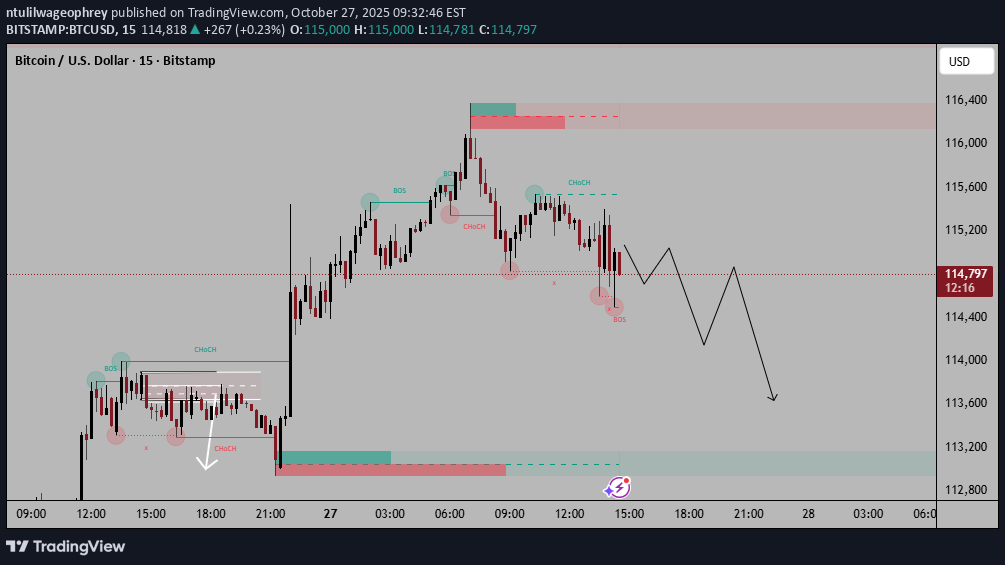
Current price: around $114,976 Recent structure: The price made a CHoCH after forming a lower high around $115,600, signaling a potential shift from bullish to bearish momentum. BOS confirmation: A break of structure downward confirms sellers taking control. Supply zone: A red zone above ~$115,400–$116,000 shows a bearish supply area, where price could retrace to before continuing lower. Expected move: A short-term pullback (retracement) toward ~$115,200–$115,400 before a continuation down toward the demand zone near $113,200–$112,800. 📉 Sell idea summary: Bias: Bearish Entry zone: ~$115,200–$115,400 (after retracement) Target: ~$113,200 Stop loss: Above ~$115,600
ntulilwageophrey
BTCUSD POSSIBLE BUY SETUP
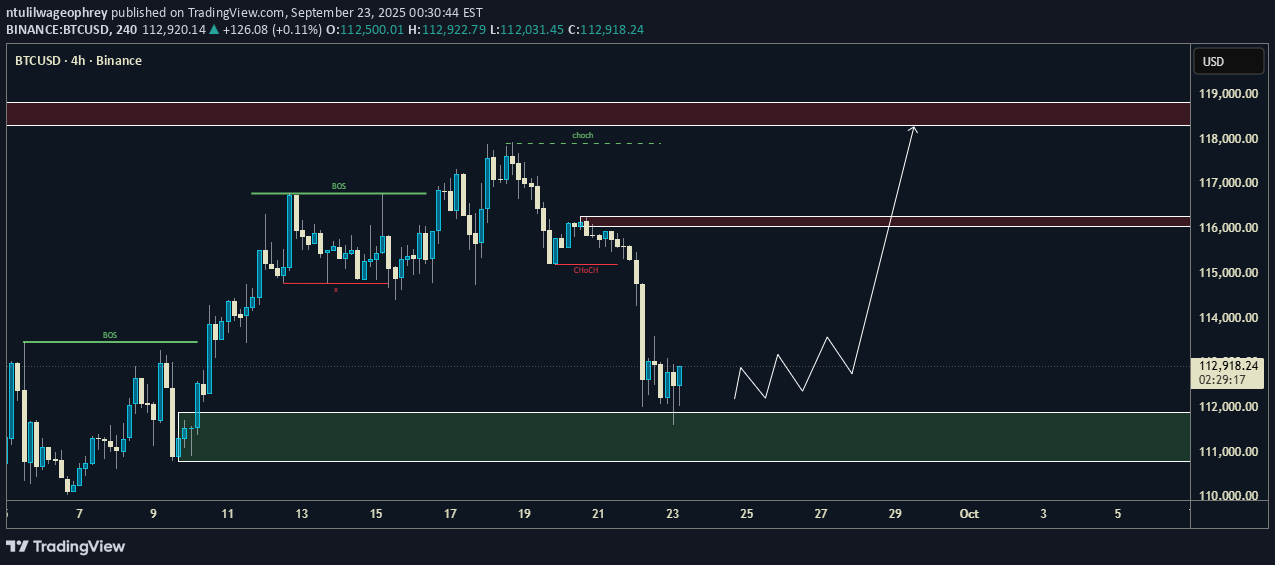
💡 BTCUSD 4H Outlook – Recovery Setup in Play After a strong sell-off that created a Change of Character (ChoCH), price has now tapped into the demand zone around 112,000 – 113,000. From here, I’m watching for signs of accumulation and potential continuation back to the upside. 🔼 Bullish Scenario If buyers hold this demand, we could see a rally toward the first supply zone near 116,000. A clean break above that would open the way for a push toward the major resistance at 118,000 – 119,000. 🔽 Bearish Scenario Failure to hold 112,000 support could trigger further downside. Next liquidity sweep would likely come below 111,500 and possibly deeper. ⚔️ Key Levels to Watch Support: 112,000 | 111,500 Resistance: 116,000 | 118,000 – 119,000 📊 Current structure suggests bulls may try to defend this zone, giving a possible recovery leg. ✅ If this analysis helps you, hit the boost and follow for more updates on BTC and other pairs. 💼 For traders looking for account management services (personal or funded accounts), reach out — I can help with risk-managed growth and consistent strategies.
ntulilwageophrey
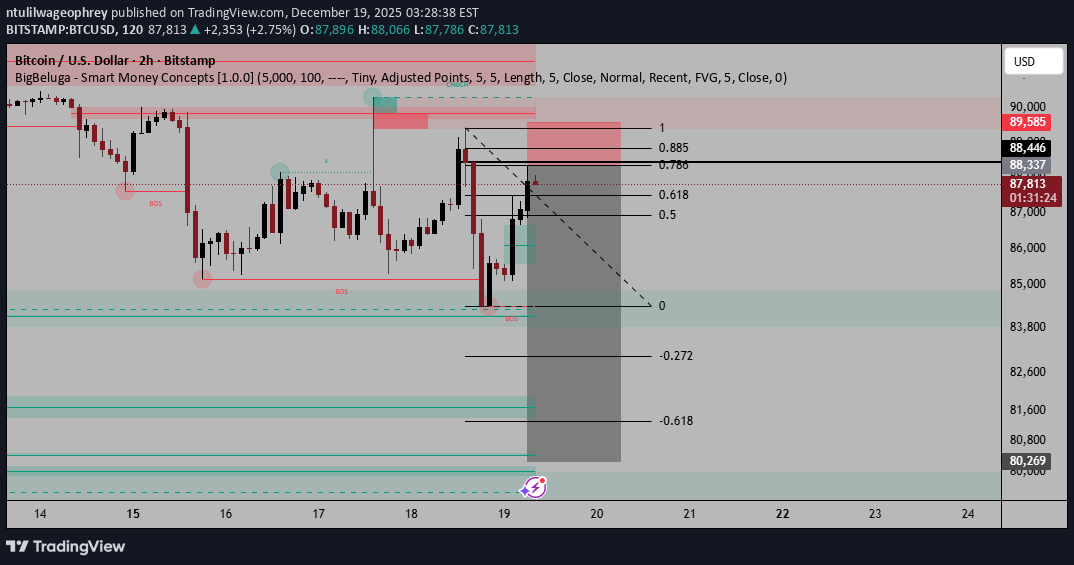
BTCUSD POSSIBLE BUY SETUP -----118K
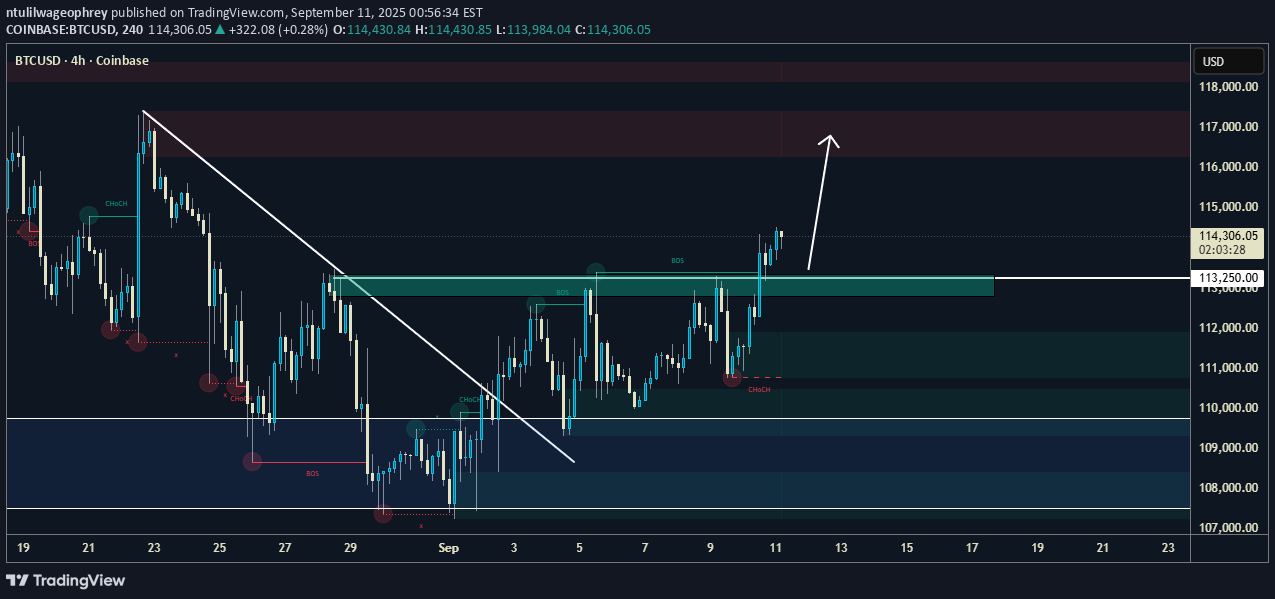
Break of Structure (BOS): Multiple bullish BOS indicate a trend reversal from bearish to bullish. Change of Character (CHoCH): Confirmed trend shift early on. Descending trendline broken: Signaling the end of bearish momentum. Price broke above resistance (~$113,250): Now acting as a support zone (highlighted in green). Current price: ~$114,272 Bullish target zone: Between $116,000 – $118,000, marked in maroon.
ntulilwageophrey
BTCUSD POSSIBLE BUY SETUP 112,167 TO 120,000
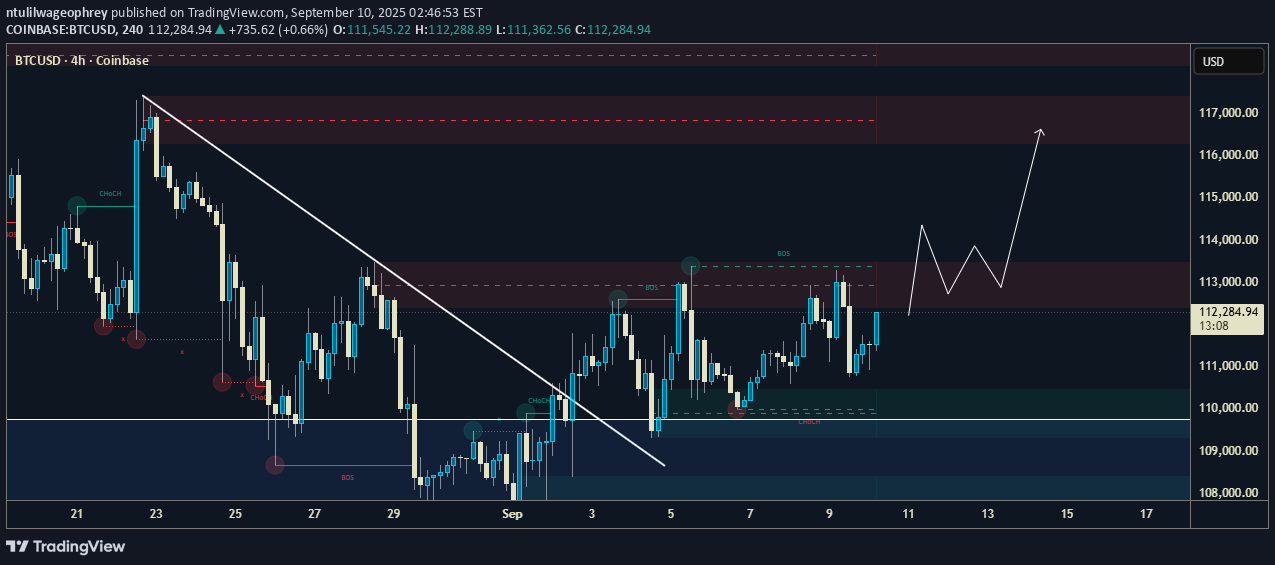
📊 BTCUSD – Potential Bullish Continuation Ahead Description: BTCUSD has recently shown a break of structure (BOS) and a clean break above the descending trendline. Price is currently forming higher lows, which suggests a possible continuation to the upside. Support Zone: $110,000 – $111,000 First Target Zone: $113,000 – $114,000 Main Target Zone: $116,000 – $117,000 My Bias (plan): I remain bullish as long as the price holds above $ 110,000. Possible entry: retracement around $111K – $112K. Stop Loss: below $110K. Take Profit: $113K – $117K. Risk Management: ⚠️ This is not financial advice. Manage your risk properly—never risk more than you can afford to lose. Community Note: I share analysis like this regularly. If you find it useful, feel free to follow me here on TradingView for more updates 🙌.
ntulilwageophrey
BTCUSD POSSSIBLE BUY SETUP STRUCTURE CHANGE
Clear Breakout of structure waiting for retracement, and there are other things to look at, like support and imbalance 1-BOS 2-FIB 78% 3-S&P 4-IMBALANCE 5-DEMAND ZONE
ntulilwageophrey
XAUUSD BUY SETUP
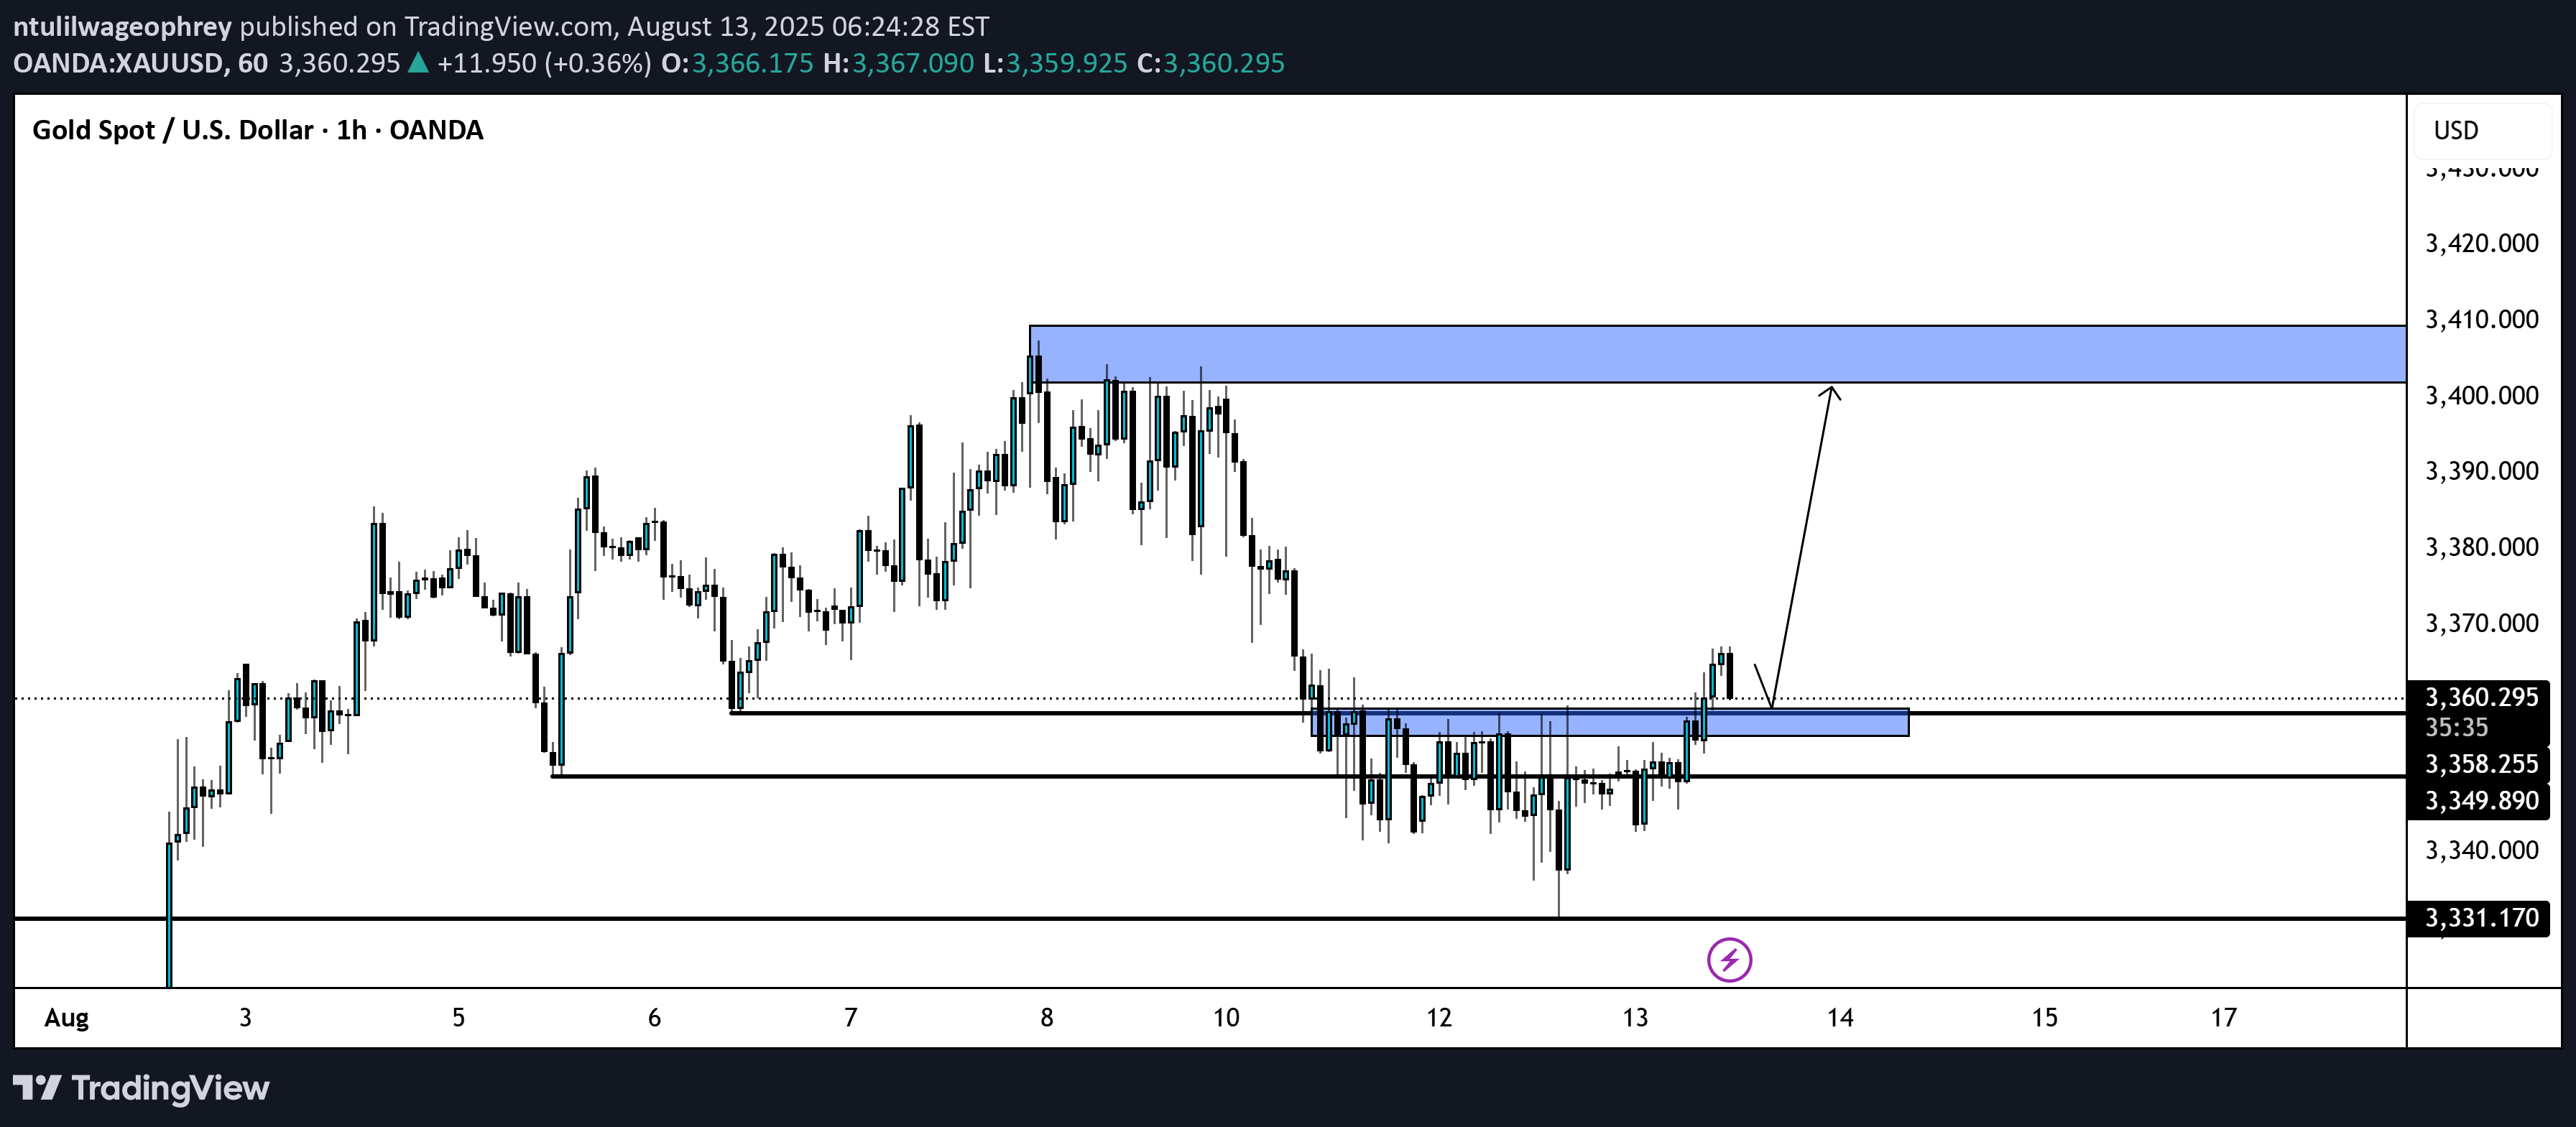
**📊 XAUUSD (Gold) – H1 Chart Analysis** **Date:** Aug 13, 2025 * **Current Price:** \$3,362.55 * **Structure:** Price broke above a minor resistance zone around **\$3,358 – \$3,360** (blue box), now acting as a support. * **Bias:** Bullish — expecting a retest of the breakout zone followed by a push to the next supply area. * **Target Zone:** **\$3,400 – \$3,410** (upper blue box) * **Key Supports:** * \$3,358 (new support) * \$3,350 * \$3,331 (major support) * **Key Resistances:** * \$3,400 * \$3,410 (strong supply area) **📝 Plan:** Watch for a pullback into the \$3,358 – \$3,360 zone and bullish confirmation before entering long toward \$3,400 – \$3,410. **⚠ Risk:** If price falls back below \$3,350, bullish setup may be invalidated.
Disclaimer
Any content and materials included in Sahmeto's website and official communication channels are a compilation of personal opinions and analyses and are not binding. They do not constitute any recommendation for buying, selling, entering or exiting the stock market and cryptocurrency market. Also, all news and analyses included in the website and channels are merely republished information from official and unofficial domestic and foreign sources, and it is obvious that users of the said content are responsible for following up and ensuring the authenticity and accuracy of the materials. Therefore, while disclaiming responsibility, it is declared that the responsibility for any decision-making, action, and potential profit and loss in the capital market and cryptocurrency market lies with the trader.